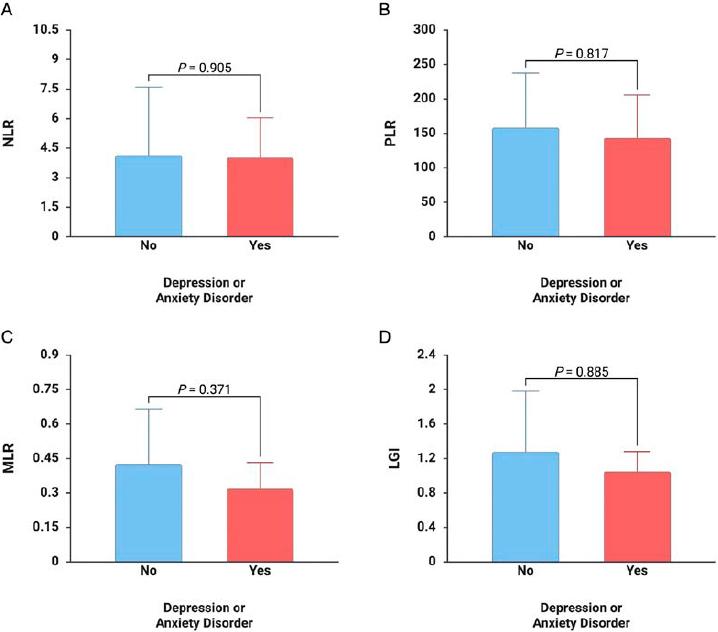
FIGURE 1.
Univariate analysis of risk factors for depression or anxiety disorder in patients with CLTI
| Variable | Depression or anxiety disorder | ||
|---|---|---|---|
| OR | 95% CI | p value | |
| Male | 2.19 | 0.66–7.27 | 0.199 |
| Age | 1.16 | 0.66–2.02 | 0.598 |
| Ischemic heart disease | 3.90 | 0.83–18.38 | 0.085 |
| Cardiovascular events | 4.44 | 1.26–15.67 | 0.020 |
| Cerebrovascular events | 13.05 | 3.74–45.49 | <0.001 |
| Active smoking | 0.98 | 0.31–3.16 | 0.979 |
| Obesity | 2.96 | 0.92–9.51 | 0.068 |
| Leriche–Fontaine classification | |||
| Stage III | 0.75 | 0.24–2.41 | 0.634 |
| Stage IV | 1.33 | 0.41–4.25 | |
Characteristics of the included patients
| Variable | Patients (n = 113) |
|---|---|
| Age, years, mean ± s.d. | 70.54 ± 8.96 |
| Male, n (%) | 88 (77.88%) |
| Comorbidities and risk factors, n (%) | |
| Hypertension | 101 (89.38%) |
| Ischemic heart disease | 72 (63.72%) |
| Chronic heart failure | 42 (37.17%) |
| Atrial fibrillation | 12 (10.62%) |
| Cardiovascular events | 16 (14.16%) |
| Cerebrovascular events | 21 (18.58%) |
| Diabetes mellitus | 70 (61.95%) |
| Chronic obstructive pulmonary disease | 12 (10.62%) |
| Obesity | 26 (23.01%) |
| Active smoking | 73 (64.60%) |
| Dyslipidemia | 52 (46.02%) |
| Laboratory data, median (Q1-Q3) | |
| Hemoglobin, g/dl | 13.0 (11.5-14.0) |
| Hematocrit, % | 38.20 (34.15-42.25) |
| WBC | 9.16 (7.32-10.51) |
| BUN, mg/dl | 38.5 (30.4-55.64) |
| Creatinine, mg/dl | 0.91 (0.78-1.16) |
| eGFR, ml/min/1.73 m2 | 84.76 (60.44-103.34) |
| Glucose, mg/dl | 117.0 (96.1-148.45) |
| Neutrophils, × 103/μl | 6.27 (4.73-7.71) |
| Lymphocytes, × 103/μl | 1.80 (1.44-2.26) |
| Monocytes, × 103/μl | 0.65 (0.51-0.85) |
| PLT, × 103/μl | 249.35 (205.25-307.1) |
| Clinical severity, n (%) | |
| Stage III Leriche-Fontaine, n (%) | 47 (41.59%) |
| Stage IV Leriche-Fontaine, n (%) | 66 (58.41%) |
| Depression or anxiety disorder, n (%) | 14 (12.39%) |
| Length of stay, days, mean ± s.d. | 6.27 ± 4.03 |
Demographic data, comorbidities, risk factors, and laboratory data based on the presence of depression or anxiety disorder
| Variable | Depression or anxiety disorder | p value | |
|---|---|---|---|
| No (n = 99) | Yes (n = 14) | ||
| Age, years, mean ± s.d. | 70.37±9.15 | 71.71±7.32 | 0.656 |
| Male, n (%) | 79 (79.80%) | 9 (64.29%) | 0.191 |
| Hypertension, n (%) | 90 (90.91%) | 11 (78.57%) | 0.161 |
| Ischemic heart disease, n (%) | 60 (60.61%) | 12 (85.71%) | 0.067 |
| Chronic heart failure, n (%) | 39 (39.39%) | 3 (21.43%) | 0.193 |
| Atrial fibrillation, n (%) | 11 (11.11%) | 1 (7.14%) | 0.652 |
| Cardiovascular events, n (%) | 11 (11.11%) | 5 (35.71%) | 0.013 |
| Cerebrovascular events, n (%) | 12 (12.12%) | 9 (64.29%) | <0.001 |
| Diabetes mellitus, n (%) | 61 (61.62%) | 9 (64.29%) | 0.529 |
| Chronic obstructive pulmonary disease, n (%) | 11 (11.11%) | 1 (7.14%) | 0.652 |
| Obesity, n (%) | 20 (20.20%) | 6 (42.86%) | 0.059 |
| Active smoking, n (%) | 64 (64.65%) | 9 (64.29%) | 0.979 |
| Dyslipidemia, n (%) | 45 (45.45%) | 7 (50.00%) | 0.749 |
| Hemoglobin, g/dl | 13.02 (11.62–14.03) | 12.40 (10.28–13.58) | 0.312 |
| Hematocrit, % | 38.25 (34.5–42.0) | 36.11 (32.95–42.8) | 0.593 |
| WBC | 8.94 (7.11–10.49) | 9.58 (9.16–10.52) | 0.118 |
| BUN, mg/dl | 36.44 (29.8–50.77) | 48.1 (38.1–71.4) | 0.023 |
| Creatinine, mg/dl | 0.91 (0.76–1.09) | 1.08 (0.83–1.29) | 0.305 |
| eGFR, ml/min/1.73 m2 | 85.82 (62.49–104.34) | 70.54 (43.31–99.80) | 0.199 |
| Glucose, mg/dl | 118.45 (96.13–150.4) | 114.0 (95.0–121.0) | 0.448 |
| Neutrophils, × 103/μl | 6.26 (4.56–7.65) | 6.27 (5.92–8.32) | 0.308 |
| Lymphocytes, × 103/μl | 1.80 (1.43–2.19) | 1.94 (1.55–2.92) | 0.426 |
| Monocytes, × 103/μl | 0.65 (0.50–0.86) | 0.73 (0.52–0.79) | 0.849 |
| PLT, × 103/μl | 246.5 (202.25–311.5) | 254.85 (232.5–290.1) | 0.657 |
| Stage III Leriche–Fontaine, n (%) | 42 (42.42%) | 5 (35.71%) | 0.634 |
| Stage IV Leriche–Fontaine, n (%) | 57 (57.58%) | 9 (64.29%) | |
| Length of stay, days, mean ± s.d. | 6.02 ± 3.96 | 8.00 ± 4.18 | 0.064 |