FIGURE 1.
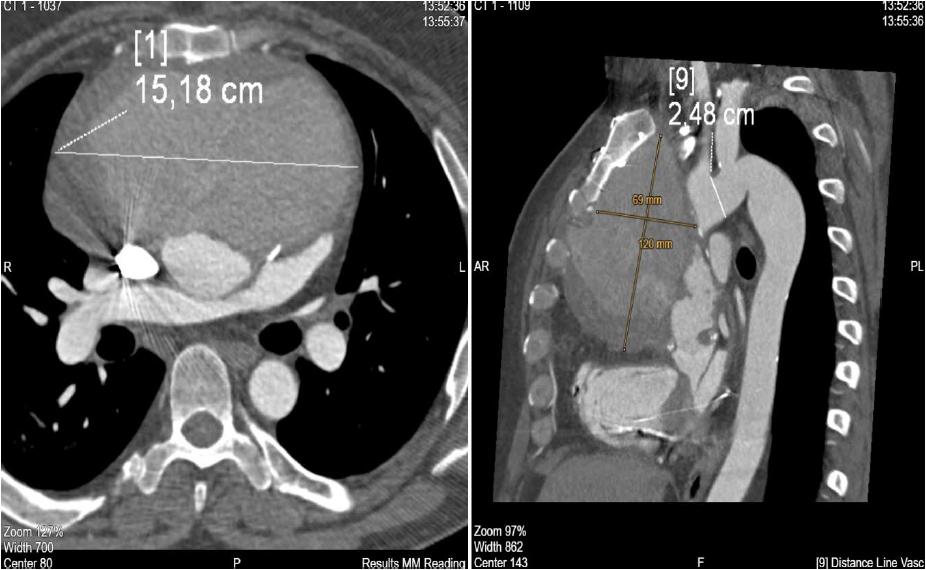
FIGURE 2.
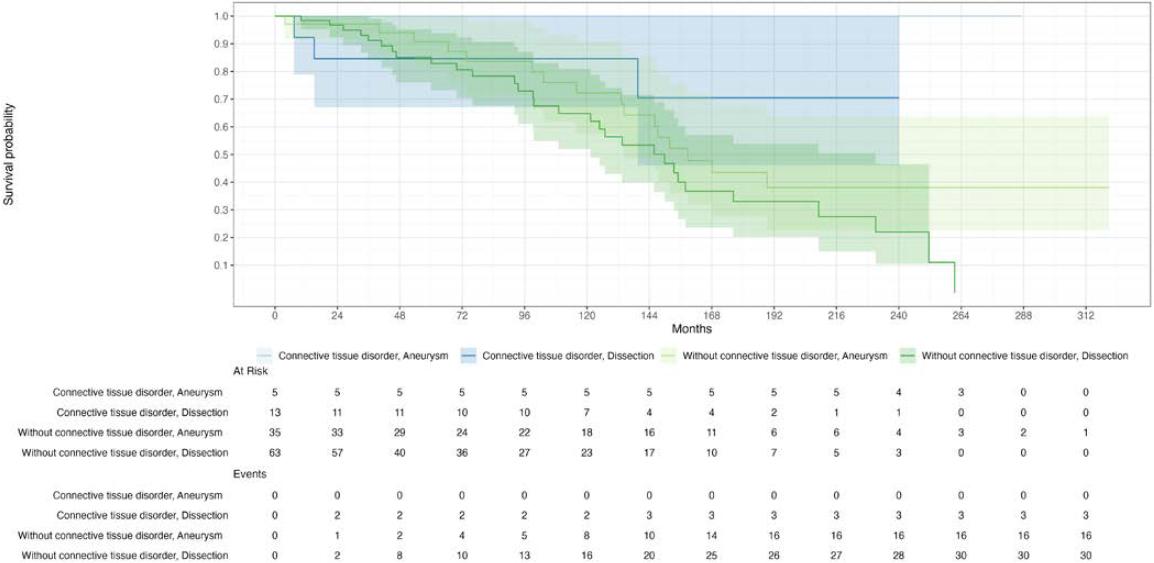
FIGURE 3.
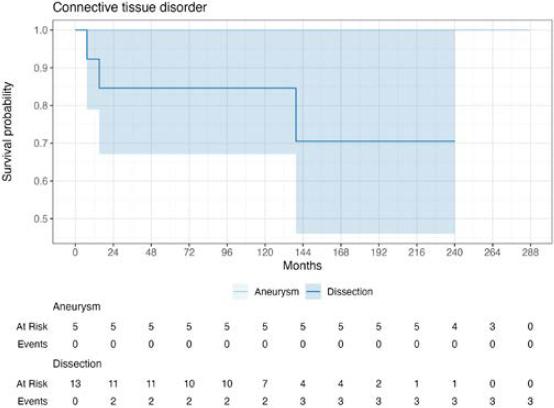
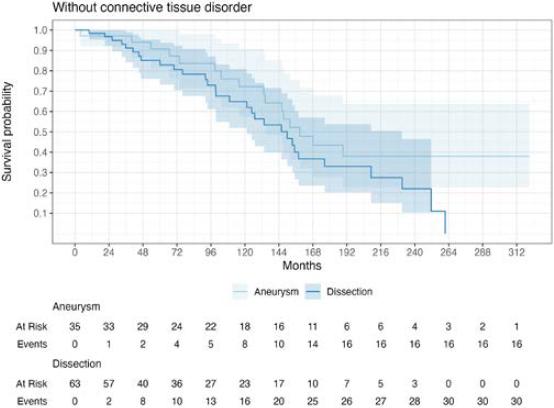
FIGURE 4.
Peri- and postprocedural characteristics of primary surgery before TAFA development
| Variable | Patients with CTD | Patients without CTD |
|---|---|---|
| Duration of cardiopulmonary bypass, min, mean ± s.d. | 174 ± 56 | 182 ± 72 |
| Cross-clamp time, min, mean ± s.d. | 112 ± 32 | 112 ± 35 |
| Duration of circulatory arrest, min, mean ± s.d. | 16 ± 27 | 20 ± 28 |
| Proximal suture with PTFE circumferential felt strip, n (%) | 2 (11%) | 36 (37%) |
| Distal suture with PTFE circumferential felt strip, n (%) | 7 (39%) | 49 (50%) |
| Use of biological glue, n (%) | 18 (100%) | 94 (96%) |
| Surgical re-exploration, n (%) | 2 (11%) | 25 (25%) |
| Wound infection, n (%) | 0 (0%) | 9 (9%) |
| Multiple surgeries until TAFA development, n (%) | 4 (22%) | 8 (8%) |
| Antiplatelet therapy after surgery, n (%) | 1 (5%) | 26 (26%) |
| Anticoagulation after surgery, n (%) | 17 (94%) | 59 (60%) |
Preoperative demographic characteristics
| Variable | Patients with CTD | Patients without CTD |
|---|---|---|
| Age at the time of surgery, mean ± s.d. (years) | 52 ± 20 | 52 ± 22 |
| Male, n (%) | 7 (39%) | 70 (71%) |
| Female, n (%) | 11 (61%) | 28 (29%) |
| Obesity (BMI > 30 kg/m2), n (%) | 2 (11%) | 25 (25%) |
| Hypertension, n (%) | 14 (78%) | 84 (86%) |
| Diabetes mellitus, n (%) | 1 (5%) | 7 (7%) |
| Atherosclerosis, n (%) | 3 (16%) | 20 (20%) |
| Stroke/neurological disorder, n (%) | 3 (16%) | 25 (25%) |
| Renal failure, n (%) | 0 (0%) | 11 (11%) |
| Atrial fibrillation, n (%) | 5 (28%) | 40 (41%) |
| Immunosuppression, n (%) | 1 (5%) | 4 (4%) |
| Aortic valve disease | ||
| Aortic regurgitation, n (%) | 17 (94%) | 72 (73%) |
| Aortic stenosis, n (%) | 0 | 8 (8%) |
| Mixed aortic valve disease, n (%) | 0 | 3 (3%) |
| No aortic valve disease, n (%) | 1 (5%) | 16 (16%) |