
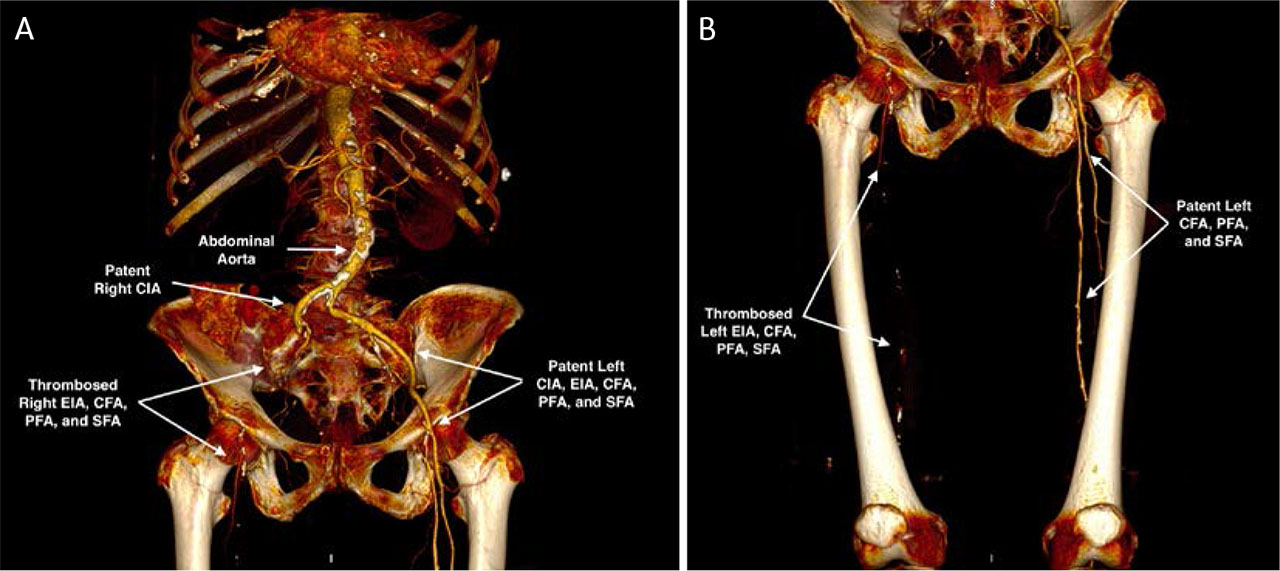
FIGURE 1.
Preoperative CTA with 3D reconstruction showing thrombosis of the right EIA, CFA, PFA, and SFA: suprainguinal (A) and infrainguinal (B) views.
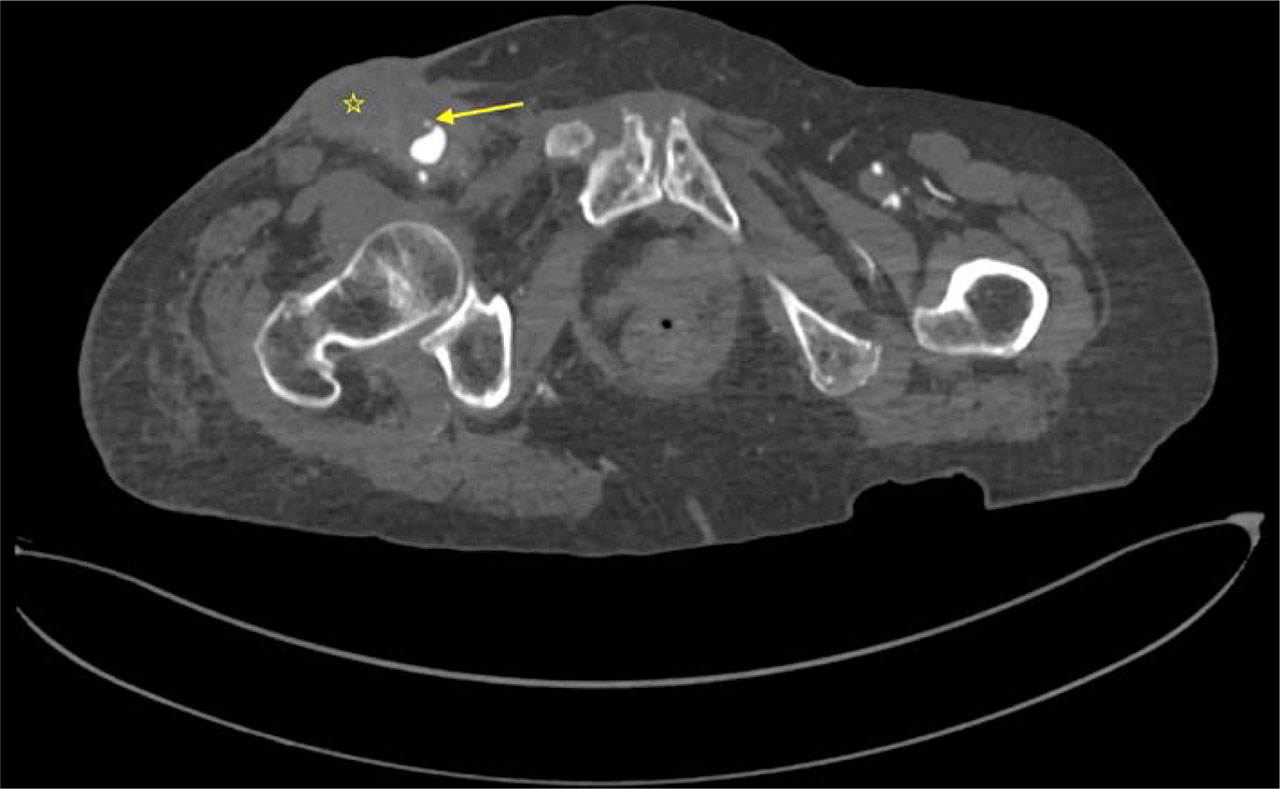
FIGURE 2.
Preoperative CTA demonstrating the pseudoaneurysm with active bleeding (yellow arrow) and the peri-pseudoaneurysmal infection area (asterisk).
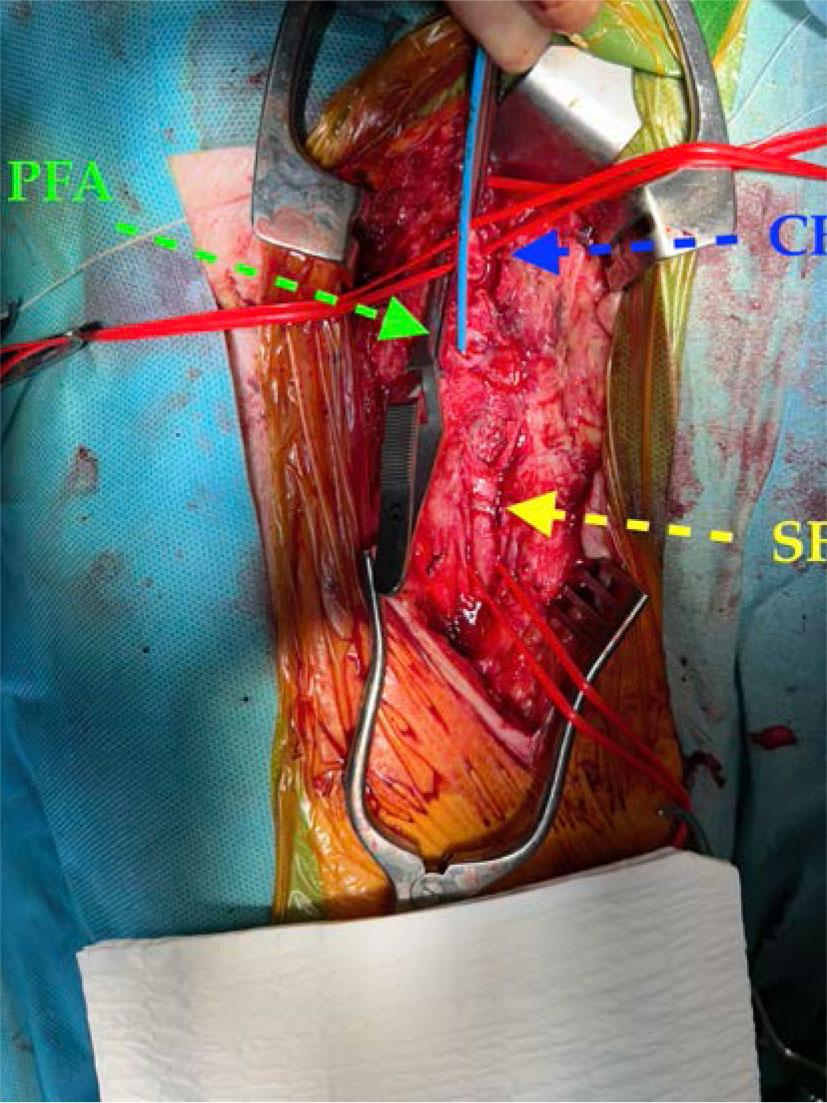
FIGURE 3.
Intraoperative view after removal of the infected patch and preparation of the three femoral arteries for reconstruction.
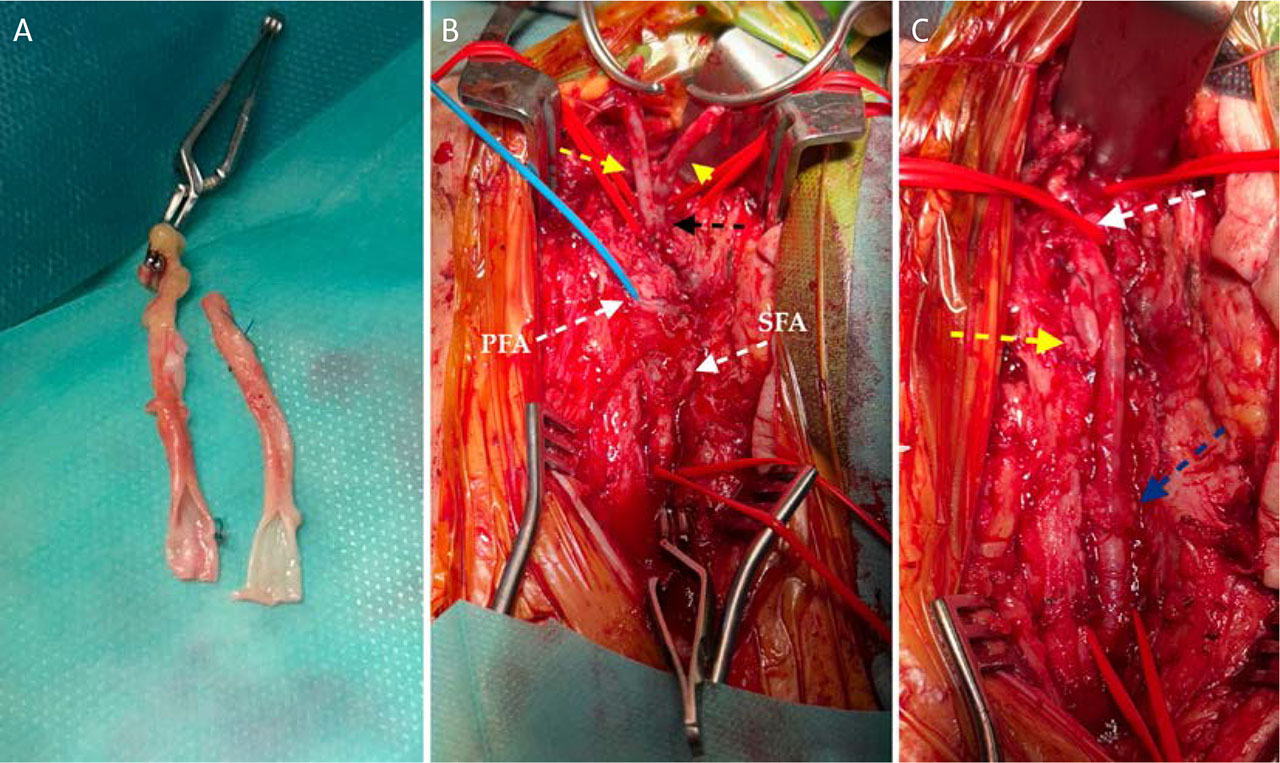
FIGURE 4.
Intraoperative stages of neo-femoral artery reconstruction: creation of a Y-shaped graft from two GSV segments (A); proximal anastomosis with the CFA (B); and final appearance of the reconstruction (C).
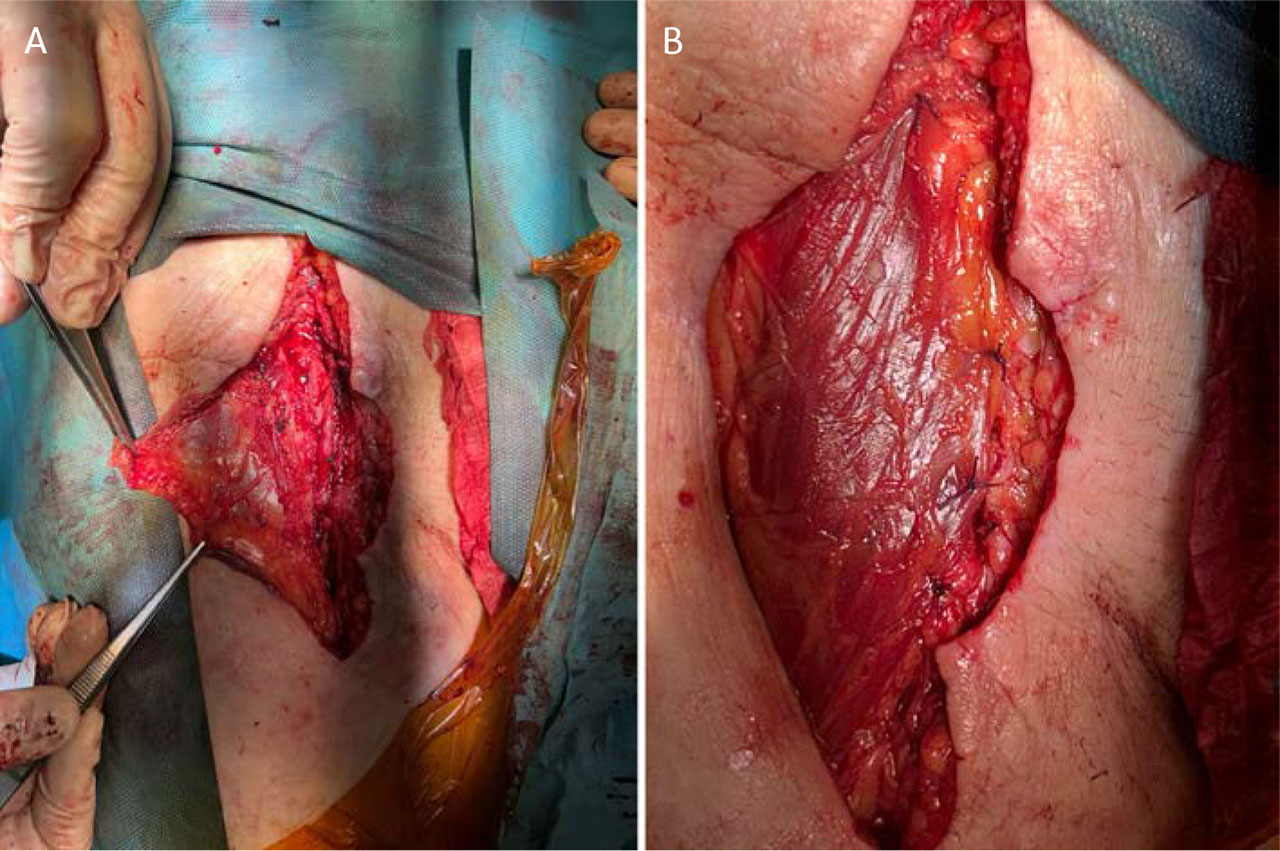
FIGURE 5.
Coverage of the neo-femoral artery using a proximal sartorius muscle flap: flap preparation (A) and final appearance after coverage (B).
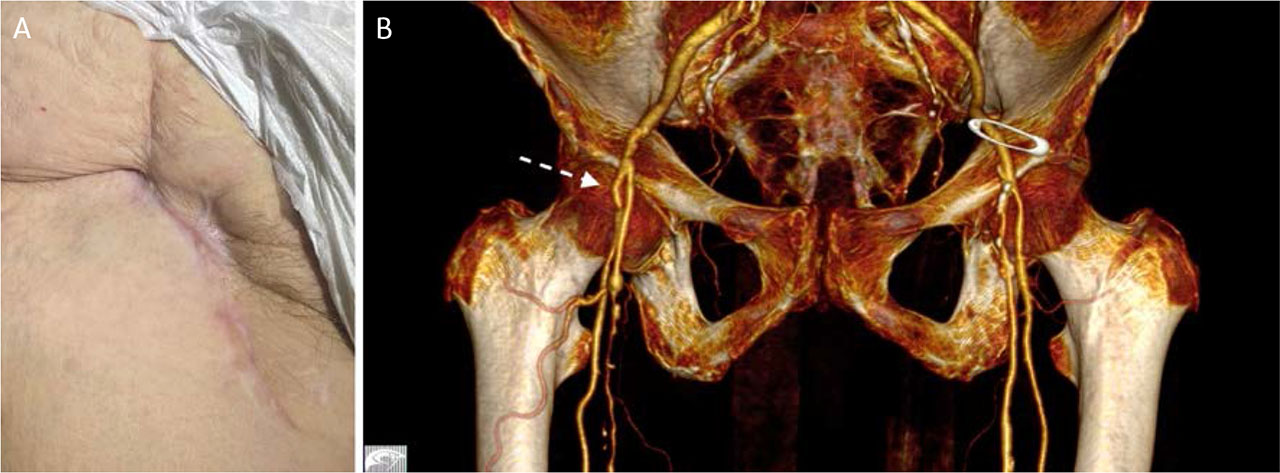
FIGURE 6.
Clinical appearance (A) and 3D CTA reconstruction (B) 1 month after surgery.