
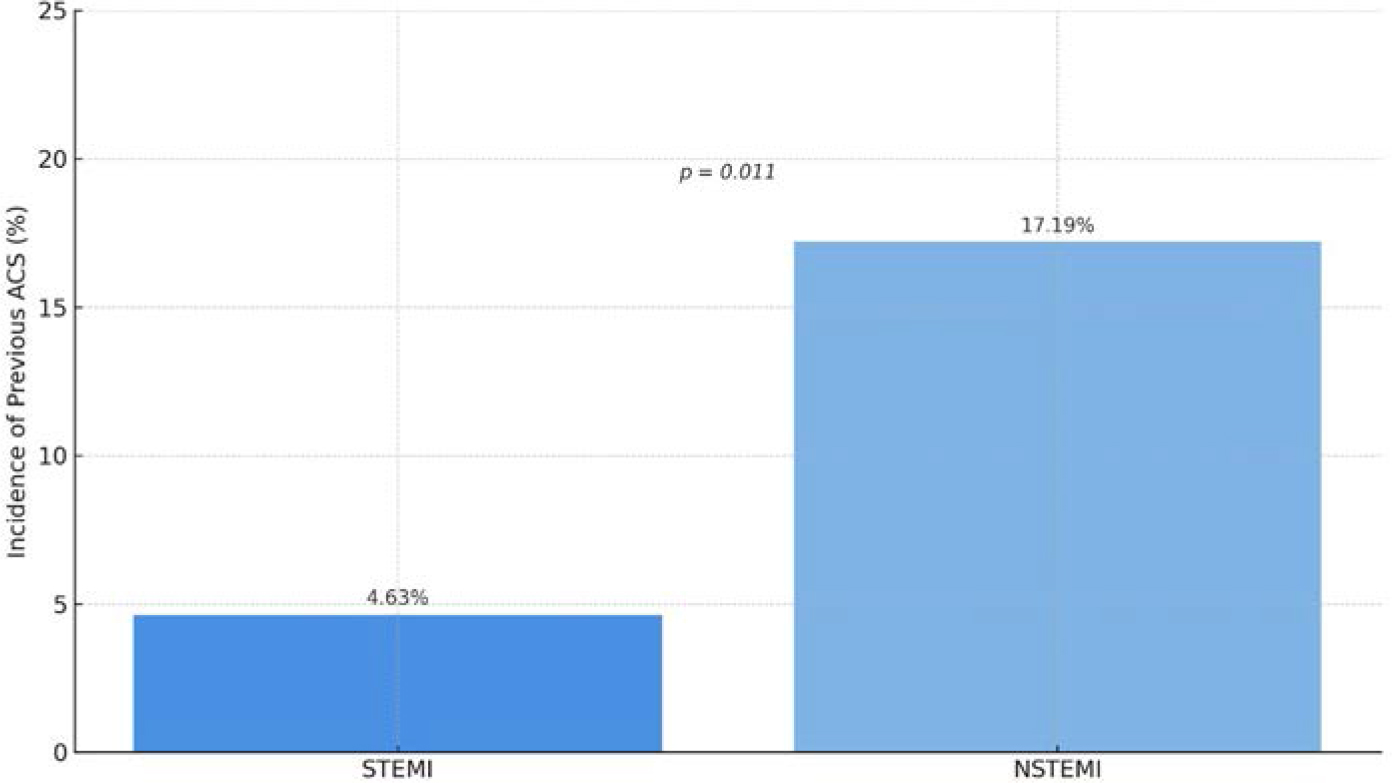
FIGURE 1.
Advanced coronary artery disease, evidenced by a history of ACS, demonstrated a statistically significant higher prevalence in the NSTEMI group.
TABLE 1.
Baseline characteristics
| Variable | STEMI (n = 108) | NSTEMI (n = 64) | p value |
|---|---|---|---|
| Mean age | 61.5 | 64.03 | 0.19 |
| Male | 80 (74%) | 48 (75%) | >0.99 |
| Previous ACS | 6 (4.63%) | 11 (17.19%) | 0.011 |
| History of atrial fibrillation | 21 (19.44%) | 6 (9.38%) | ns |
| Diabetes mellitus | 26 (24.07%) | 16 (25.00%) | ns |
| Smoker | 44 (40.74%) | 18 (28.13%) | ns |
| Hypertension | 80 (74.07%) | 56 (87.5%) | ns |
| Peak hs-cTnI (ng/ml) | 10,422 ± 15,636 | 5,720 ± 8,272 | ns |
| NTproBNP (pg/ml) | 4,049 ± 6,990 | 2,707 ± 4,380 | ns |
| LVEF (%) | 40.74% | 43.45 | 0.05 |
1 Values are expressed as absolute values and percentages, respectively. All p values refer to between-group comparisons based on Fisher’s exact test. ns, nonsignificant; hs-cTnI, high-sensitivity cardiac troponin I; LVEF, left ventricular ejection fraction; NTproBNP, N-terminal pro-B-type natriuretic peptide.
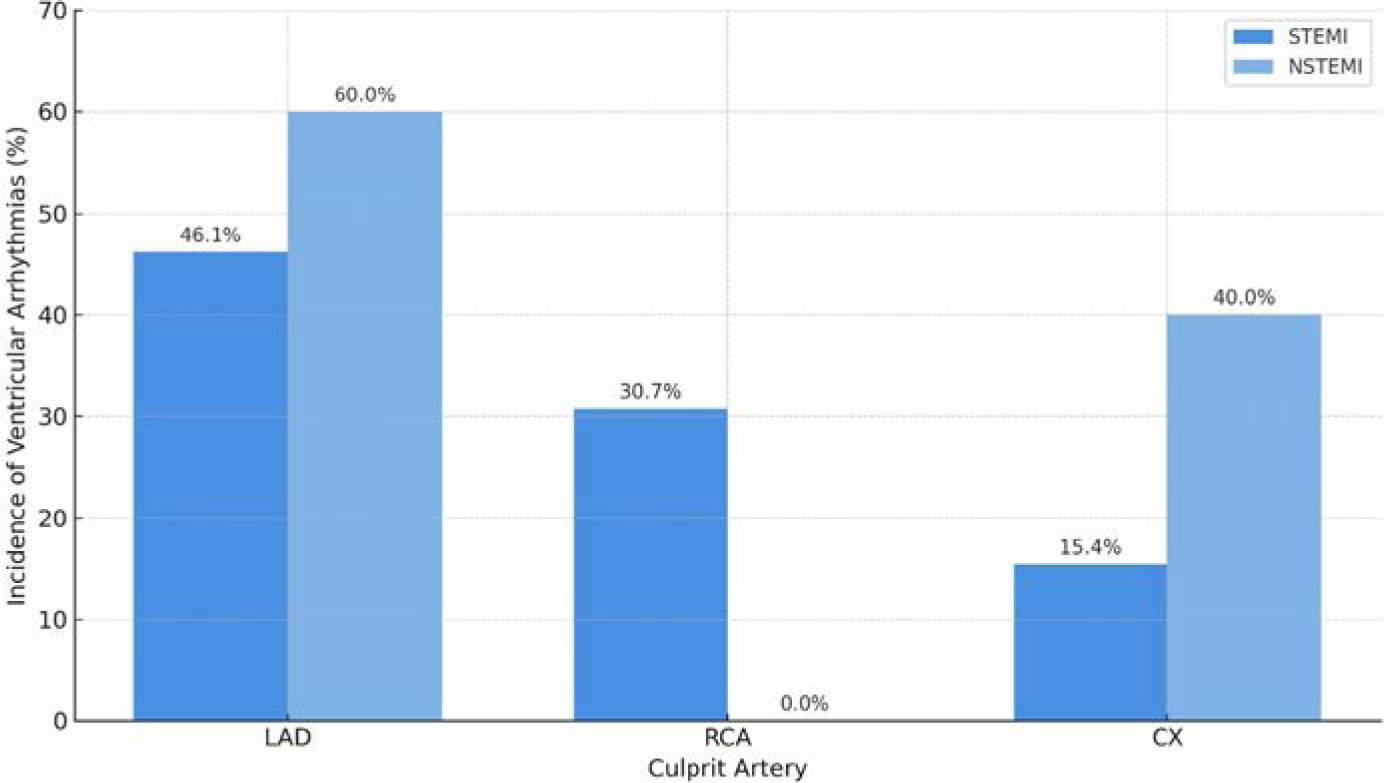
FIGURE 2.
Distribution of treated culprit lesions in patients with STEMI and NSTEMI. Left main artery involvement was significantly higher in NSTEMI patients (47.4% vs. 2.04%; p < 0.0001), whereas RCA lesions were more frequently treated in STEMI (40.81% vs. 7.4%; p < 0.0001). No statistically significant differences were observed for LAD or CX involvement.
TABLE 2.
The incidence of hemodynamic instability and ventricular arrhythmias, the frequency of PTCA, the distribution of culprit lesions across major coronary arteries with PTCA, and a subanalysis for culprit treated lesions and hemodynamic instability/ventricular arrythmias
| Variable | STEMI (n = 108) | NSTEMI (n = 64) | p value |
|---|---|---|---|
| Treated culprit lesions | |||
| PTCA | 98 | 54 | |
| Left Main | 2 (2.04%) | 4 (47.4%) | <0.0001 |
| LAD | 57 (58.16%) | 29 (53.7%) | ns |
| RCA | 40 (40.81%) | 4 (7.4%) | <0.0001 |
| CX | 14 (14.28%) | 9 (16.66%) | ns |
| Hemodynamic instability | 20 (0.18%) | 7 (10.93%) | 0.005 |
| Ventricular arrhythmias | 13 (12.03%) | 5 (7.81%) | ns |
| Hemodynamic instability | 4,049 ± 6,990 | 2,707 ± 4,380 | ns |
| PTCA - LM | 1 (5%) | 0 | – |
| PTCA - LAD | 8 (40%) | 4 (57.14%) | ns |
| PTCA - RCA | 8 (40%) | 2 (28.15%) | ns |
| PTCA – CX | 3 (15%) | 2 (18.15%) | ns |
| Ventricular arrhythmias | |||
| PTCA – LAD | 6 (46.15%) | 3 (60%) | ns |
| PTCA - RCA | 4 (30.7%) | 0 | – |
| PTCA – CX | 2 (15.38%) | 2 (40%) | 0.0001 |
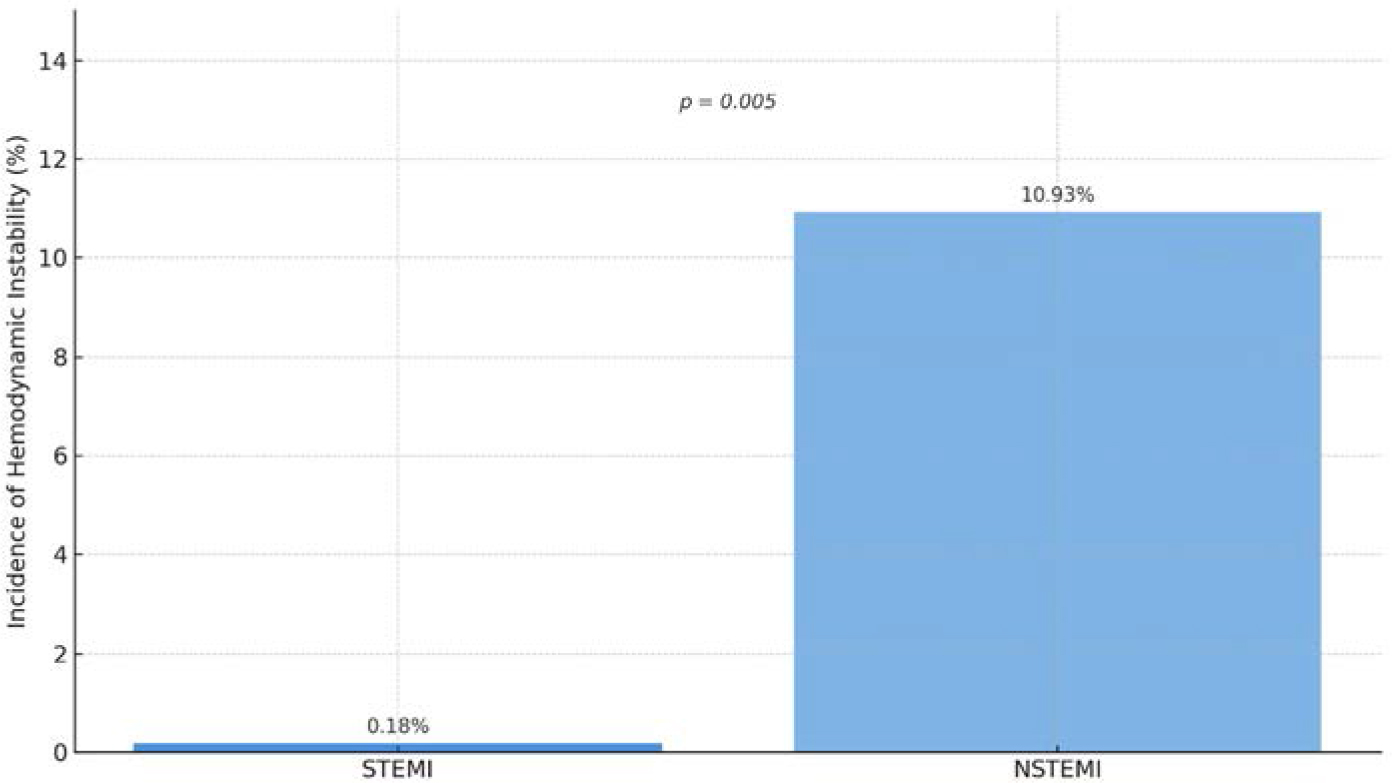
FIGURE 3.
Distribution of hemodynamic instability in patients with STEMI compared to those with NSTEMI. The chart illustrates a significantly higher occurrence of hemodynamic instability in patients with NSTEMI (10.93%) compared to those with STEMI (0.18%), with statistical significance noted (p = 0.005).
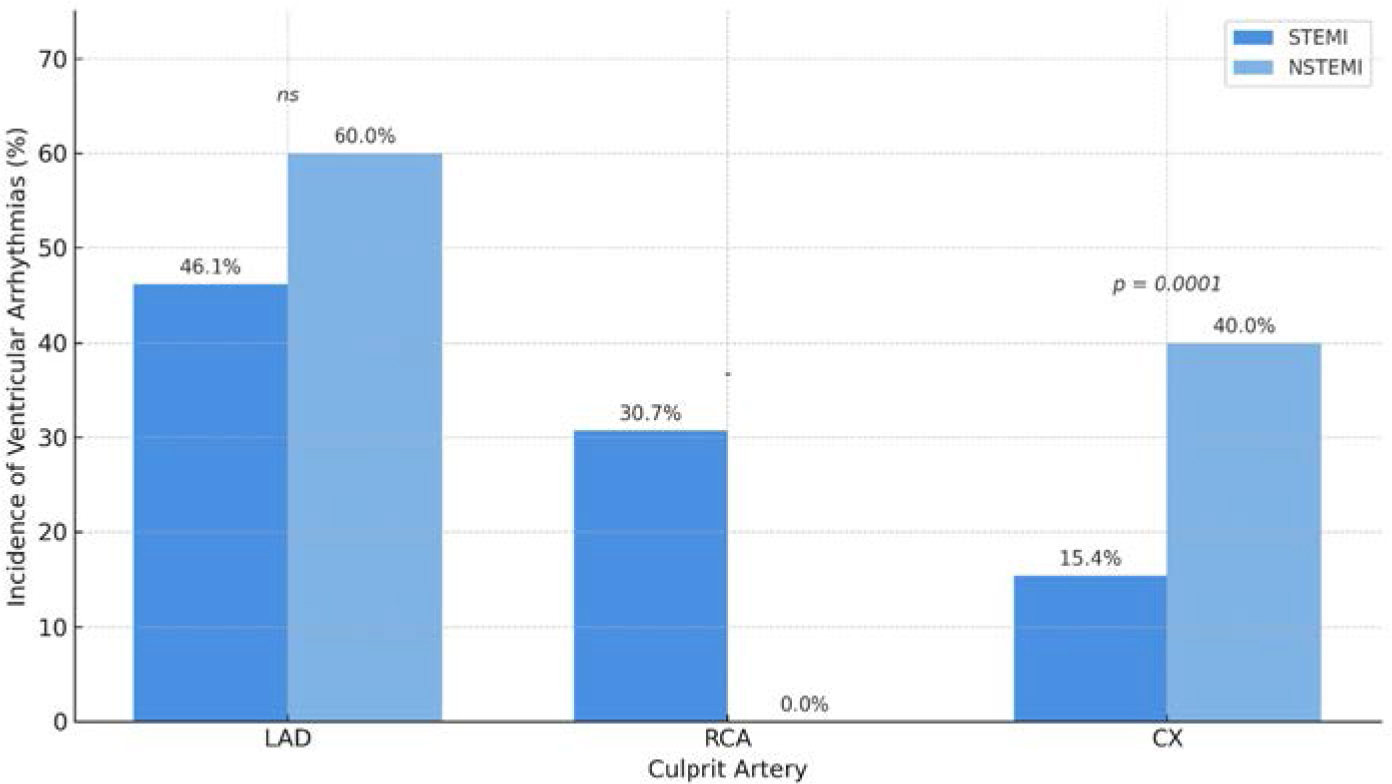
FIGURE 4.
Comparison of ventricular arrhythmias between the two groups. The analysis showed no statistically significant difference in the incidence of hemodynamic instability between patients with NSTEMI and STEMI.