
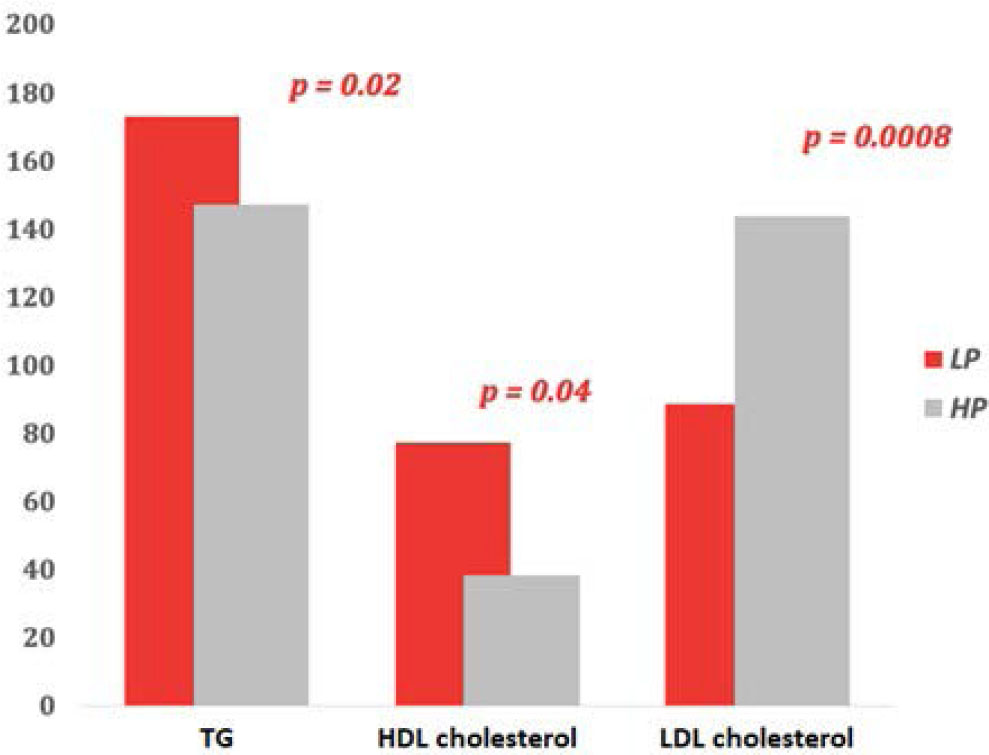
FIGURE 1.
Lipid profile in patients with low vs. high PN levels
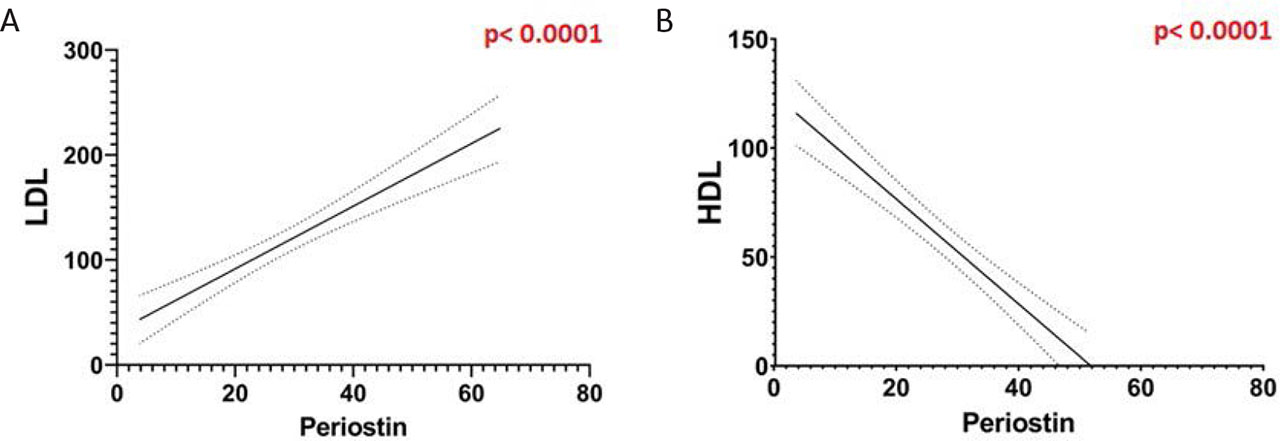
FIGURE 2.
Linear regression analysis of the association between PN and LDL cholesterol (A) and HDL cholesterol (B)
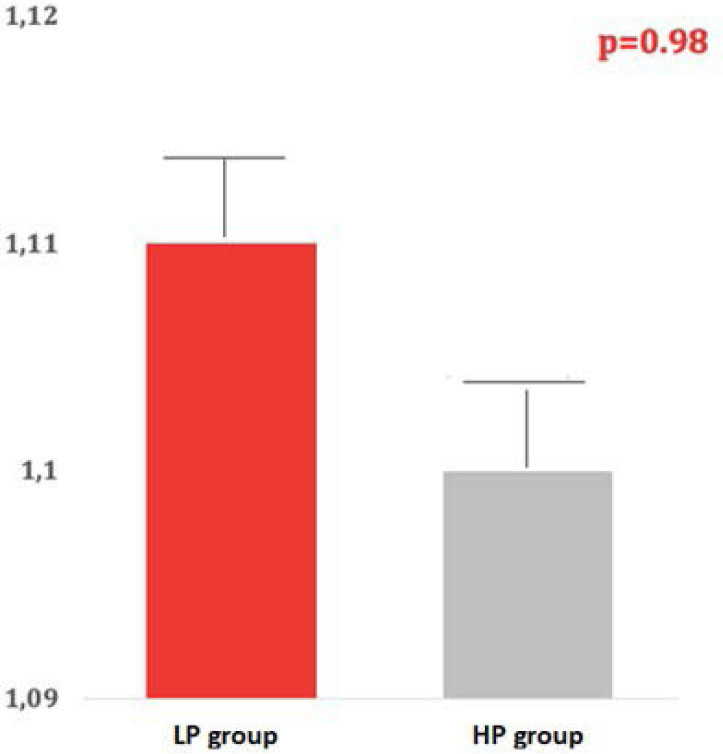
FIGURE 3.
Serum apolipoprotein B levels in patients with low vs. high PN
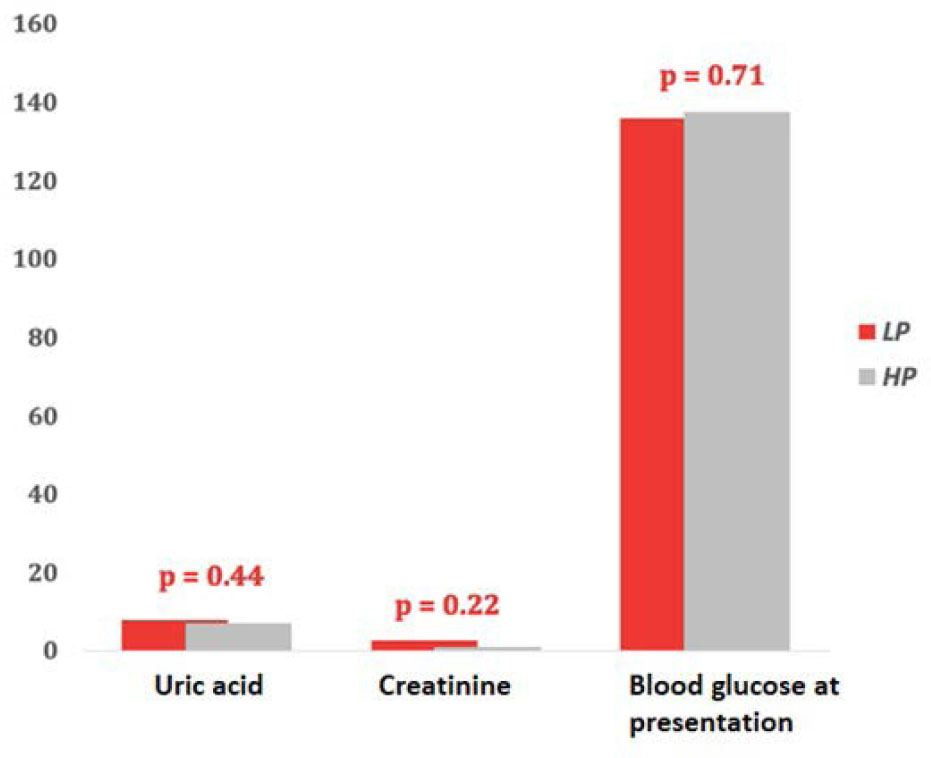
FIGURE 4.
Comparison of serum uric acid, creatinine, and blood glucose levels at presentation in patients with low versus high PN