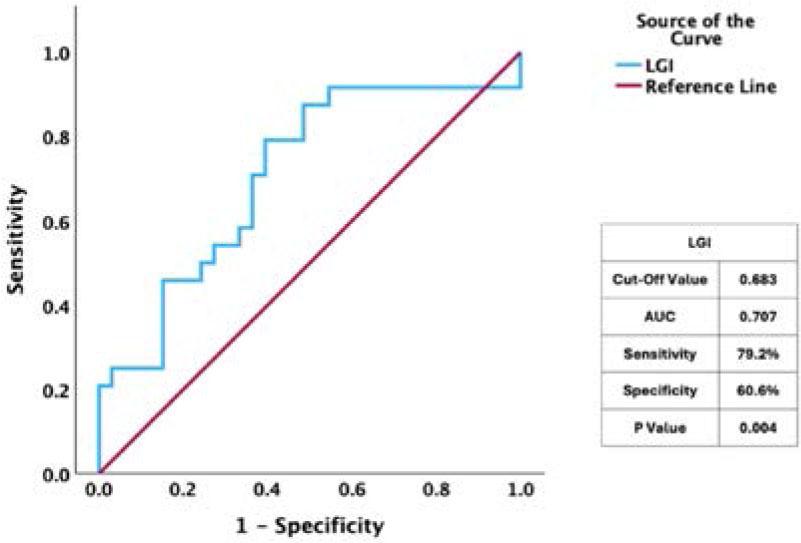
FIGURE 1.
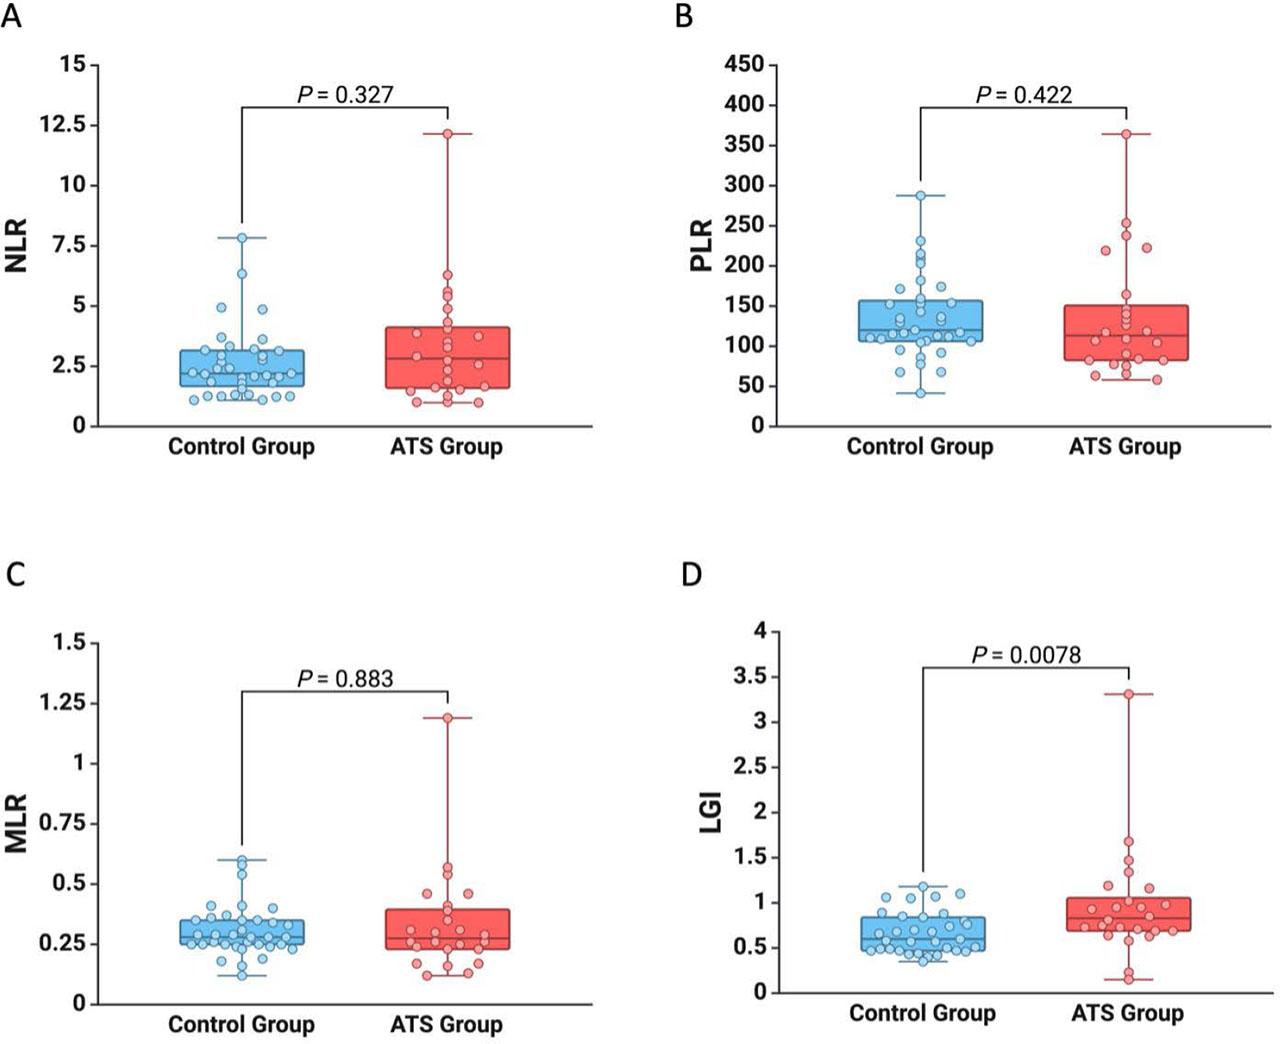
FIGURE 2.
Clinical stage of PAD among patients with systemic atherosclerosis
| Leriche Fontaine classification, n (%) | Systemic atherosclerosis group (n = 25) |
|---|---|
| Stage IIA | 6 (24%) |
| Stage IIB | 5 (20%) |
| Stage III | 3 (12%) |
| Stage IV | 5 (20%) |
| Carotid stenosis | 6 (24%) |
Predictive factors of systemic atherosclerosis in the study population
| Variables | Systemic atherosclerosis | ||
|---|---|---|---|
| OR | 95% CI | p value | |
| Male | 0.76 | 0.26–2.16 | 0.601 |
| Age | 2.07* | 1.12–3.83 | 0.021 |
| Hypertension | 2.00 | 0.53–7.51 | 0.304 |
| Chronic renal disease | 1.48 | 0.09–24.84 | 0.786 |
| Obesity | 0.97 | 0.15–6.29 | 0.975 |
| Active smoking | 4.39 | 1.01–19.19 | 0.049 |
| Platelets | 2.18* | 1.15–4.13 | 0.017 |
| WBCs | 2.06* | 1.12–3.79 | 0.020 |
| Neutrophils | 2.75* | 1.37–5.49 | 0.004 |
| Lymphocytes | 2.47* | 1.14–5.34 | 0.021 |
| Monocytes | 2.03* | 1.10–3.72 | 0.021 |
| LGI | 2.90* | 1.15–7.29 | 0.024 |
Demographic data, comorbidities, risk factors, and laboratory data of the study population
| Variable | All patients (n = 59) | Without atherosclerosis (n = 34) | With atherosclerosis (n = 25) | p value |
|---|---|---|---|---|
| Age, mean ± s.d. | 37.19 ± 5.49 | 35.68 ± 6.04 | 39.24 ± 3.88 | 0.007 |
| Male, n (%) | 32 (54.24%) | 17 (50%) | 15 (60%) | 0.446 |
| Comorbidities and risk factors, n (%) | ||||
| Hypertension | 11 (18.64%) | 4 (11.76%) | 7 (28%) | 0.114 |
| Ischemic heart disease | 3 (5.08%) | 0 (0%) | 3 (12%) | 0.038 |
| Atrial fibrillation | 1 (1.69%) | 0 (0%) | 1 (4%) | 0.240 |
| Cerebrovascular events | 5 (8.47%) | 0 (0%) | 5 (20%) | 0.006 |
| Obesity | 5 (8.47%) | 3 (8.82%) | 2 (8%) | 0.911 |
| Active smoking | 27 (45.76%) | 7 (20.59%) | 20 (80%) | <0.001 |
| Dyslipidemia | 10 (16.95%) | 3 (8.82%) | 7 (28%) | 0.052 |
| Chronic renal disease | 2 (3.39%) | 0 (0%) | 2 (8%) | 0.093 |
| Diabetes mellitus | 2 (3.39%) | 1 (2.94%) | 1 (4%) | 0.824 |
| Laboratory data, mean ± s.d. | ||||
| Red blood cells, × 106/μl | 4.64 ± 0.49 | 4.72 ± 0.52 | 4.54 ± 0.45 | 0.190 |
| Hemoglobin, g/dl | 13.88 ± 1.67 | 14.00 ± 1.87 | 13.71 ± 1.38 | 0.416 |
| Hematocrit, % | 41.17 ± 4.43 | 41.63 ± 4.98 | 40.55 ± 3.56 | 0.244 |
| Platelets, × 103/μl | 260.65 ± 74.82 | 239.24 ± 52.44 | 289.78 ± 90.62 | 0.038 |
| WBCs, × 103/μl | 8.09 ± 2.82 | 7.31 ± 2.14 | 9.15 ± 3.30 | 0.003 |
| Neutrophils, × 103/μl | 5.50 ± 2.50 | 4.61 ± 1.89 | 6.7 ± 2.75 | 0.002 |
| Lymphocytes, × 103/μl | 2.15 ± 0.79 | 1.91 ± 0.53 | 2.46 ± 0.97 | 0.01 |
| Monocytes, × 103/μl | 0.63 ± 0.22 | 0.57 ± 0.18 | 0.70 ± 0.25 | 0.024 |
| Eosinophils, × 103/μl | 0.19 ± 0.23 | 0.16 ± 0.12 | 0.22 ± 0.32 | 0.429 |
| Basophiles, × 103/μl | 0.04 ± 0.02 | 0.05 ± 0.03 | 0.04 ± 0.02 | 0.889 |
| Na, mmol/l | 140.3 ± 2.34 | 140.61 ± 2.2 | 139.9 ± 2.5 | 0.211 |
| K, mmol/l | 4.39 ± 0.43 | 4.34 ± 0.28 | 4.45 ± 0.55 | 0.568 |
| Glucose, mg/dl | 98.5 ± 36.61 | 92.86 ± 14.54 | 105.72 ± 52.52 | 0.355 |
| BUN, mg/dl | 31.44 ± 22.21 | 28.78 ± 6.92 | 34.73 ± 32.41 | 0.347 |
| Creatinine, mg/dl | 0.99 ± 1.5 | 0.82 ± 0.13 | 1.21 ± 2.27 | 0.231 |
| GFR, ml/min | 106.85 ± 23.05 | 104.49 ± 15.99 | 109.87 ± 29.88 | 0.228 |
| Quick time, s | 12.41 ± 1.3 | 12.27 ± 1.48 | 12.59 ± 1.03 | 0.118 |
| Prothrombin activity, % | 98.5 ± 19.53 | 100.11 ± 17.56 | 96.4 ± 22.07 | 0.298 |
| INR | 1.03 ± 0.11 | 1.02 ± 0.1 | 1.03 ± 0.12 | 0.530 |
| GOT, U/l | 27.02 ± 15.04 | 27.38 ± 13.92 | 26.66 ± 16.32 | 0.682 |
| GPT, U/l | 32.77 ± 27.98 | 33.66 ± 30.09 | 31.67 ± 25.8 | 0.977 |