
TABLE 1.
Baseline characteristics of the study population
| Variables | Study population (n = 46) |
|---|---|
| Male sex | 31 (67.39%) |
| Female sex | 15 (32.61%) |
| Age (years) | 66.07 ± 8 |
| BMI (kg/m2) | 28.36 (25.15–31.32) |
| Hypertension | 44 (95.65%) |
| Hypertension stage II | 27 (58.7%) |
| Ischemic heart disease | 36 (78.26%) |
| Advanced coronary artery disease | 12 (26.09%) |
| Atrial fibrillation 3 (6.52%) | |
| Diabetes mellitus | 15 (32.61%) |
| Treatment with oral antidiabetics | 9 (19.57%) |
| Treatment with insulin | 6 (13.04%) |
| Peripheral arterial disease | 12 (26.09%) |
| Chronic kidney disease | 8 (17.39%) |
| Stroke history | 30 (65.22%) |
| Dyslipidemia | 43 (93.48%) |
| Smoking | 18 (39.13%) |
| Mean carotid artery stenosis (%) | 83.47 ± 6.57 |
TABLE 2.
Preoperative medication
| Medication | Study population (n = 46) |
|---|---|
| Anticoagulant | 11 (23.91%) |
| NOAC | 8 (17.39%) |
| VKA | 3 (6.52%) |
| Antiplatelet | 42 (91.3%) |
| Aspirin | 36 (78.26%) |
| P2Y12 inhibitor | 26 (56.52%) |
| Hypolipemic | 43 (93.48%) |
| Statin | 43 (93.48%) |
| Statin + ezetimibe | 11 (23.91%) |
TABLE 3.
Laboratory parameters
| Laboratory parameter | Value |
|---|---|
| Neutrophils (× 103/µl) | 5.35 ± 1.48 |
| Lymphocytes (× 103/µl) | 1.96 (1.61–2.74) |
| Neutrophil-to-lymphocyte ratio | 2.43 (1.76–3.16) |
| Monocytes (× 103/µl) | 0.66 ± 0.2 |
| Lymphocyte-to-monocyte ratio | 3.33 (2.7–4.12) |
| hs-CRP (mg/l) | 1 (0.55–5.57) |
| MCP-1 (pg/ml) | 196.51 (156.52–245.6) |
| MMP-9 (ng/ml) | 71.03 (43.43–104.39) |
| ox-LDL (ng/ml) | 52.16 (34.79–67.73) |
TABLE 4.
Associated comorbidities and preoperative medication in patients with and without postoperative complications
| Variables | Patients without complications (n = 36) | Patients with complications (n = 10) | p value |
|---|---|---|---|
| Male sex | 23 (63.89%) | 8 (80%) | 0.48 |
| Age (years) | 65.61 ± 8.5 | 67.7 ± 5.95 | 0.47 |
| BMI (kg/m2) | 28.05 (24.29–30.59) | 29.51 ± 3.64 | 0.35 |
| Hypertension | 35 (97.22%) | 9 (90%) | 0.38 |
| Hypertension stage | 2 (2–2) | 2 (2–3) | 0.52 |
| Ischemic heart disease | 28 (77.78%) | 8 (80%) | 0.99 |
| Advanced coronary artery disease | 9 (25%) | 3 (30%) | 0.70 |
| Diabetes mellitus | 13 (36.11%) | 2 (20%) | 0.45 |
| Treatment with oral antidiabetics | 8 (22.22%) | 1 (10%) | 0.66 |
| Treatment with insulin | 5 (13.89%) | 1 (10%) | 0.99 |
| Peripheral artery disease | 10 (27.78%) | 2 (20%) | 0.70 |
| Chronic kidney disease | 7 (19.44%) | 1 (10%) | 0.66 |
| Stroke history | 25 (69.44%) | 5 (50%) | 0.28 |
| Dyslipidemia | 34 (94.44%) | 9 (90%) | 0.52 |
| Smoking | 17 (47.22%) | 1 (10%) | 0.06 |
| Carotid artery degree stenosis | 84.53 ± 6.47 | 79.5 ± 5.5 | 0.02 |
| Preoperative anticoagulant | 10 (27.78%) | 1 (10%) | 0.41 |
| NOAC | 8 (22.22%) | 0 (0%) | 0.15 |
| VKA | 2 (5.56%) | 1 (10%) | 0.52 |
| Preoperative antiplatelet | 33 (91.67%) | 9 (90%) | 0.99 |
| Aspirin | 27 (75%) | 9 (90%) | 0.41 |
| P2Y12 inhibitor | 22 (61.11%) | 4 (40%) | 0.29 |
| Preoperative hypolipemic | 34 (94.44%) | 9 (90%) | 0.61 |
| Statin | 34 (94.44%) | 9 (90%) | 0.61 |
| Statin + ezetimibe | 8 (22.22%) | 3 (30%) | 0.66 |
TABLE 5.
Laboratory parameters and serum biomarkers in patients with and without postoperative complications
| Laboratory parameters | Patients without complications (n = 36) | Patients with complications (n = 10) | p value |
|---|---|---|---|
| Neutrophils (× 103/µl) | 5.47 ± 1.56 | 4.91 ± 1.14 | 0.30 |
| Lymphocytes (× 103/µl) | 2.07 (1.65–3) | 1.86 ± 0.42 | 0.12 |
| Neutrophil-to-lymphocyte ratio | 2.34 (1.73–3.14) | 2.73 ± 0.75 | 0.39 |
| Monocytes (× 103/µl) | 0.67 ± 0.21 | 0.62 ± 0.16 | 0.47 |
| Lymphocyte-to-monocyte ratio | 3.47 (2.69–4.14) | 3.42 ± 0.97 | 0.57 |
| hs-CRP (mg/l) | 0.98 (0.54–4.94) | 2.04 (0.6–18.73) | 0.29 |
| MCP-1 (pg/ml) | 206.87 (157.96–250.72) | 181.94 (160.27–202.13) | 0.46 |
| MMP-9 (ng/ml) | 67.17 ± 34.28 | 191.92 ± 182.72 | 0.03 |
| ox-LDL (ng/ml) | 51.81 (35.01–70.83) | 50.99 ± 14.32 | 0.96 |
TABLE 6.
Final stepwise multivariable linear and binary logistic regression models for the prediction of complications after CEA
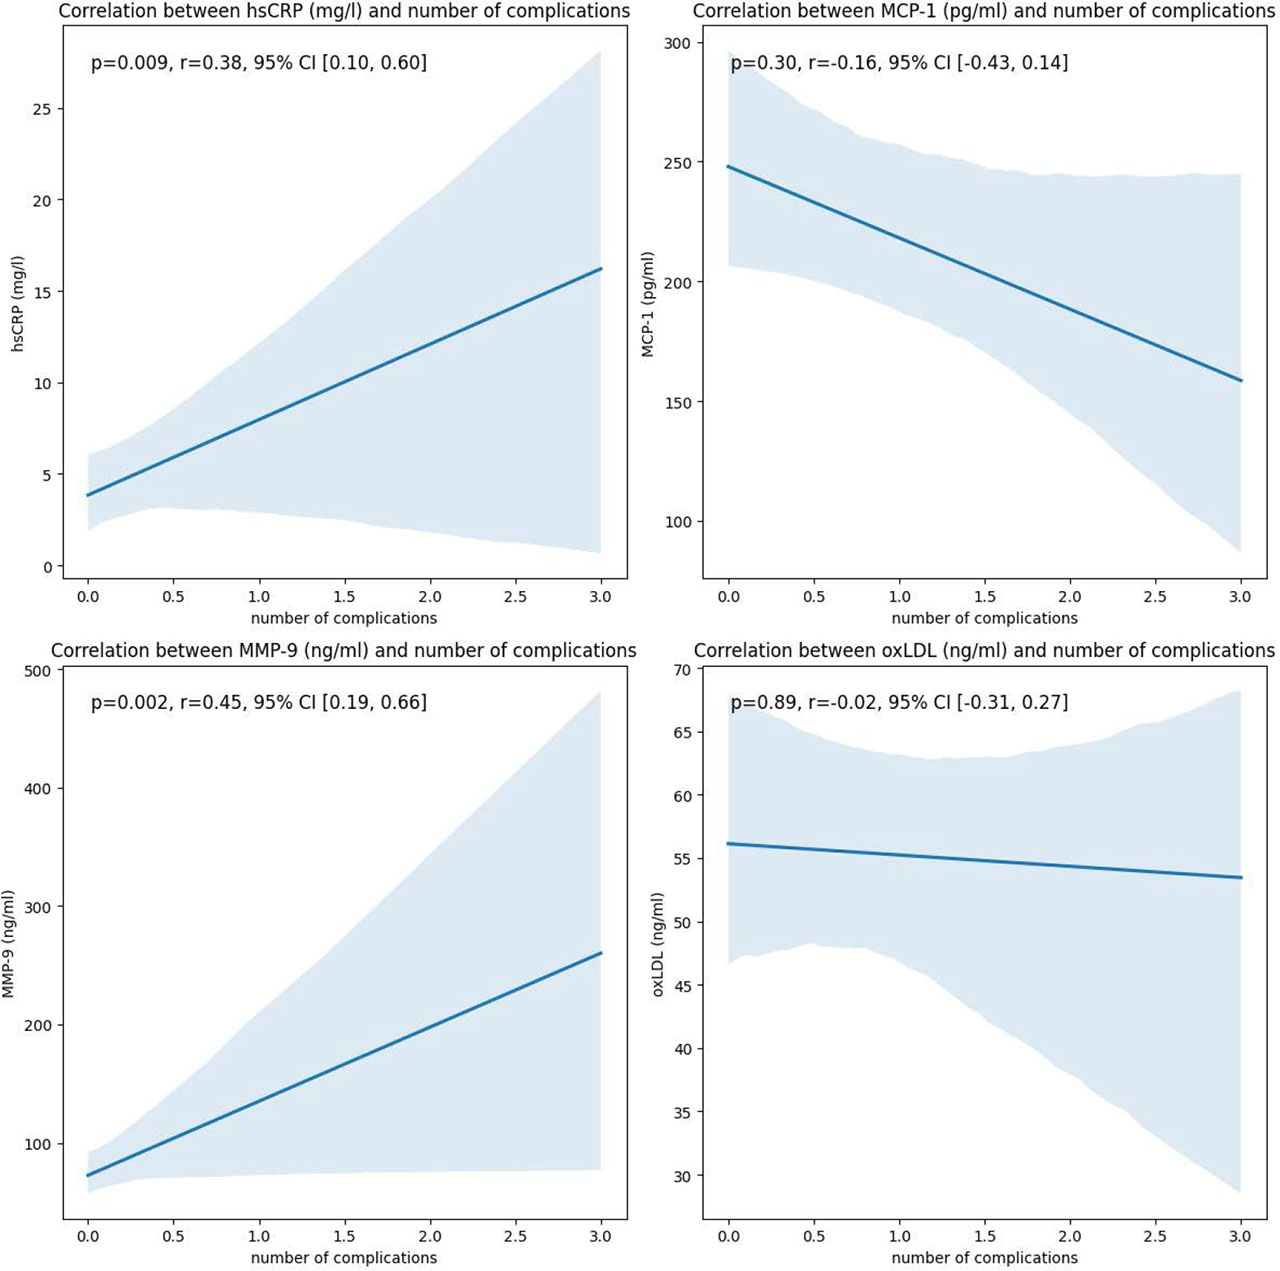
FIGURE 1.
Linear correlation between serum parameters and the number of complications. The p value was obtained by using Spearman's test.