
TABLE 1.
Pro-atherogenic and prothrombotic mechanisms of Lp(a)4
| Study population (n = 92) | Group 1 – LP (n = 46) | Group 2 – HP (n = 46) | p value | |
|---|---|---|---|---|
| Baseline characteristics of the study groups | ||||
| Age, years (mean ± s.d.) | 61.34 ± 10.72 | 61.38 ± 10.29 | 61.30 ± 11.27 | 0.92 |
| Male sex, n (%) | 67 (72.82%) | 37 (40.22 %) | 30 (32.61 %) | 0.04 |
| Weight (kg, mean ± s.d.) | 83.00 ± 20.99 | 83.84 ± 19.22 | 82.21 ± 22.77 | 0.71 |
| Height (m, mean ± s.d.) | 1.70 ± 0,07 | 1.71 ± 0.08 | 1.69 ± 0.07 | 0.38 |
| BMI (kg/m2, mean ± s.d.) | 28.02 ± 6.92 | 28.35 ± 4.81 | 28.47 ± 7.18 | 0.75 |
| ACS type | ||||
| STEMI, n (%) | 63 (68.47%) | 27 (29.35 %) | 36 (39.13 %) | 0.04 |
| NSTEMI, n (%) | 29 (31.52 %) | 19 (20.65 %) | 10 (10.87 %) | |
| Cardiovascular risk factors/comorbidities | ||||
| Obesity, n (%) | 23 (25.00%) | 11 (12.22 %) | 12 (12.22 %) | >0.99 |
| Recurrent ACS, n (%) | 9 (18.75%) | 4 (4.44 %) | 5 (5.56 %) | >0.99 |
| Heart failure, n (%) | 27 (29.34 %) | 7 (7.87%) | 20 (22.47 %) | 0.002 |
| Dyslipidemia, n (%) | 54 (58.69 %) | 30 (33.33 %) | 24 (26.67 %) | 0.13 |
| Smoker status, n (%) | 41 (50.00 %) | 21 (22.83 %) | 20 (21.72 %) | >0.99 |
| Chronic renal disease, n (%) | 7 (7.60 %) | 3 (3.26 %) | 4 (4.35 %) | >0.99 |
| Diabetes mellitus, n (%) | 19 (20.65 %) | 8 (8.70 %) | 11 (11.96 %) | 0.60 |
| Hypertension, n (%) | 69 (75.00%) | 35 (77.78 %) | 34 (72.34 %) | 0.63 |
| Atrial fibrillation, n (%) | 27 (29.34%) | 7 (7.78%) | 20 (22.22%) | 0.005 |
| Culprit lesion | ||||
| Left anterior descending artery, n (%) | 68 (73.91 %) | 33 (36.67 %) | 35 (38.89 %) | >0.99 |
| Circumflex artery, n (%) | 50 (54.34 %) | 27 (30.00 %) | 23 (25.56 %) | 0.29 |
| Right coronary artery, n (%) | 53 (57.60 %) | 27 (30.00 %) | 26 (28.89 %) | 0.67 |
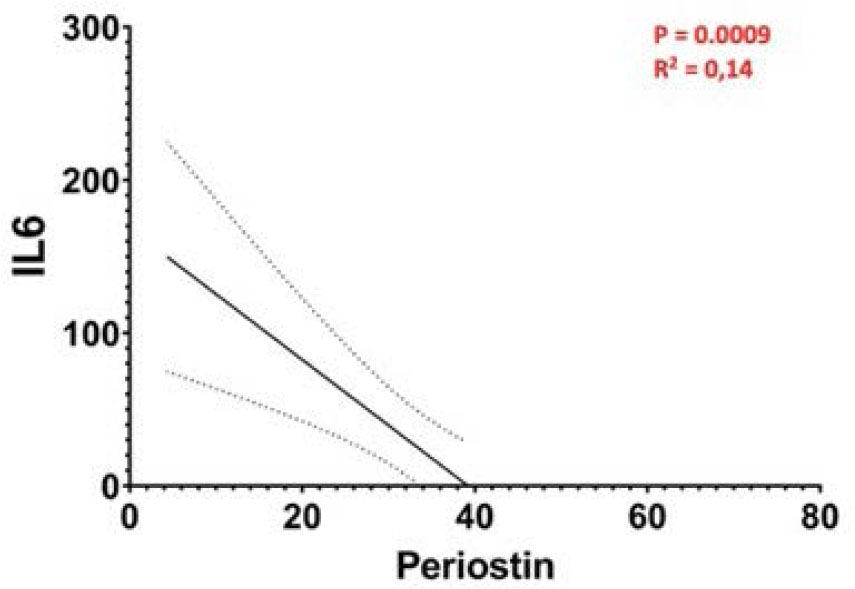
FIGURE 1.
Correlation between Pn and IL-6 serum levels
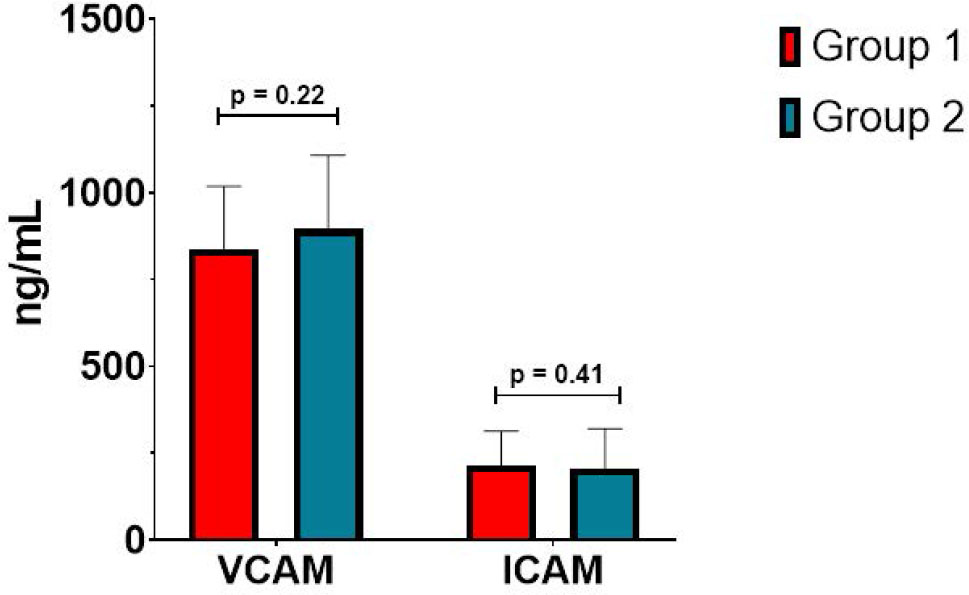
FIGURE 2.
Correlation between Pn and adhesion molecule serum levels
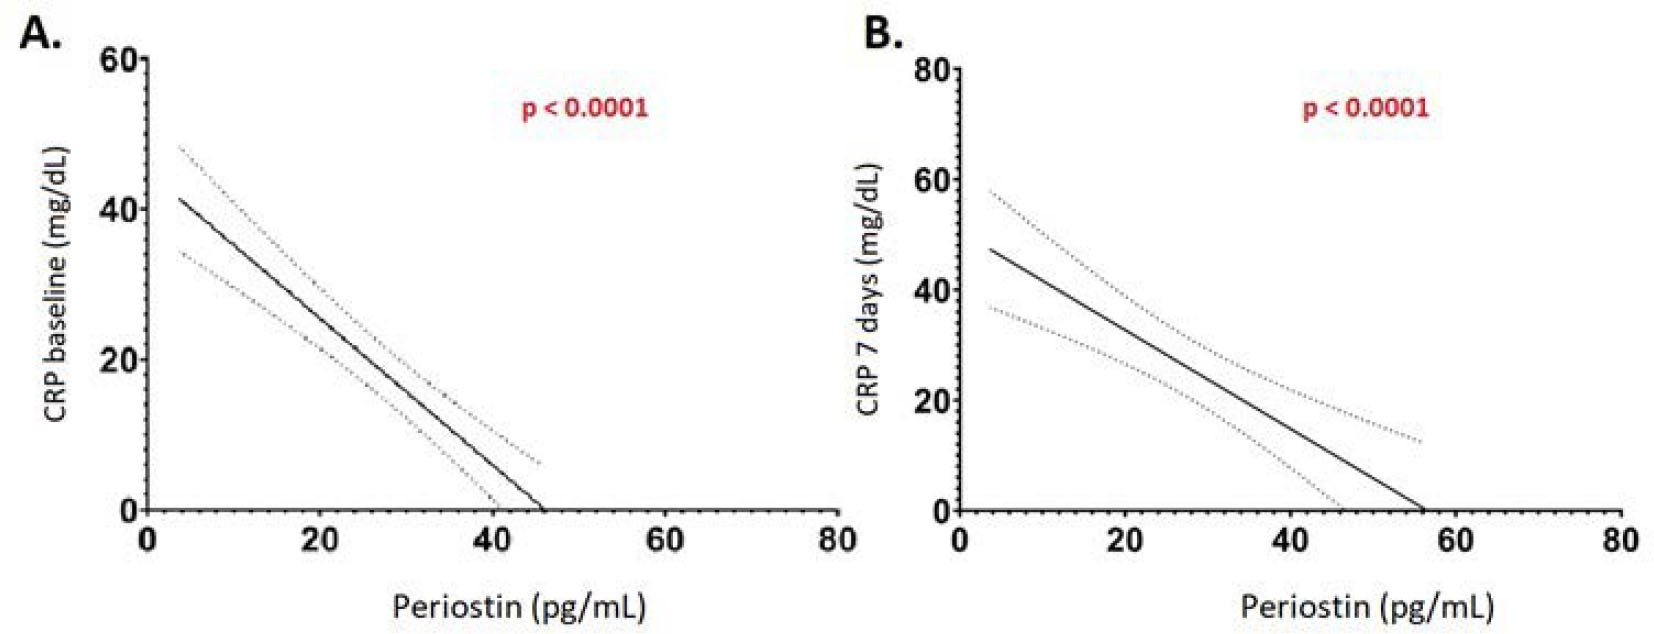
FIGURE 3.
Correlation between Pn and CRP serum levels
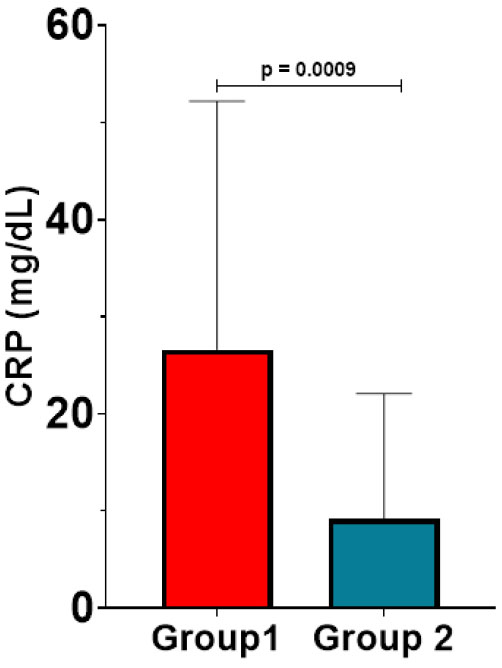
FIGURE 4.
Comparison of CRP serum levels in the two groups at baseline
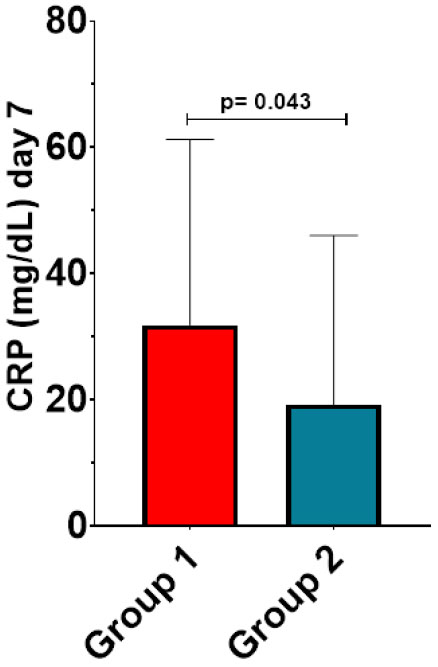
FIGURE 5.
Comparison of CRP serum levels in the two groups on day 7
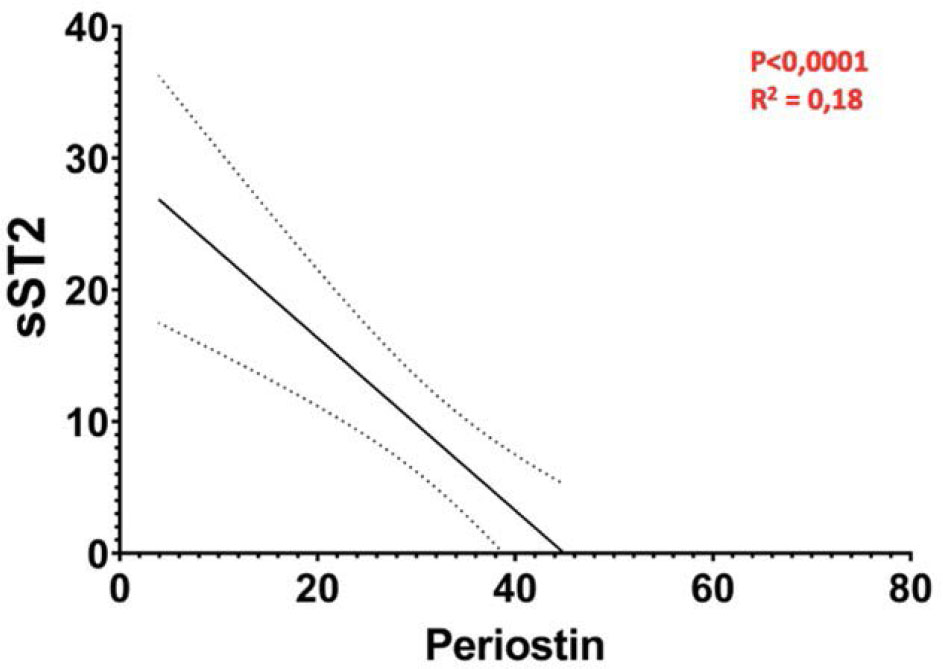
FIGURE 6.
Correlation between Pn and sST2 levels