
TABLE 1.
Main characteristics of the study participants (n = 71)
| Parameter | Value |
|---|---|
| Age (years) | 63.8 ± 9.3 |
| Male sex (n, %) | 47 (66.1%) |
| Body mass index, mean (kg/m2) | 28.6 ± 3.9 |
| Medical history | |
| Arterial hypertension (n, %) | 65 (91.5%) |
| Diabetes mellitus (n, %) | 30 (42.2%) |
| Heart failure (NYHA class) | 2 (2-2) |
| Ongoing therapy | |
| ACEI (n, %) | 49 (69.0%) |
| ARB (n, %) | 15 (21.1%) |
| Diuretic (n, %) | 30 (42.2%) |
| Statin (n, %) | 70 (98.5%) |
| Laboratory parameters | |
| White blood cells (/mm3) | 7,648 ± 1,876 |
| Platelets (/mm3) | 231,812 ± 66,047 |
| Hemoglobin (g/dl) | 13.4 ± 1.5 |
| Glucose (mg/dl) | 141.1 ± 62.7 |
| Total cholesterol (mg/dl) | 163.6 ± 47.8 |
| LDL-cholesterol (mg/dl) | 90.9 ± 41.6 |
| HDL-cholesterol (mg/dl) | 40.6 ± 24.3 |
| Triglycerides (mg/dl) | 163.4 ± 104.5 |
| Total protein (g/dl) | 66.0 ± 4.8 |
| Albumin (g/dl) | 4.3 ± 0.3 |
| Uric acid (mg/dl) | 6.2 ± 1.7 |
| Potassium (mEq/l) | 3.9 ± 0.4 |
| Serum creatinine (mg/dl) | 1.04 ± 0.32 |
| eGFR (ml/min/1.73 m2) | 76.0 ± 23.0 |
| Cystatin C (mg/l) | 1.10 ± 0.37 |
| NGAL (ng/ml) | 75.8 ± 26.6 |
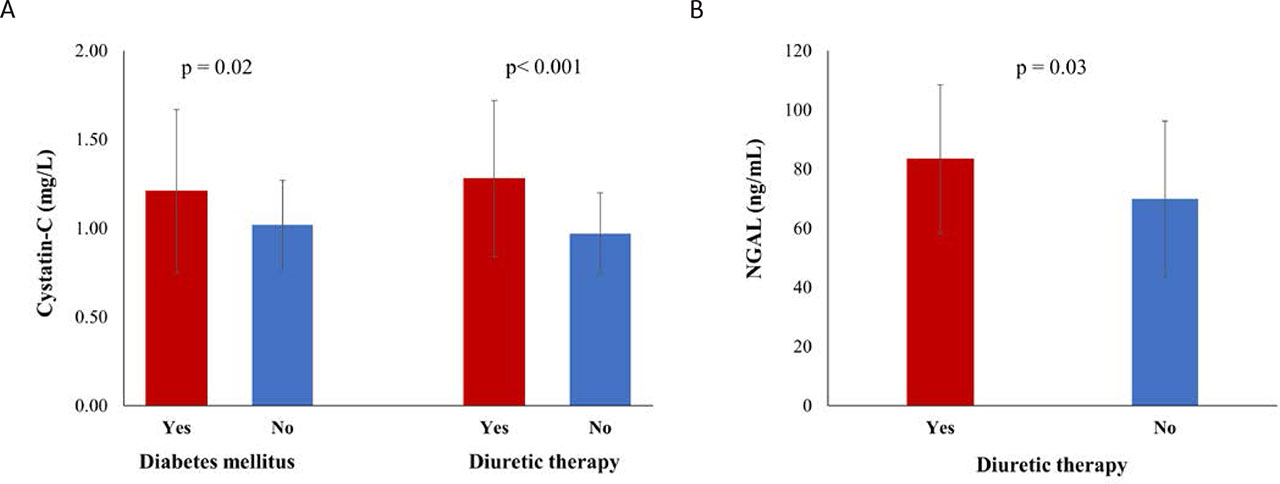
FIGURE 1.
Significant differences in cystatin C levels according to the presence or absence of diabetes mellitus and diuretic therapy (A) and in NGAL levels according to the presence or absence of diuretic therapy (B). Data expressed as means ± s.d.; p values obtained using the unpaired t-test.
TABLE 2.
Correlation analysis of patient characteristics and cystatin C levels
| Parameter | Correlation coefficient | p value |
|---|---|---|
| Age | 0.38 (0.16–0.57) | <0.001* |
| Body mass index | – | 0.52 |
| Heart failure (NYHA class) | – | 0.34 |
| Hemoglobin | −0.30 (−0.50 to −0.07) | 0.01* |
| White blood cells | – | 0.47 |
| Platelets | – | 0.52 |
| Glucose | 0.32 (0.10–0.52) | <0.01* |
| Total cholesterol | – | 0.52 |
| LDL-cholesterol | – | 0.68 |
| HDL-cholesterol | −0.54 (−0.74 to −0.31) | <0.01* |
| Triglycerides | – | 0.12 |
| Total protein | – | 0.72 |
| Albumin | −0.67 (−0.88 to −0.42) | 0.02* |
| Uric acid | 0.70 (0.50–0.87) | <0.0001* |
| Potassium | 0.65 (0.43–0.82) | 0.0001* |
TABLE 3.
Multiple linear regression analysis of factors associated with increased cystatin C levels
TABLE 4.
Correlation analysis of patient characteristics and NGAL levels
| Parameter | Correlation coefficient | p value |
|---|---|---|
| Age | – | 0.31 |
| Body mass index | – | 0.13 |
| Heart failure (NYHA class) | 0.26 (0.03–0.46) | 0.02* |
| Hemoglobin | – | 0.94 |
| White blood cells | 0.68 (0.45–0.88) | 0.01* |
| Platelets | – | 0.41 |
| Glucose | – | 0.51 |
| Total cholesterol | – | 0.89 |
| LDL-cholesterol | – | 0.47 |
| HDL-cholesterol | −0.60 (−0.82 to −0.44) | 0.03* |
| Triglycerides | – | 0.76 |
| Total protein | – | 0.96 |
| Albumin | −0.52 (−0.72 to −0.29) | <0.01* |
| Uric acid | 0.78 (0.55–0.97) | 0.001* |
| Potassium | 0.40 (0.18–0.58) | <0.001* |
TABLE 5.
Multiple linear regression analysis of factors associated with increased NGAL levels