The kidneys are involved in numerous homeostatic functions that are critical for survival and proper body functioning, including regulation of fluid, electrolyte, and acid–base balance, removal of drugs and metabolism waste products, and regulation of the levels of several hormones.1 With its wide array of underlying causes, ranging from hypertension to diabetes mellitus and atherosclerotic disease, chronic kidney disease (CKD) has become a major public health problem, with rising incidence and prevalence, poor outcomes, and increasing costs.2 The evaluation of kidney function is therefore a major desideratum, and numerous laboratory parameters, such as blood urea nitrogen and uric acid, urine protein content, blood and urine electrolyte and glucose levels, urine output, specific gravity, and osmolality, and particularly serum creatinine are routinely evaluated for estimating renal function in a wide array of clinical settings.3 Most of these parameters are, however, nonspecific for kidney disease.
The glomerular filtration rate (GFR) represents at present the single most widely used parameter for kidney function assessment and has been used in numerous studies to identify both predictors and complications of CKD.4 Inulin is an ideal filtration marker seen as the gold standard for GFR assessment, although other exogenous markers, such as 51-chromium-labeled ethylenediamine tetra-acetic acid (51Cr-EDTA), diethylenetriaminepentaacetic acid, iothalamate, or iohexol, can also be used.5 Although extremely useful in physiological studies and as a research tool, using exogenous markers for renal clearance assessment is complex, expensive, time-consuming, and too cumbersome to be implemented as a routine clinical tool. Creatinine, an endogenous by-product of creatine phosphate produced at a constant rate by the body and cleared from the blood by the kidneys, has emerged as a widely available marker for GFR estimation.
However, the evaluation of serum creatinine and serum creatinine-derived estimated GFR (eGFR) has non-negligible limitations. Creatinine production is closely related to muscle bulk, and is therefore highly variable according to age, sex, race, and bodyweight. These factors are incorporated, in various combinations, in the equations most commonly used to estimate GFR. Other factors, such as pregnancy, dietary protein intake, liver disease, muscle injury, rhabdomyolysis, or muscular dystrophy, and the administration of certain drugs that block creatinine secretion in the renal tubules (e.g., cimetidine, spironolactone, trimethoprim) can also affect the levels of serum creatinine and the eGFR values derived from them.6 Additionally, studies evaluating the accuracy of one of the most widely used equations, Modification of Diet in Renal Disease (MDRD), in patients in whom iothalamate clearance tests were performed to measure GFR have shown that although the MDRD equation was relatively accurate in patients with CKD, it greatly underestimated GFR in healthy individuals.7 Similarly, studies assessing the Cockroft–Gault equation in patients in whom GFR was measured using 51Cr-EDTA clearance tests have shown reduced sensitivity and accuracy of this equation and overestimated GFR levels, particularly at low filtration rates, due to creatinine secretion by the renal tubules and lack of adjustment for body surface area.8 Creatinine clearance also overestimates renal function in obese and edematous patients, and is futile in patients who are cachectic or pregnant, who have ascites or low muscle mass.6 In addition, increases in serum creatinine levels are late indicators of renal dysfunction, which may sometimes become apparent only when renal function has already decreased by 50–75%,6 and are therefore incapable of identifying subclinical kidney impairment.9 Serum creatinine concentrations are also not related to structural injuries of the kidneys, and cannot differentiate between different causes of kidney dysfunction such as parenchymal renal injury due to nephrotoxicity, severe liquid loss, or obstructive renal disease.10
Therefore, similarly to other clinical settings,11,12 biomarkers more sensitive than serum creatinine may be required to detect subtle renal changes, and to identify additional predictors and consequences of kidney injury. This would be particularly useful in emergency settings that require contrast media administration, such as coronary or peripheral angiography or angioplasty procedures. Among these markers, neutrophil gelatinase-associated lipocalin (NGAL), a glycoprotein that is rapidly released into the bloodstream in response to renal injury,13 and cystatin C, a low molecular-weight protein that accurately reflects early kidney impairment,14 appear to be extremely promising candidates. Unlike serum creatinine, which provides a rather late reflection of significant functional renal injury, NGAL is an early and highly sensitive marker of structural renal damage,15 and both NGAL and cystatin C levels are less affected by factors such as age, sex, or muscle mass than serum creatinine.14
Accordingly, in this study we aimed to identify predictors and consequences of subclinical renal impairment, as reflected by the levels of two biomarkers more sensitive than serum creatinine, NGAL and cystatin C, in patients with vascular (coronary or peripheral) artery disease.
We carried out a cross-sectional study involving patients hospitalized with stable coronary and/or peripheral vascular disease in our center between January 2020 and November 2021. All patients were ≥18 years of age and provided written informed consent to participate in the study. Patients with acute conditions, regardless of their nature, and those with known CKD were excluded from the study. The research protocol complied with the Declaration of Helsinki and was approved by the ethics committees of the Emergency Institute for Cardiovascular Diseases and Transplantation Târgu Mureș (approval no. 7545/26.10.2018) and of the “George Emil Palade” University of Medicine, Pharmacy, Science and Technology of Târgu Mureș (approval no. 230/07.11.2018), Romania.
All patients were evaluated at hospital admission, prior to any medical and/or surgical intervention. Demographic and anthropometric data, history of diabetes mellitus, arterial hypertension, and heart failure, and ongoing drug therapy were recorded. Blood samples were collected, and total blood count, hemoglobin, plasma potassium, glucose, cholesterol, triglycerides, total protein, albumin, serum creatinine, and uric acid levels were evaluated. The eGFR was calculated using the MDRD equation. Cystatin C and NGAL levels were measured using ELISA on the Elisa Dynex DSX fully automated analyzer (Dynex Technologies).
Continuous variables are presented as mean values ± s.d. or median and interquartile range, as appropriate. Categorical data are expressed as numbers and percentages. Patients were divided into groups depending on the presence or absence of the tested categorical variables, and cystatin C and NGAL levels were compared between groups using the unpaired t-test or the Mann–Whitney U-test, as appropriate. Correlations between cystatin C and NGAL levels and the tested continuous variables were investigated using Pearson’s or Spearman’s correlation methods, as appropriate. Multiple linear regression analysis was used to assess predictors of increased cystatin C and NGAL levels. The models included all parameters that were significantly associated with increased cystatin C and NGAL levels in univariate analyses. All tests were two-sided, and a p value of less than 0.05 was considered statistically significant. All data were computed using MedCalc for Windows v.12.4.3.0 (MedCalc Software).
The study included a total of 71 patients (mean age 63.8 ± 9.3 years; 66.1% males). Patient characteristics are summarized in Table 1.
Main characteristics of the study participants (n = 71)
| Parameter | Value |
|---|---|
| Age (years) | 63.8 ± 9.3 |
| Male sex (n, %) | 47 (66.1%) |
| Body mass index, mean (kg/m2) | 28.6 ± 3.9 |
| Medical history | |
| Arterial hypertension (n, %) | 65 (91.5%) |
| Diabetes mellitus (n, %) | 30 (42.2%) |
| Heart failure (NYHA class) | 2 (2-2) |
| Ongoing therapy | |
| ACEI (n, %) | 49 (69.0%) |
| ARB (n, %) | 15 (21.1%) |
| Diuretic (n, %) | 30 (42.2%) |
| Statin (n, %) | 70 (98.5%) |
| Laboratory parameters | |
| White blood cells (/mm3) | 7,648 ± 1,876 |
| Platelets (/mm3) | 231,812 ± 66,047 |
| Hemoglobin (g/dl) | 13.4 ± 1.5 |
| Glucose (mg/dl) | 141.1 ± 62.7 |
| Total cholesterol (mg/dl) | 163.6 ± 47.8 |
| LDL-cholesterol (mg/dl) | 90.9 ± 41.6 |
| HDL-cholesterol (mg/dl) | 40.6 ± 24.3 |
| Triglycerides (mg/dl) | 163.4 ± 104.5 |
| Total protein (g/dl) | 66.0 ± 4.8 |
| Albumin (g/dl) | 4.3 ± 0.3 |
| Uric acid (mg/dl) | 6.2 ± 1.7 |
| Potassium (mEq/l) | 3.9 ± 0.4 |
| Serum creatinine (mg/dl) | 1.04 ± 0.32 |
| eGFR (ml/min/1.73 m2) | 76.0 ± 23.0 |
| Cystatin C (mg/l) | 1.10 ± 0.37 |
| NGAL (ng/ml) | 75.8 ± 26.6 |
Quantitative data are expressed as mean ± s.d. or median and interquartile range, as appropriate. Categorical data are expressed as numbers (percentages).
ACEI, angiotensin converting enzyme inhibitor; ARB, angiotensin II receptor blocker
There was no significant correlation between eGFR and the patients’ white blood cell and platelet count, plasma glucose, total cholesterol, triglycerides, low-density lipoprotein cholesterol (LDL-C), uric acid, total protein, and albumin levels (all p > 0.05). Similarly, there was no significant difference in eGFR values according to the patients’ history of heart failure or ongoing therapy with angiotensin converting enzyme or angiotensin II receptor inhibitors (all p > 0.05).
Meanwhile, eGFR values were significantly lower in patients with a history of arterial hypertension (p < 0.01), diabetes mellitus (p < 0.0001), and in those undergoing diuretic therapy (p < 0.0001), and were significantly negatively correlated with serum potassium levels (r = −0.42, p < 0.001). In the multiple regression analysis, only history of arterial hypertension (R = −0.28, standard error [SE] 0.01, p = 0.02), diabetes mellitus (R = −0.37, SE 0.02, p < 0.01), and ongoing diuretic therapy (R = −0.40, SE 0.02, p = 0.001) remained independent predictors of decreased eGFR values.
As expected, cystatin C levels were significantly positively correlated with serum creatinine (r = 0.80 [0.71–0.87], p < 0.0001] and negatively correlated with eGFR (r = −0.65 [−0.77 to −0.50], p < 0.0001). There was also a significant positive correlation between cystatin C and NGAL levels (r = 0.67 [0.48–0.81], p < 0.0001).
There was no significant correlation between cystatin C levels and the patients’ body mass index, white blood cell and platelet count, total cholesterol, LDL-C, triglycerides, and total protein levels (all p > 0.05). Similarly, there was no significant difference in cystatin C levels according to patients’ sex, history of arterial hypertension, or ongoing therapy with angiotensin converting enzyme or angiotensin II receptor inhibitors (all p >0.05).
However, cystatin C levels were significantly higher in patients undergoing diuretic therapy (p < 0.001) and in those with diabetes mellitus (p = 0.02) (Figure 1A), were significantly positively correlated with patients’ age (p < 0.001), plasma glucose (p < 0.01), uric acid (p < 0.0001), and potassium (p = 0.0001) levels, and negatively correlated with hemoglobin (p = 0.01), high-density lipoprotein cholesterol (HDL-C) (p < 0.01), and albumin (p = 0.02) levels (Table 2). In the multiple regression analysis, only increased uric acid and potassium, decreased albumin and HDL-C levels, and use of diuretic therapy remained independently associated with increased levels of cystatin C (all p< 0.05; Table 3).
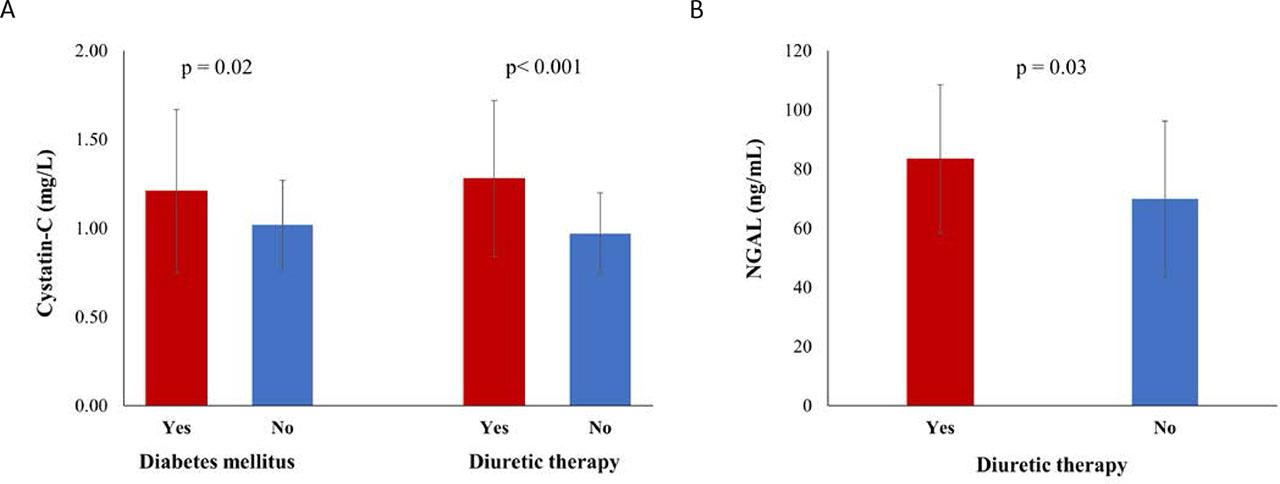
Significant differences in cystatin C levels according to the presence or absence of diabetes mellitus and diuretic therapy (A) and in NGAL levels according to the presence or absence of diuretic therapy (B). Data expressed as means ± s.d.; p values obtained using the unpaired t-test.
Correlation analysis of patient characteristics and cystatin C levels
| Parameter | Correlation coefficient | p value |
|---|---|---|
| Age | 0.38 (0.16–0.57) | <0.001* |
| Body mass index | – | 0.52 |
| Heart failure (NYHA class) | – | 0.34 |
| Hemoglobin | −0.30 (−0.50 to −0.07) | 0.01* |
| White blood cells | – | 0.47 |
| Platelets | – | 0.52 |
| Glucose | 0.32 (0.10–0.52) | <0.01* |
| Total cholesterol | – | 0.52 |
| LDL-cholesterol | – | 0.68 |
| HDL-cholesterol | −0.54 (−0.74 to −0.31) | <0.01* |
| Triglycerides | – | 0.12 |
| Total protein | – | 0.72 |
| Albumin | −0.67 (−0.88 to −0.42) | 0.02* |
| Uric acid | 0.70 (0.50–0.87) | <0.0001* |
| Potassium | 0.65 (0.43–0.82) | 0.0001* |
Correlations were ascertained using Pearson’s or Spearman’s correlation methods, as appropriate.
Statistically significant
Multiple linear regression analysis of factors associated with increased cystatin C levels
| Parameter | Correlation coefficient | Standard error | p value |
|---|---|---|---|
| Age | 0.40 | 0.01 | 0.30 |
| Hemoglobin | −0.30 | 0.02 | 0.46 |
| Glucose | 0.32 | 0.01 | 0.73 |
| HDL-cholesterol | −0.20 | 0.01 | 0.03* |
| Albumin | −0.24 | 0.02 | 0.04* |
| Uric acid | 0.56 | 0.02 | <0.001* |
| Potassium | 0.61 | 0.07 | 0.0001* |
| Diuretic therapy | 0.42 | 0.03 | 0.02* |
Statistically significant
Predictors and consequences of increased neutrophil gelatinase-associated lipocalin levels
Similarly to cystatin C levels, NGAL levels also significantly positively correlated with serum creatinine (r= 0.74 [0.43–0.91], p < 0.0001] and negatively correlated with eGFR (r = −0.63 [−0.83 to −0.30], p < 0.01).
There was no significant correlation between NGAL levels and the patients’ age, body mass index, hemoglobin levels, platelet count, plasma glucose, total cholesterol, triglycerides, LDL-C, and total protein levels (all p > 0.05). Similarly, there was no significant difference in NGAL levels according to the patients’ sex, history of arterial hypertension or diabetes mellitus, or ongoing therapy with angiotensin converting enzyme or angiotensin II receptor inhibitors (all p > 0.05).
However, NGAL levels were significantly higher in patients undergoing diuretic therapy (p = 0.03) (Figure 1B), were significantly positively correlated with New York Heart Association (NYHA) heart failure class (p = 0.02), white blood cell count (p = 0.01), uric acid (p = 0.001), and potassium (p < 0.001) levels, and negatively correlated with HDL-C (p = 0.03) and albumin (p < 0.01) levels (Table 4). In the multiple regression analysis, only increased white blood cell count and uric acid levels, as well as decreased albumin and HDL-C levels remained independently associated with increased levels of NGAL (all p < 0.05; Table 5).
Correlation analysis of patient characteristics and NGAL levels
| Parameter | Correlation coefficient | p value |
|---|---|---|
| Age | – | 0.31 |
| Body mass index | – | 0.13 |
| Heart failure (NYHA class) | 0.26 (0.03–0.46) | 0.02* |
| Hemoglobin | – | 0.94 |
| White blood cells | 0.68 (0.45–0.88) | 0.01* |
| Platelets | – | 0.41 |
| Glucose | – | 0.51 |
| Total cholesterol | – | 0.89 |
| LDL-cholesterol | – | 0.47 |
| HDL-cholesterol | −0.60 (−0.82 to −0.44) | 0.03* |
| Triglycerides | – | 0.76 |
| Total protein | – | 0.96 |
| Albumin | −0.52 (−0.72 to −0.29) | <0.01* |
| Uric acid | 0.78 (0.55–0.97) | 0.001* |
| Potassium | 0.40 (0.18–0.58) | <0.001* |
Correlations were ascertained using Pearson’s or Spearman’s correlation methods, as appropriate.
Statistically significant
Multiple linear regression analysis of factors associated with increased NGAL levels
| Parameter | Correlation coefficient | Standard error | p value |
|---|---|---|---|
| Age | 0.29 | 5.52 | 0.06 |
| Hemoglobin | 0.49 | 0.01 | <0.01* |
| Glucose | −0.46 | 0.04 | 0.03* |
| HDL-cholesterol | −0.34 | 0.05 | 0.02* |
| Albumin | 0.39 | 0.07 | <0.01* |
| Uric acid | 0.43 | 6.22 | 0.10 |
| Potassium | 0.28 | 5.80 | 0.31 |
| Diuretic therapy | 0.42 | 0.03 | 0.02* |
Statistically significant
The main findings of the present study are the following: 1) decreased eGFR was only independently associated with widely known risk factors for renal impairment (i.e., arterial hypertension, diabetes mellitus, and diuretic usage); meanwhile, 2) increased white blood cell count and diuretic usage were independently associated with higher NGAL and cystatin C levels, respectively, and increased uric acid levels were independently associated with higher levels of both biomarkers of kidney injury; and, 3) increased NGAL and cystatin C levels were independently associated with lower albumin and HDL-C levels, and increased cystatin C levels were also associated with higher serum potassium.
Several techniques are available for evaluating kidney function, including the determination of circulating levels of nitrogenous, non-protein molecules, the evaluation of nephron filtration capacity and of the kidneys’ ability to maintain electrolyte and water balance, and the assessment of the excretion of various endogenous and exogenous molecules in the urine.
However, although far from ideal, the measurement of serum creatinine levels and the calculation of serum creatinine-derived eGFR remain the most widely used biomarkers of kidney function in clinical practice, and have been identified as predictors of negative outcomes in many clinical settings.16 The use of urine creatinine in conjunction with serum creatinine to calculate the GFR strongly increases the accuracy of GFR evaluation,3 but it is rarely employed in routine clinical practice. Moreover, studies have shown the abbreviated MDRD equation to significantly underestimate GFR in healthy individuals, probably because they were excluded from the study from which the equation was derived.7 At similar age, sex, and serum creatinine levels, the GFR was on average 20% higher in healthy subjects than in those with CKD, suggesting that different equations may be required for patients without CKD or with unknown kidney disease status.7 By contrast, due to creatinine secretion by the kidney tubules and lack of adjustment for body surface area, the Cockcroft–Gault formula has been shown to overestimate the GFR, particularly at low GFR values.3 However, when compared to each other, the MDRD equation was found to have better accuracy in the diagnosis and stratification of patients with CKD and of those with diabetes mellitus.8 Similarly to creatinine clearance, the clearance of urea, a major byproduct of protein metabolism, can also be used to estimate kidney function. However, 40–70% of the filtered urea is reabsorbed from the kidney tubules, and this percentage considerably increases in settings with decreased renal perfusion, leading to GFR underestimation. In addition, urea levels are also highly affected by diet, liver function, and other conditions.17
Meanwhile, NGAL, a glycoprotein that is rapidly released into the bloodstream in response to renal tubular injury, is more sensitive than creatinine and has emerged as a promising biomarker of early and/or subtle kidney injury.13 Unlike serum creatinine, NGAL can unmask renal injury even in the absence of significant renal functional impairment15 and has been proposed as one of the most promising biomarkers of renal structural injury18 in patients with septic shock or post cardiac interventions.19,20 In fact, the Acute Dialysis Quality Initiative has even proposed the use of a combination of functional (i.e., serum creatinine) and structural (e.g., NGAL) kidney damage markers to stratify the risk of acute kidney injury.21
Cystatin C, a non-glycosylated low-molecular-weight serine protease inhibitor produced by all nucleated cells at a relatively constant rate, is freely filtered by the kidneys. Its serum levels are therefore inversely correlated with GFR,22 as also shown in the present study. Moreover, given that its levels do not seem to be affected by inflammation, liver cirrhosis, age, sex, muscle mass, diet, or ongoing therapy, cystatin C is seen as a more accurate biomarker of kidney function than serum creatinine.3,22
In line with previous studies, in the present study, eGFR values were independently associated with a history of arterial hypertension, diabetes mellitus, and ongoing diuretic therapy, all of which are widely known risk factors for impaired renal function. Meanwhile, NGAL and cystatin C evaluation allowed the identification of more subtle hematologic and biochemical changes related to subclinical kidney injury.
Advancing age and impaired glucose metabolism are widely accepted risk factors for kidney injury through microvascular renal angiopathy and nephron loss.2,23 In line with these data, in this study, cystatin C levels significantly positively correlated with age and plasma glucose levels, and NGAL levels significantly positively correlated with the severity of heart failure, reflecting hemodynamic renal impairment. However, none of those three factors remained independent predictors of increased NGAL and cystatin C levels after correction for potential confounders. At the same time, diuretic drug usage was independently associated with higher cystatin C levels, increased white blood cell count independently predicted higher NGAL levels, and increased uric acid levels were independent predictors of both cystatin C and NGAL level increases. Together, these data indicate inflammation, reflected by increased white blood cell count, as a contributor to structural kidney injury, although this does not seem to be associated with concomitant functional impairment. Alternatively, the positive correlation between white blood cell count and NGAL levels could also be seen as a consequence of higher NGAL release by a higher number of circulating neutrophils.24 Meanwhile, diuretic usage was associated with subclinical impairment in kidney function, in the absence of any apparent structural alterations. Indeed, whereas diuretic overdosing has been associated in previous studies with tubular cells apoptosis,25 standard diuretic doses can induce transient GFR alterations by increasing tubular and/or decreasing glomerular hydrostatic pressures, thereby altering the balance in glomerular filtration forces. Unlike white blood cell count and diuretic drug usage, increased uric acid levels affected both kidney structure and function in the present study, suggesting that uric acid may represent an important therapeutic target for the prevention of CKD. High uric acid levels have been shown to cause vascular inflammation, oxidative stress, and endothelial dysfunction, and to significantly affect glomerular arterioles.26,27,28
Features such as anemia, hyperkalemia, dyslipidemia, or hypoproteinemia are often seen among patients with CKD.29 The present study demonstrates that markers of subclinical renal impairment, such as NGAL and cystatin C, correlate negatively with HDL-C and albumin levels and positively with potassium levels, even in the absence of overt biochemical abnormalities. However, in the multiple regression analysis, only decreased HDL-C and albumin levels were independently predicted by increased NGAL and cystatin C levels. In addition, increased cystatin C levels also positively correlated and independently predicted higher serum potassium. Previous studies have also linked increased cystatin C levels with dyslipidemia and vascular disease, even in the absence of other cardiovascular risk factors.30,31
The present study investigated the relationship between two emerging biomarkers of subclinical structural and functional renal impairment and a wide range of biochemical and hematological parameters that reflect an important number of factors involved in the occurrence and progression of CKD, as well as a vast array of CKD complications. Two major findings emerge from this study: 1) even the presence of subtle, covert kidney disease risk factors (e.g., uric acid) is associated with subclinical kidney injury; 2) subclinical kidney injury is accompanied by early, subtle changes in biomarkers of kidney disease-related complications (e.g., albumin, serum potassium, HDL-C). The sample size of the study was, however, rather small, and this may have affected the ability to detect other, more subtle predictors and complications of subclinical kidney injury. Although NGAL and cystatin C are clearly valuable biomarkers of subclinical renal impairment, one should be aware that none of them are specific for kidney injury. Small amounts of NGAL can also originate from other sources, such as neutrophils, myocardial, prostatic, respiratory, or gastrointestinal cells,15 whereas cystatin C is secreted by all nucleated cells and its levels may be affected by the presence of cancer, thyroid disease, or smoking.32 Finally, subclinical renal impairment was evaluated in the present study using only NGAL and cystatin C. Evaluation of the relationships between the studied variables and other markers of kidney injury, such as urinary NGAL and cystatin C, β2- and β1-microglobulin, β-trace protein, retinol-binding protein, or kidney injury molecule-1, would also be of interest.
In the present study, eGFR values were independently associated with a history of arterial hypertension, diabetes mellitus, and with ongoing diuretic therapy, all of which are widely known risk factors for impaired renal function. Meanwhile, NGAL and cystatin C evaluation identified more subtle hematologic and biochemical changes related to subclinical kidney injury. These data reinforce the role of NGAL and cystatin C as biomarkers of subclinical kidney injury and support their potential usefulness in the early identification of subclinical kidney injury risk factors and of subclinical kidney injury-related abnormalities. This would be particularly useful in emergency settings that require contrast media administration, such as coronary or peripheral angiography or angioplasty procedures, when the identification of subclinical kidney injury could guide patient management to avoid further complications.