
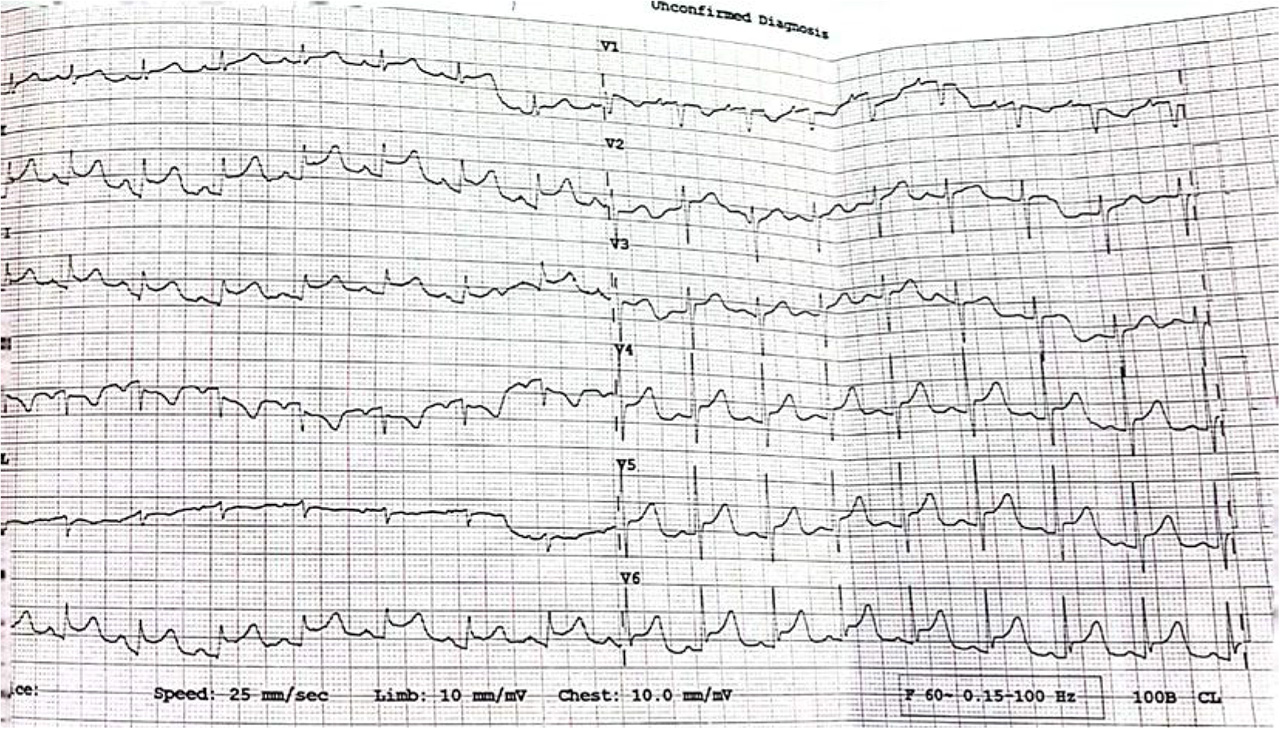
FIGURE 1.
Electrocardiogram showing ST elevation in inferolateral leads
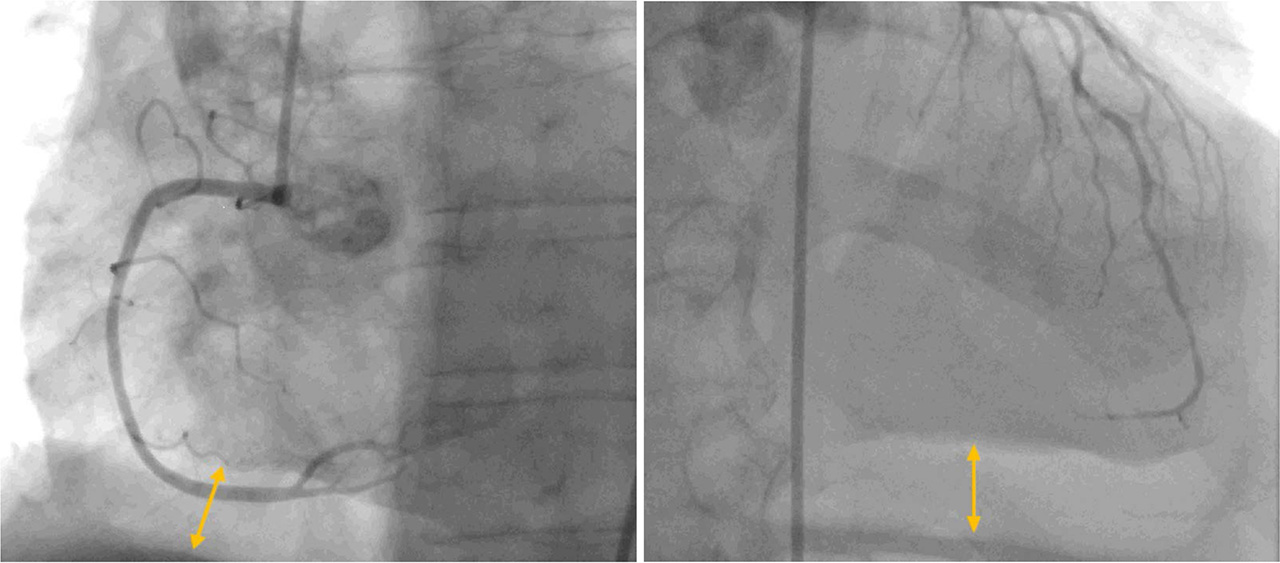
FIGURE 2.
Coronary angiography showing normal coronary arteries. Hydroaeric image lining the inferior edge of cardiac projection (arrows)
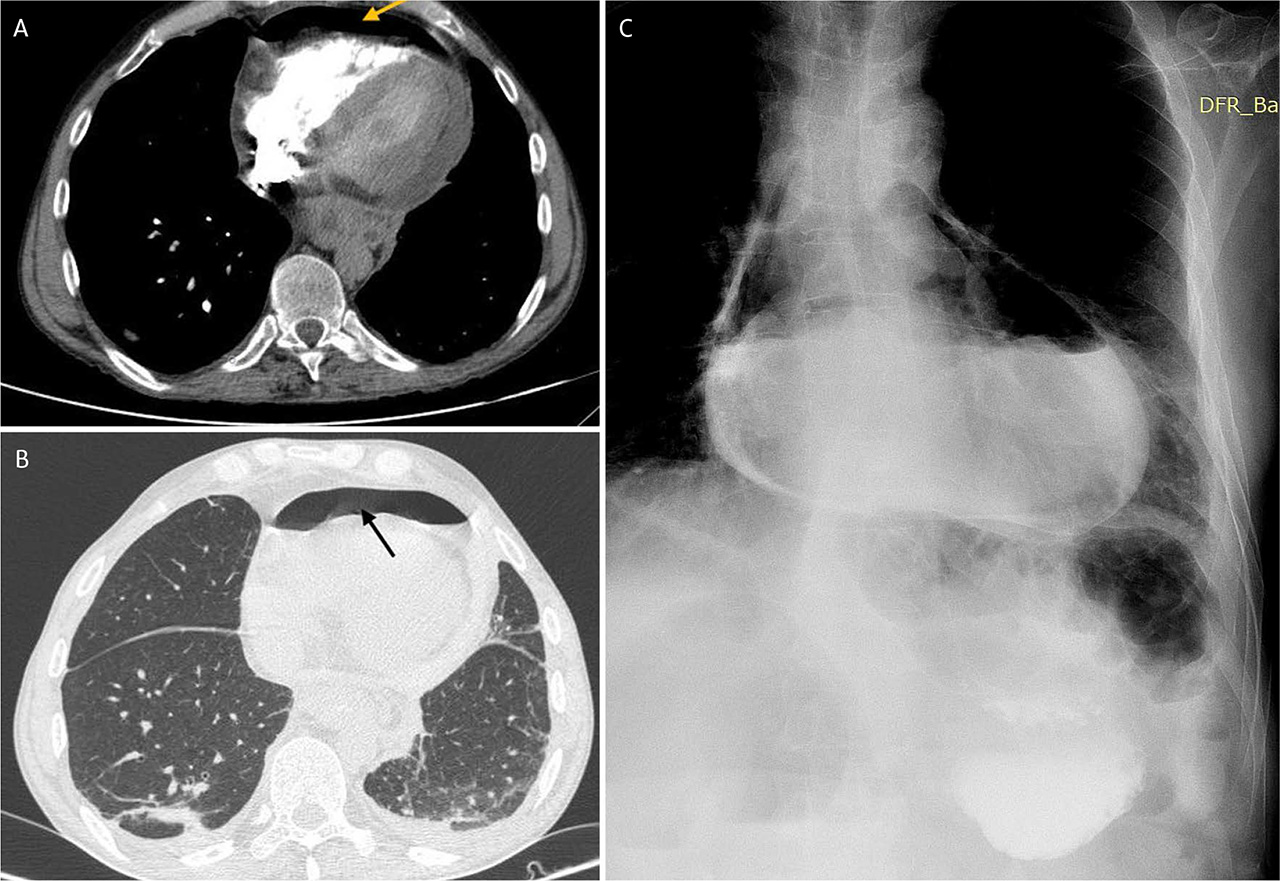
FIGURE 3.
A,B. CT scan, hydropneumopericardium. C. Extravasation of contrast in the pericardium during the Gastrografin study