
Table 1.
Laboratory tests and diuresis
| Laboratory test | Day 1 | Day 3 | Day 5 | Day 7 | Day 8 | Day 9 | Day 10 | Day 12 | Day 14 | Day 16 | Day 18 | Day 20 | Day 23 | Reference Range |
|---|---|---|---|---|---|---|---|---|---|---|---|---|---|---|
| Leukocytes | 32500 | 28300 | 23700 | 20000 | 25100 | 27200 | 31100 | 27400 | 21600 | 17500 | 13100 | 9900 | 10000 | 3600–10000/μL |
| Neutrophils | 28000 | 24200 | 20600 | 17300 | 21000 | 23700 | 26900 | 22100 | 16300 | 11400 | 9600 | 7800 | 7900 | 1400–6500/μL |
| Hemoglobin | 9.33 | 9.4 | 9.2 | 9 | 8.9 | 8.8 | 8.8 | 9.1 | 9.4 | 9.85 | 9.6 | 9.3 | 9.1 | 13–17g/dL |
| Platelets | 154000 | 143000 | 150000 | 149000 | 133000 | 121000 | 112000 | 117000 | 126000 | 123000 | 117000 | 119000 | 116000 | 150000–450000/μL |
| C reactive protein | 140.5 | 122.5 | 110.5 | 70 | 140 | 219 | 243 | 194 | 152 | 93 | 40 | 10 | 15 | 0–5mg/L |
| Procalcitonin | 14.54 | 5 | 12.3 | 8 | 6 | <0.5mg/L | ||||||||
| Presepsin | 1369 | 714 | 1236 | 744 | 432 | 100–200 pg/mL | ||||||||
| NT-proBNP | 23614 | 21500 | <125pg/mL | |||||||||||
| AST | 24 | 25 | 18 | 22 | 18 | 23 | 30 | 5–34U/L | ||||||
| ALT | 5 | 7 | 6 | 6 | 6 | 7 | 8 | 0–55U/L | ||||||
| Total bilirubin | 1.42 | 1.37 | 1.27 | 1.22 | 1.09 | 1.26 | 1.41 | 0.2–1.2 mg/dL | ||||||
| Albumin | 3.06 | 3.0 | 3.97–4.94 g/dL | |||||||||||
| Total protein | 6.19 | 6.1 | 6.4–8.3 g/dL | |||||||||||
| INR | 1.17 | 1.04 | 0.94 | 0.9 | 0.92 | 0.96 | 0.8–1.2 | |||||||
| Sodium | 136 | 134 | 134 | 133 | 133 | 132 | 132 | 131 | 130 | 130 | 130 | 130 | 130 | 136–145 mmol/L |
| Potassium | 3.67 | 3.5 | 3.63 | 3.69 | 3.7 | 3.74 | 3.76 | 3.8 | 3.6 | 3.5 | 3.4 | 3.6 | 3.5 | 3.5–5.1 mmol/L |
| Glucose | 94 | 106 | 101 | 95 | 88 | 78 | 83 | 96 | 99 | 94 | 121 | 117 | 104 | 70–105 mg/dL |
| pH | 7.31 | 7.33 | 7.32 | 7.35 | 7.36 | 7.35 | 7.33 | 7.33 | 7.31 | 7.3 | 7.29 | 7.26 | 7.2 | 7.35–7.45 |
| PO2 | 65 | 68 | 70 | 71 | 72 | 71 | 72 | 71 | 70 | 70 | 71 | 70 | 70 | 75–100 mmHg |
| PCO2 | 49 | 44 | 43 | 44 | 46 | 49 | 51 | 53 | 53 | 54 | 54 | 55 | 65 | 35–45 mmHg |
| P(A-a)O2 | 158,95 | 162,2 | 161,45 | 159,2 | 155,7 | 152,95 | 149,45 | 147,95 | 148,95 | 147,7 | 146,7 | 146,45 | 133,95 | mmHg |
| FShunt | 39 | 22 | 20 | 21 | 20 | 21 | 32 | 30 | 26 | 28 | 30 | 33 | 37 | % |
| HCO3 | 18 | 19 | 21 | 22 | 23 | 22 | 20 | 19 | 19 | 18 | 18 | 17 | 20 | 22–26mEq/L |
| SaO2 | 75 | 88 | 90 | 89 | 90 | 89 | 84 | 85 | 87 | 86 | 85 | 80 | 78 | 95–100% |
| Lactate | 3.6 | 3.5 | 3.4 | 3.1 | 3.2 | 3.3 | 3.5 | 3.1 | 2.9 | 2.8 | 3.0 | 3.1 | 3.2 | <2mmol/L |
| Urea | 117 | 89 | 87 | 81 | 70 | 74 | 72 | 71 | 72 | 79 | 85 | 82 | 79 | 19.04–44.08 mg/dL |
| Creatinine | 2.85 | 2.31 | 2.23 | 2.01 | 1.62 | 1.85 | 1.9 | 1.76 | 1.79 | 2.07 | 2.11 | 2.15 | 2.16 | 0.72–1.25 mg/dL |
| Diuresis | 3L | 3.2L | 3L | 2.8L | 2.9L | 3.3L | 3.1L | 3L | 2.7L | 2.8L | 2.6L | 2.7L | 2.5L |
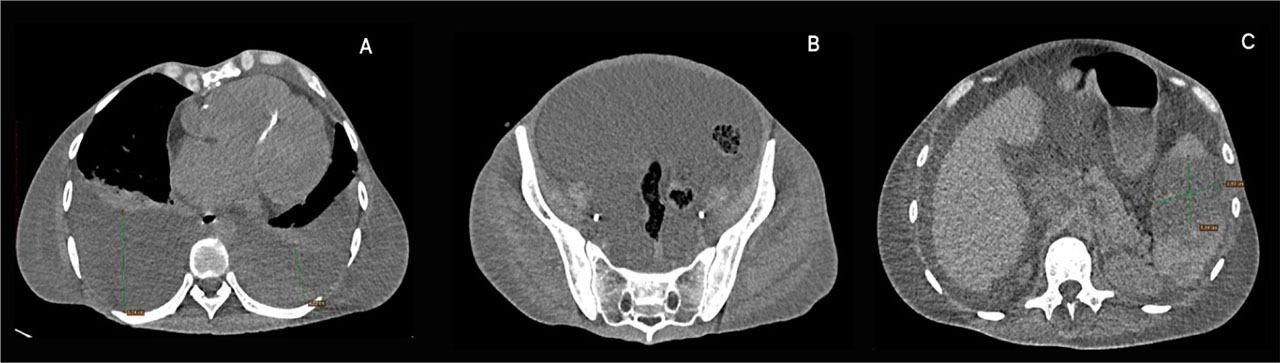
Fig. 1.
A. Chest CT scan: Large bilateral pleural effusions with atelectasis; Mild pectus excavatum with a Haller index of 2.28; B. Abdominopelvic CT scan: Large amount of ascites; C. Abdominal CT scan: Splenic infarcts
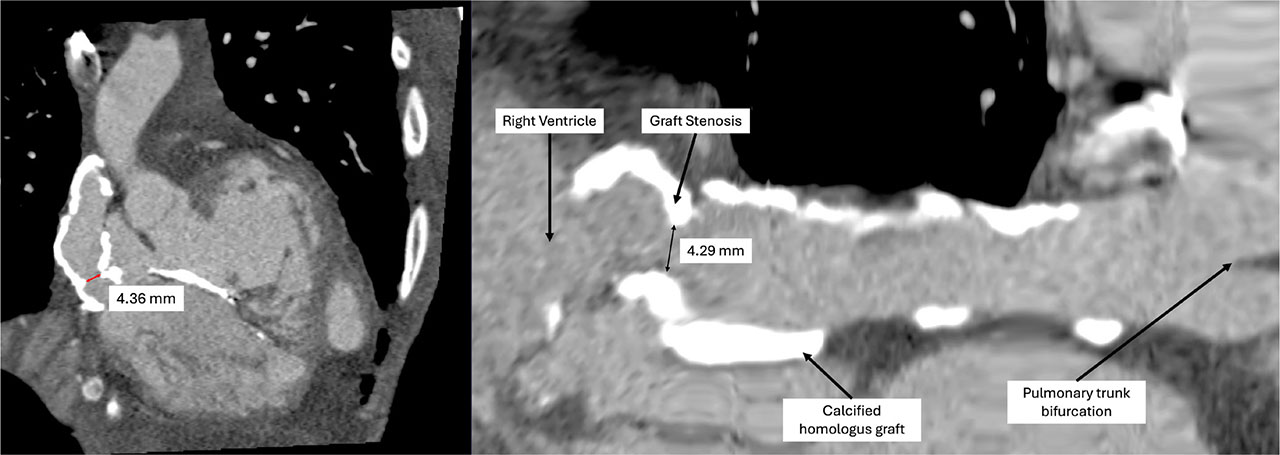
Fig. 2.
Cardiac CT scan with intravenous contrast: Homograft stenosis-reduction in the diameter of the conduit connecting the right ventricle to the pulmonary artery from 14 mm to 4.29 mm
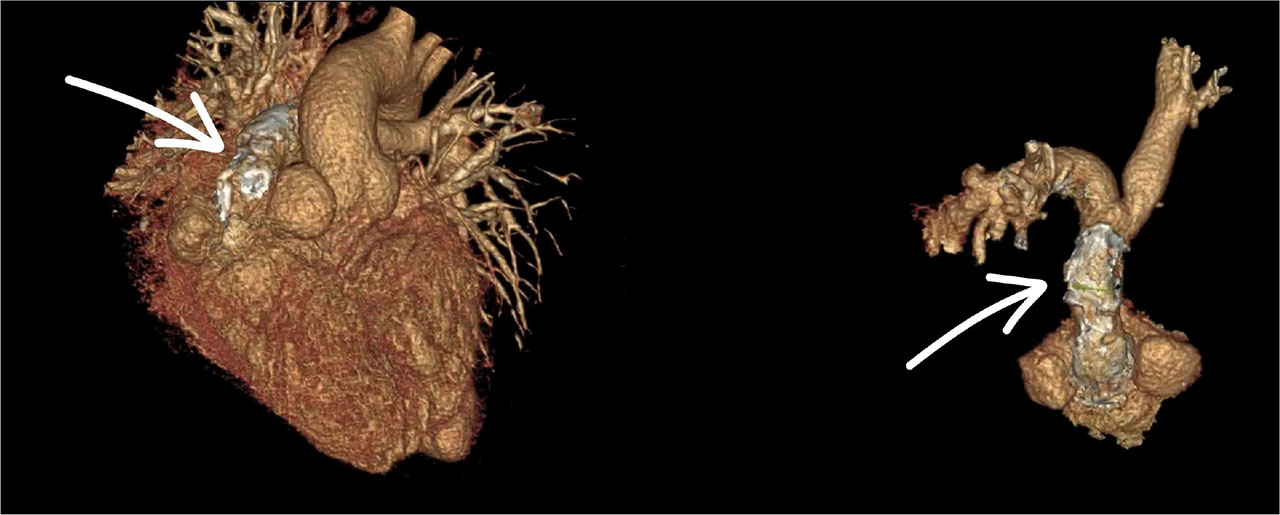
Fig. 3.
3D reconstruction of the heart showing the homograft conduit connecting the right ventricle to the pulmonary artery
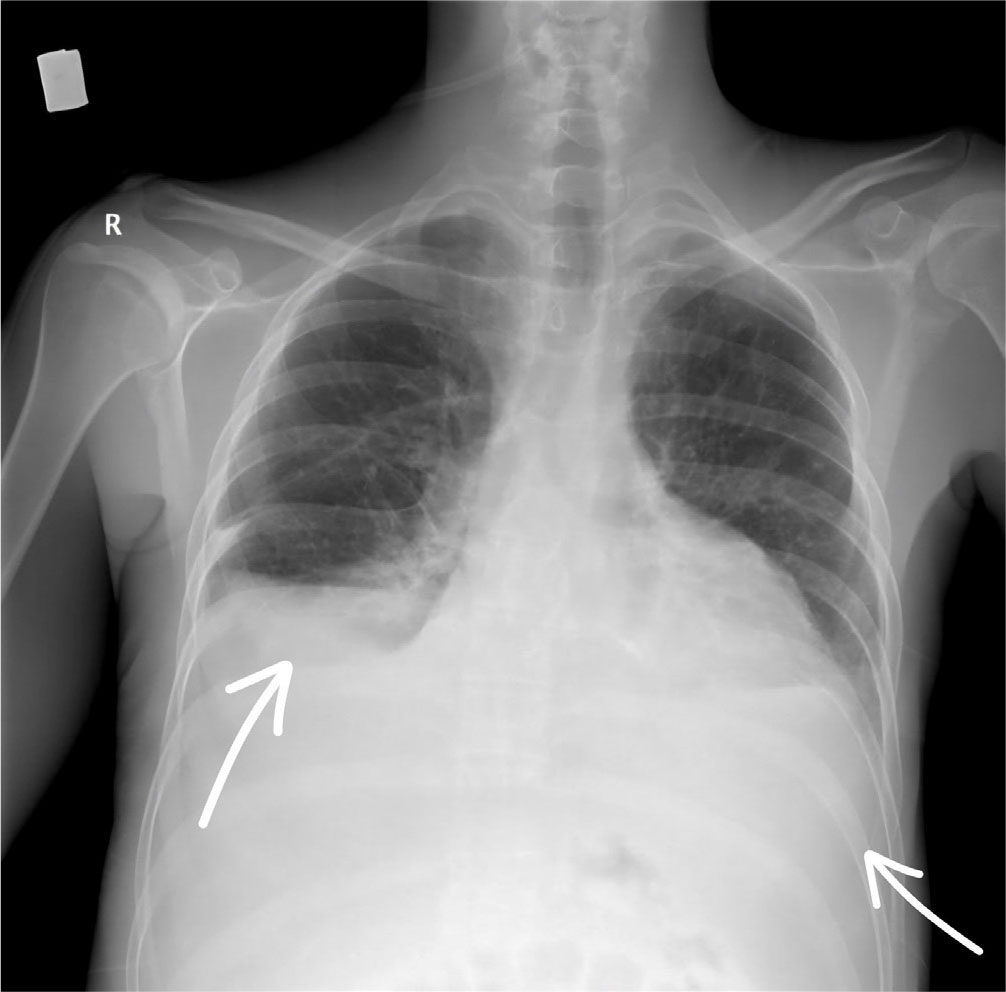
Fig. 4.
Chest X-ray after bilateral thoracentesis – no condensation foci, no signs of pneumothorax