Fig. 1.
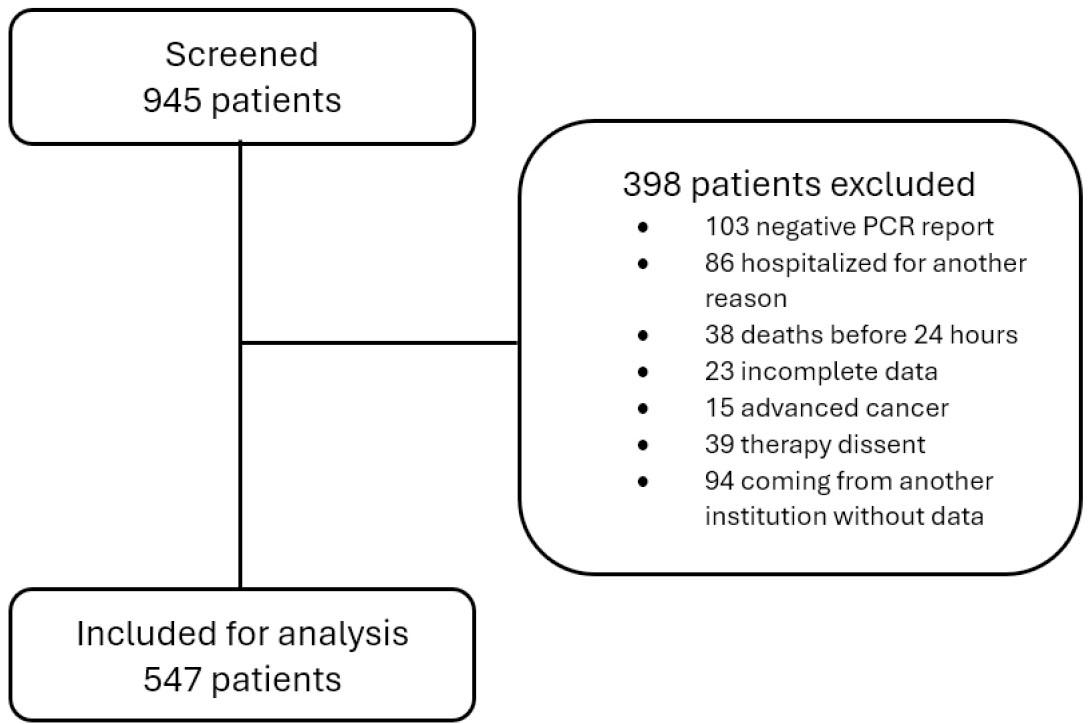
Fig. 2.
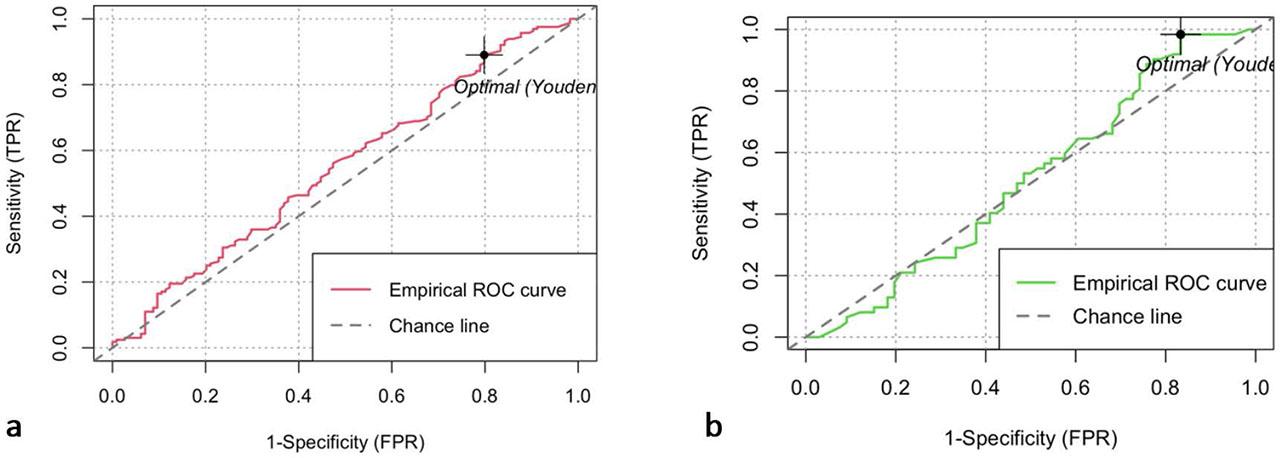
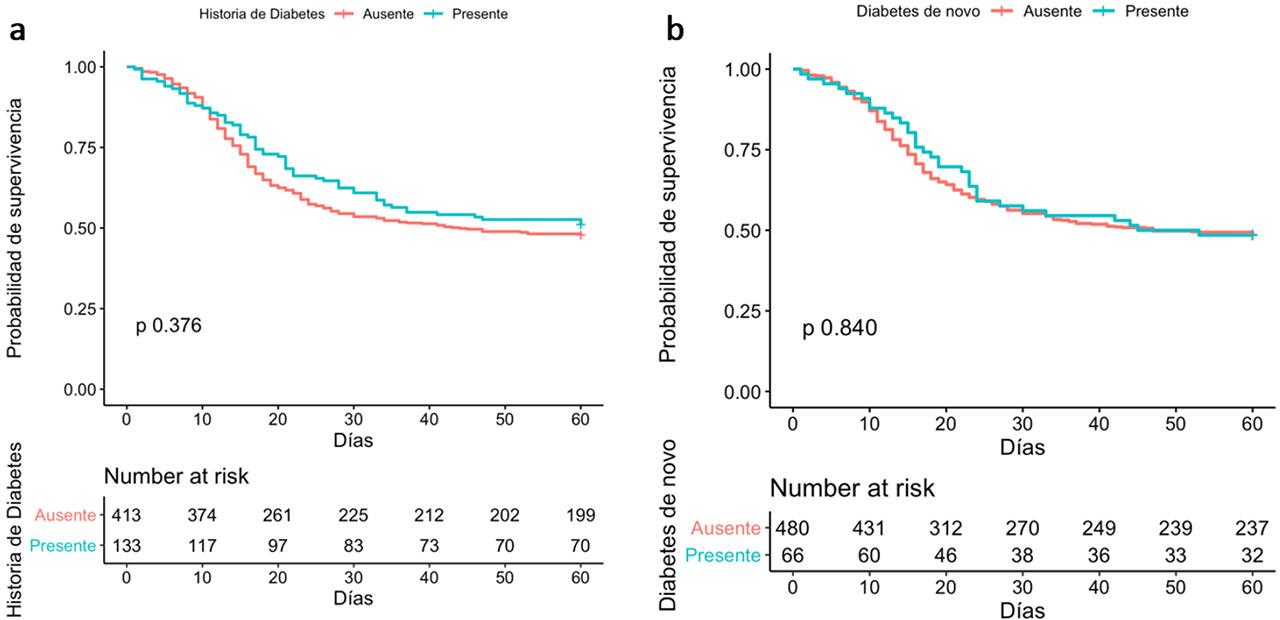
Fig. 3.
Laboratory Results and Outcomes
| Characteristics | Total (n=547) | No diabetes (n= 347) | Type 2 diabetes (n= 133) | De novo diabetes (n= 67) |
|---|---|---|---|---|
| Laboratories, mean (SD) | ||||
| White blood cell count (×103 cells/μL) | 11894 (9607) | 11894 (9607) | 11911 (9685) | 11870 (9670) |
| Lymphocytes (×103 cells/μL) | 982 (1626) | 905 (772) | 867 (724) | 899 (785) |
| Platelet count (×103 cells/μL) | 241723 (95848) | 241723 (95848) | 242059 (95948) | 241986 (96157) |
| Lactate (mmol/L) | 1.96 (1.78) | 1.96 (1.78) | 1.98 (1.79) | 1.96 (1.79) |
| Creatinin (mg/dL) | 0.28 (0.73) | 0.27 (0.73) | 0.29 (0.74) | 2.0 (0.74) |
| Aspartate aminotransferase (U/L) | 126 (424.8) | 126 (424.8) | 127 (429.12) | 126 (428.4) |
| Alanine aminotransferase (U/L) | 97 (235.62) | 97 (235.62) | 98 (237.91) | 93 (208.2) |
| Prothrombin time (seg) | 12 (9.13) | 12 (9.13) | 12 (9.22) | 12 (9.21) |
| Partial thromboplastin time (seg) | 28.2 (17.7) | 28.2 (17.7) | 28.2 (17.92) | 28.3 (17.92) |
| C-reactive protein (mg/L) | 18.3 (20.21) | 18.3 (20.21) | 18.4 (20.36) | 18.4 (20.34) |
| Ferritin (ng/mL) | 1054 (635.43) | 1054 (635.43) | 1058 (628.93) | 1052 (635.49) |
| D – Dimer (μg/mL) | 220 (2100) | 220 (2100) | 224 (2122) | 224 (2122) |
| Lactate dehydrogenase, U/L | 1163 (5530) | 1163 (5530) | 1163 (5582) | 1167 (5568) |
| Positive troponin, n(%) | 257 (47.0%) | 172 (50.0%) | 49 (37.0%) | 36 (54.0%) |
| PaO2/FiO2 Ratio | 103 (61.41) | 103 (61.41) | 104 (61.77) | 103 (61.68) |
| Clinical Prediction Rules, mean (SD) | ||||
| Acute Physiology And Chronic Health | ||||
| Evaluation (APACHE) II at admission | 14.58 (7.16) | 14.58 (7.16) | 14.62 (7.17) | 14.56 (7.13) |
| Sequential Organ Failure Assessment (SOFA) at admission | 5.22 (3.55) | 5.22 (3.55) | 5.21 (3.57) | 5.22 (3.54) |
| CURB-65 | 1.82 (1.03) | 1.82 (1.03) | 1.82 (1.04) | 1.81 (1.03) |
| Organ Dysfunctions, n (%) | ||||
| Severe ARDS (Pa/FiO2 <100) | 341 (62.34%) | 259 (75.0%) | 77 (58.0%) | 50 (75.0%) |
| Acute Liver Injury | 60 (10.96%) | 53 (15.2%) | 7 (5.3%) | 11 (16.4%) |
| Coagulopathy | 59 (10.78%) | 46 (13.31%) | 12 (9.0%) | 13 (19.4%) |
| CNS Involvement | 50 (9.14) | 37 (11.0%) | 12 (9.0%) | 12 (18.0%) |
| Acute Myocardial Injury | 141 (25.77) | 108 (31.1%) | 30 (23.0%) | 23 (34.3%) |
| Pulmonary embolism, n (%) | 65 (11.88%) | 51 (15.0%) | 13 (10.0%) | 17 (25.3%) |
| Length of Hospital Stay, mean (SD) | 23.6 (18.45) | 23.6 (18.45) | 23.75 (18.58) | 23.68 (18.56) |
| Death, n (%) | 317 (58.0%) | 211 (61.0%) | 65 (49.0%) | 41 (61.2%) |
Results of Bivariate Analyses
| HR | 95% Confidence Interval | p value | |
|---|---|---|---|
| All diabetes | 0.888 | 0.6953 – 1.135 | 0.344 |
| History of diabetes | 0.881 | 0.6675 – 1.163 | 0.371 |
| De novo diabetes | 0.963 | 0.672 – 1.378 | 0.835 |
General characteristics of the population
| Characteristics | Total (n=547) | No diabetes (n= 347) | Type 2 diabetes (n= 133) | De novo diabetes (n= 67) |
|---|---|---|---|---|
| Female sex, n (%) | 196 (36%) | 130 (37.5%) | 62 (46.7%) | 25 (37.3%) |
| Age (years), mean (SD) | 59.8 (14.3) | 59.83 (17.0) | 60.2 (13.9) | 59.6 (14.2) |
| 20–29, n (%) | 19 (3.4%) | 17 (4.8%) | 3 (2.3%) | 3 (4.5%) |
| 30–39 | 36 (6.5%) | 29 (8.3%) | 7 (5.2%) | 3 (4.5%) |
| 40–49 | 76 (13.9%) | 65 (18.7%) | 9 (6.8%) | 7 (10.5%) |
| 50–59 | 112 (20.4%) | 84 (24.2%) | 25 (18.8%) | 19 (28.3%) |
| 60–69 | 154 (28.1%) | 103 (29.6%) | 49 (36.8%) | 26 (39.0%) |
| 70–79 | 112 (20.4%) | 77 (22.2%) | 31 (23.3%) | 15 (22.4%) |
| 80–89 | 37 (6.7%) | 28 (8.06%) | 9 (6.8%) | 4 (6.0%) |
| <=90 | 0 (0%) | 0 (0%) | 0 (0%) | 0 (0%) |
| Obesity, n (%) | 154 (28.1%) | 112 (32.3%) | 41 (30.8%) | 20 (30.0%) |
| Comorbidities, n (%) | ||||
| Hypertension | 237 (43.3%) | 140 (40.3%) | 93 (70.0%) | 28 (42.0%) |
| Chronic Heart Disease (excluding Hypertension) | 60 (19.9%) | 38 (11.0%) | 22 (16.5%) | 8 (12.0%) |
| Chronic kidney disease | 22 (4.0%) | 11 (3.2%) | 11 (8.3%) | 1 (1.5%) |
| Smoking | 131 (23.9%) | 99 (28.5%) | 31 (23.3%) | 13 (19.4%) |
| Chronic lung disease | 107 (19.5%) | 72 (20.7%) | 34 (25.6%) | 14 (21.0%) |
| Chronic Neurological Disease or Dementia | 25 (4.5%) | 16 (4.6%) | 9 (6.8%) | 3 (4.5%) |
| Human Immunodeficiency Virus | 1 (0.18%) | 1 (0.3%) | 0 (0%) | 0 (0%) |
| Autoimmune disease | 6 (1.09%) | 6 (1.7%) | 0 (0%) | 0 (0%) |
| Cancer | 15 (2.74%) | 9 (2.6%) | 6 (4.5%) | 3 (4.5%) |
| Chronic liver disease | 6 (1.09%) | 5 (1.5%) | 1 (0.8%) | 1 (1.5%) |
| Symptom duration before ICU (days), mean (SD) | 8 (4.23) | 8 (4.23) | 8 (4.13) | 8 (4.23) |