Fig. 1.
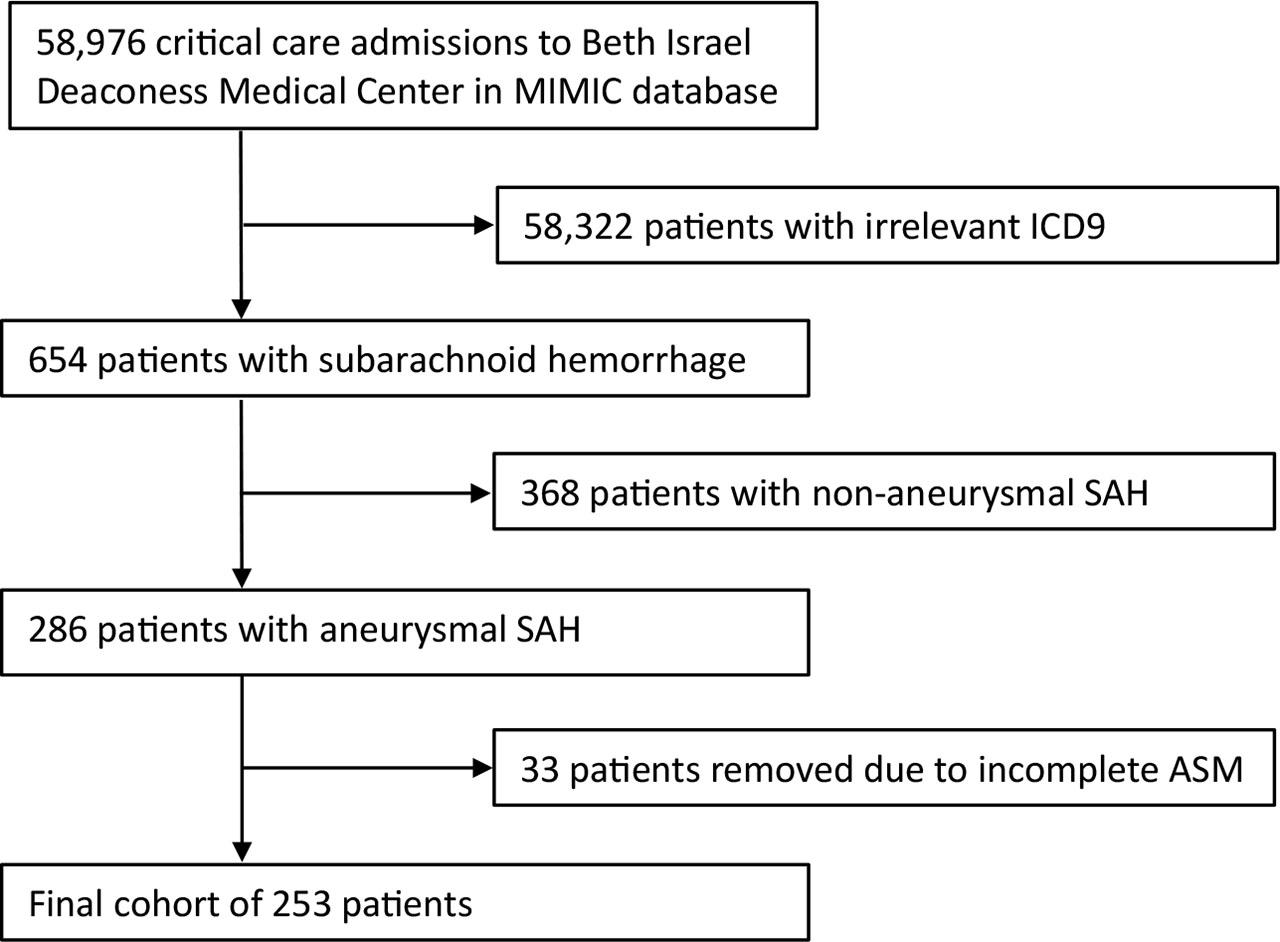
Fig. 2.
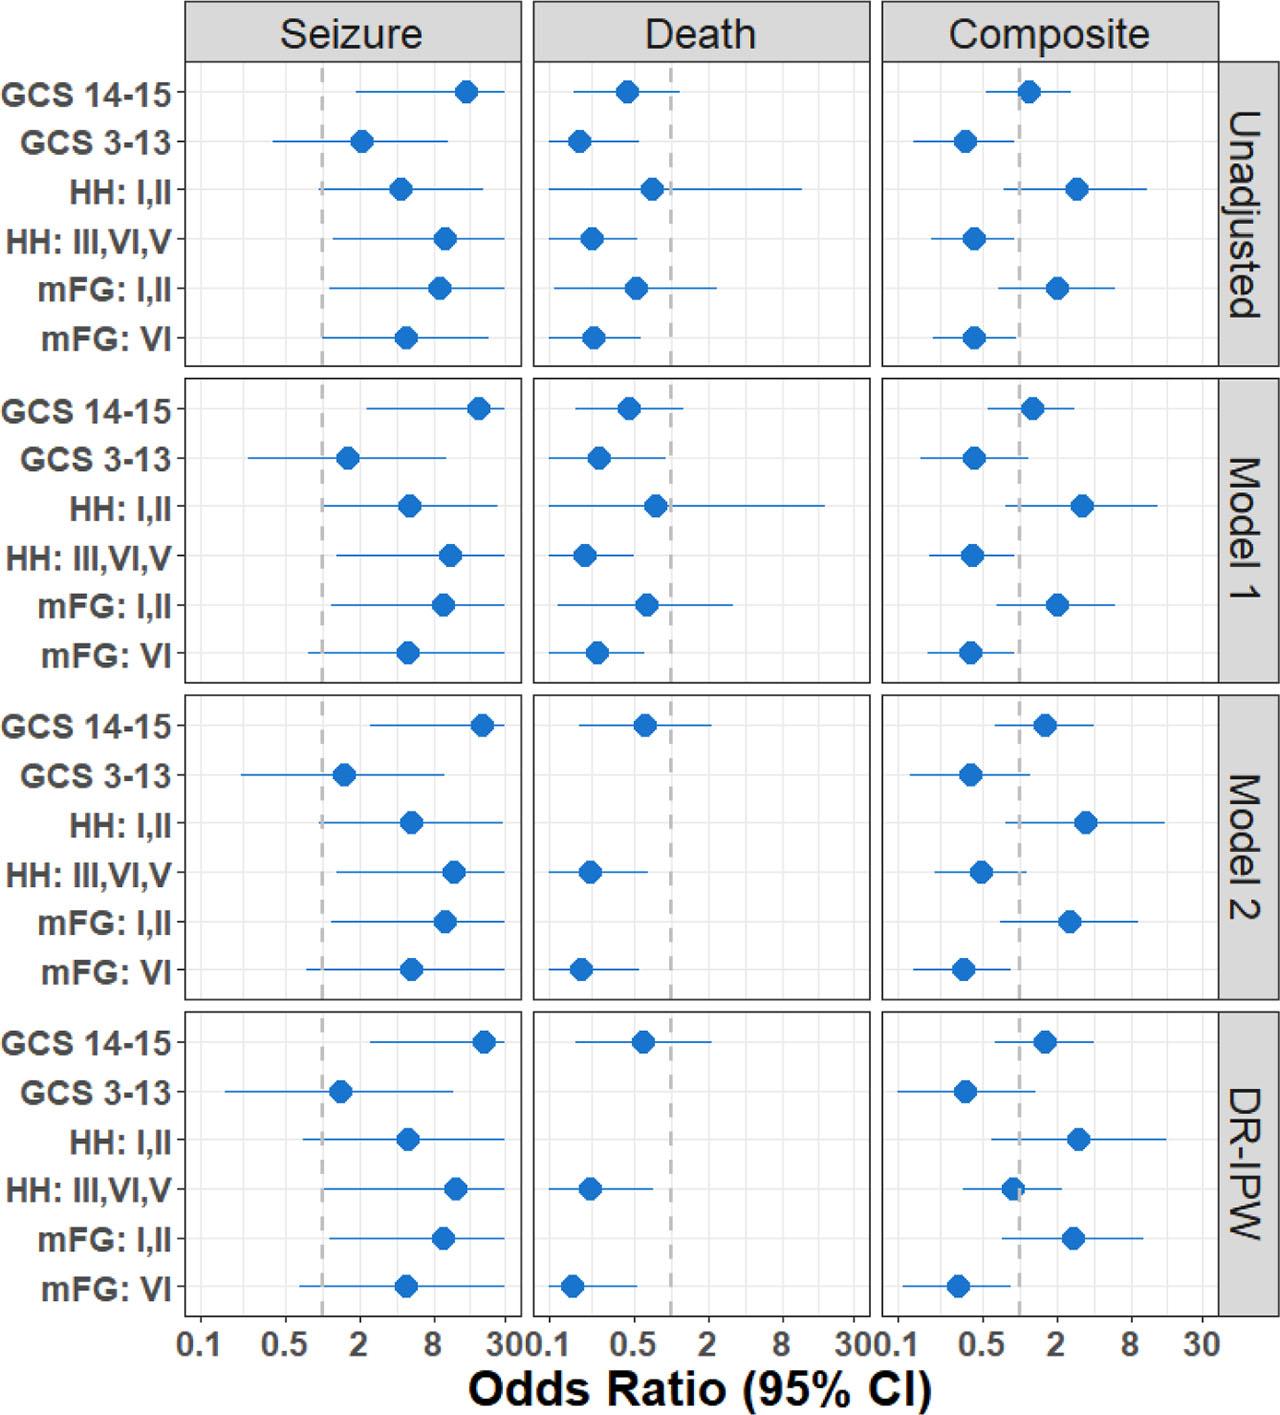
Fig. 3.
Demographics of the cohort; early (pASM) and no drug administration (No ASM) groups, including age, sex, race, GCS on admission, ICD9 diagnosis, and Elixhauser van Walraven comorbidity score_
| No ASM (N=105) | Early ASM (N=148) | SMD | p-Value | |
|---|---|---|---|---|
| Age, median [Quartiles] | 56 [47–73] | 56 [47–67] | 0.08 | 0.657 |
| Gender, Female, N (%) | 68 (64.8) | 97 (65.5) | −0.02 | 1 |
| Race, N (%) | ||||
| White | 65 (61.9) | 100 (67.6) | −0.12 | 0.425 |
| Black | 7 (6.7) | 16 (10.8) | −0.15 | 0.364 |
| Latino | 8 (7.6) | 7 (4.7) | 0.12 | 0.491 |
| GCS at admission, median [Quartiles] | 15 [13–15] | 14 [11–15] | 0.16 | 0.052 |
| GCS 15, N (%) | 54 (51.9) | 58 (39.2) | 0.26 | 0.061 |
| GCS 14, N (%) | 20 (19.2) | 33 (22.3) | −0.07 | 0.666 |
| GCS 13, N (%) | 10 (9.6) | 14 (9.5) | 0.01 | 1 |
| GCS (7–12), N (%) | 10 (9.6) | 28 (18.9) | −0.27 | 0.064 |
| GCS (3–6), N (%) | 10 (9.6) | 15 (10.1) | −0.02 | 1 |
| HH, N (%) | ||||
| I | 21 (20.0) | 25 (16.9) | 0.08 | 0.641 |
| II | 36 (34.3) | 57 (38.5) | −0.09 | 0.579 |
| III | 19 (18.1) | 32 (21.6) | −0.09 | 0.596 |
| IV | 7 (6.7) | 11 (7.4) | −0.03 | 1 |
| V | 21 (20.0) | 23 (15.5) | 0.12 | 0.451 |
| mFG, N (%) | ||||
| I | 33 (31.4) | 28 (18.9) | 0.29 | 0.032 |
| II | 7 (6.7) | 29 (19.6) | −0.39 | 0.007 |
| III | 14 (13.3) | 23 (15.5) | −0.06 | 0.757 |
| IV | 49 (46.7) | 68 (45.9) | 0.01 | 1 |
| Elixhauser, median [Quartiles] | 2 [1–3] | 2 [1–3] | 0.04 | 0.702 |
| Anterior Circulation | 74 (70.5) | 112 (75.7) | −0.13 | 0.436 |
| Posterior Circulation | 24 (22.9) | 31 (20.9) | 0.06 | 0.835 |
| Aneurysm Treatment Modality | ||||
| Clip | 17 (17.4) | 34 (23.9) | −0.16 | 0.286 |
| Coil | 77 (78.6) | 99 (69.7) | 0.20 | 0.169 |
| Aneurysmal Re-bleeding | 3 (2.9) | 7 (4.7) | −0.10 | 0.67 |
| Vasospasm | 26 (24.8) | 48 (32.4) | −0.17 | 0.237 |
| Other Interventions, N (%) | ||||
| Tracheostomy | 2 (1.9) | 8 (5.4) | −0.19 | 0.28 |
| Percutaneous endoscopic gastrostomy tube | 4 (3.8) | 13 (8.8) | −0.20 | 0.193 |
| Ventriculostomy | 9 (8.6) | 18 (12.2) | −0.12 | 0.481 |
| CSF Shunt | 3 (2.9) | 11 (7.43) | −0.21 | 0.197 |
| RRT, N (%) | 1 (0.95) | 1 (0.7) | 0.03 | 1 |
| Mechanical Ventilation, N (%) | 74 (70.5) | 101 (69.2) | 0.03 | 0.935 |
| Discharge at, N (%) | ||||
| Home | 34 (32.4) | 44 (29.7) | 0.06 | 0.755 |
| Rehabilitation | 21 (20.0) | 40 (27.0) | −0.17 | 0.255 |
| Dead (in Hospital) | 32 (30.5) | 23 (15.5) | 0.36 | 0.007 |
| Other | 18 (17.1) | 41 (27.7) | −0.25 | 0.071 |
Observed number of outcomes by (No ASM/pASM) groups and by different sensitivity groups at 7 days_ OR [95% CI]: Unadjusted odd ratio and 95% confidence intervals_
| No ASM | Early ASM | OR [95% CI] | p-Value | |
|---|---|---|---|---|
| Total | 105 | 148 | ||
| Seizure | 3 (2.9) | 22 (15.0) | 5.98 (1.7 to 20.6) | 0.003 |
| Death | 25 (23.8) | 14 (9.5) | 0.33 (0.16 to 0.68) | 0.003 |
| Composite | 28 (26.7) | 32 (21.8) | 0.77 (0.43 to 1.4) | 0.453 |
| GCS 15-14 | 74 | 91 | ||
| Seizure | 1 (1.4) | 15 (16.5) | 14.6 (1.88 to 113.4) | 0.003 |
| Death | 12 (16.2) | 7 (7.7) | 0.44 (0.16 to 1.17) | 0.144 |
| Composite | 13 (17.6) | 18 (19.8) | 1.17 (0.53 to 2.59) | 0.872 |
| GCS 3–13 | 30 | 57 | ||
| Seizure | 2 (6.7) | 7 (12.5) | 2.04 (0.40 to 10.5) | 0.636 |
| Death | 12 (40) | 7 (12.3) | 0.18 (0.06 to 0.55) | 0.007 |
| Composite | 14 (46.7) | 14 (15.1) | 0.35 (0.14 to 0.91) | 0.032 |
| HH: I, II | 57 | 82 | ||
| Seizure | 2 (3.5) | 11 (13.4) | 4.32 (0.92 to 20.3) | 0.094 |
| Death | 1 (1.7) | 1 (1.2) | 0.70 (0.04 to 11.4) | 1.00 |
| Composite | 3 (5.3) | 11 (13.4) | 2.83 (0.75 to 10.6) | 0.199 |
| HH: III, IV, V | 48 | 66 | ||
| Seizure | 1 (2.1) | 11 (16.7) | 9.55 (1.19 to 76.8) | 0.026 |
| Death | 24 (50.0) | 13 (19.7) | 0.24 (0.10 to 0.55) | 0.001 |
| Composite | 25 (52.1) | 21 (31.8) | 0.44 (0.20 to 0.94) | 0.055 |
| mF: I, II, III | 56 | 80 | ||
| Seizure | 1 (1.8) | 11 (13.8) | 8.90 (1.11 to 71.1) | 0.035 |
| Death | 4 (7.1) | 4 (5.0) | 0.51 (0.11 to 2.4) | 0.879 |
| Composite | 5 (8.9) | 14 (17.5) | 2.01 (0.67 to 6.0) | 0.243 |
| mF: IV | 49 | 68 | ||
| Seizure | 2 (4.1) | 11 (16.2) | 4.6 (0.97 to 21.8) | 0.075 |
| Death | 21 (42.9) | 10 (14.7) | 0.25 (0.10 to 0.59) | 0.001 |
| Composite | 23 (46.9) | 18 (26.5) | 0.44 (0.14 to 0.97) | 0.042 |
Regression models and adjusted odds ratios at 7-days for outcomes: seizure, death, and composite if foregoing ASM administration_ Results are based on unadjusted data, and adjusted models
| Seizure | Death | Composite | ||||||||||
|---|---|---|---|---|---|---|---|---|---|---|---|---|
| OR | [95% CI] | p-Value | OR | [95% CI] | p-Value | OR | [95% CI] | p-Value | ||||
| Unadjusted | 5.98 | 1.74 | 20.56 | 0.0045 | 0.33 | 0.16 | 0.68 | 0.0025 | 0.77 | 0.43 | 1.37 | 0.3688 |
| Model 1 | 6.64 | 1.86 | 23.66 | 0.0035 | 0.35 | 0.17 | 0.72 | 0.0048 | 0.79 | 0.44 | 1.41 | 0.4207 |
| Model 2 | 7.63 | 2.07 | 28.17 | 0.0023 | 0.26 | 0.10 | 0.68 | 0.0063 | 0.79 | 0.40 | 1.55 | 0.4880 |
| DR-IPSW | 7.65 | 2.03 | 28.89 | 0.0027 | 0.25 | 0.09 | 0.67 | 0.0062 | 0.79 | 0.40 | 1.57 | 0.5062 |
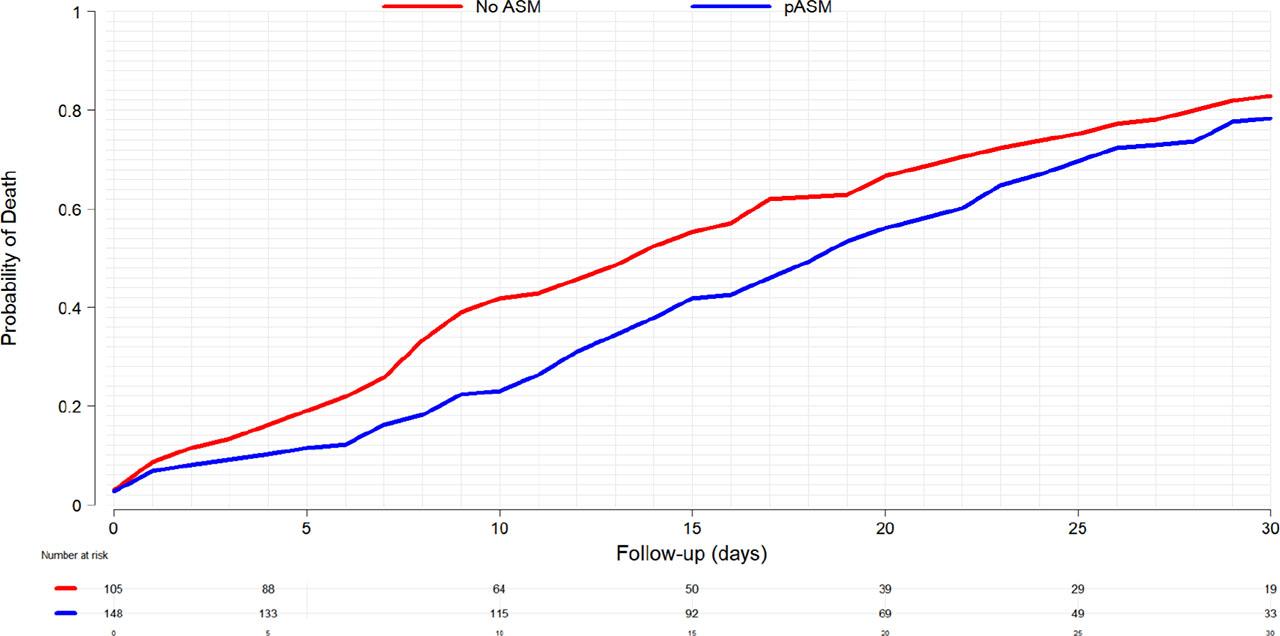
Survival Models – Hazard ratios at 7-days, 30-days, and 1-year
| 7 Days | 30 Days | 1 Year | ||||||||||
|---|---|---|---|---|---|---|---|---|---|---|---|---|
| HR | [95% CI] | p-Value | HR | [95% CI] | p-Value | HR | [95% CI] | p-Value | ||||
| Unadjusted | 0.38 | 0.20 | 0.72 | 0.0034 | 0.78 | 0.59 | 1.03 | 0.0791 | 0.84 | 0.65 | 1.10 | 0.2040 |
| Model 1 | 0.42 | 0.21 | 0.80 | 0.0092 | 0.78 | 0.59 | 1.03 | 0.0847 | 0.84 | 0.65 | 1.09 | 0.1990 |
| Model 2 | 0.33 | 0.16 | 0.66 | 0.0021 | 0.73 | 0.55 | 0.98 | 0.0332 | 0.79 | 0.60 | 1.03 | 0.0831 |
| DR-IPSW | 0.32 | 0.15 | 0.69 | 0.0036 | 0.73 | 0.55 | 0.97 | 0.0285 | 0.79 | 0.60 | 1.03 | 0.0823 |