
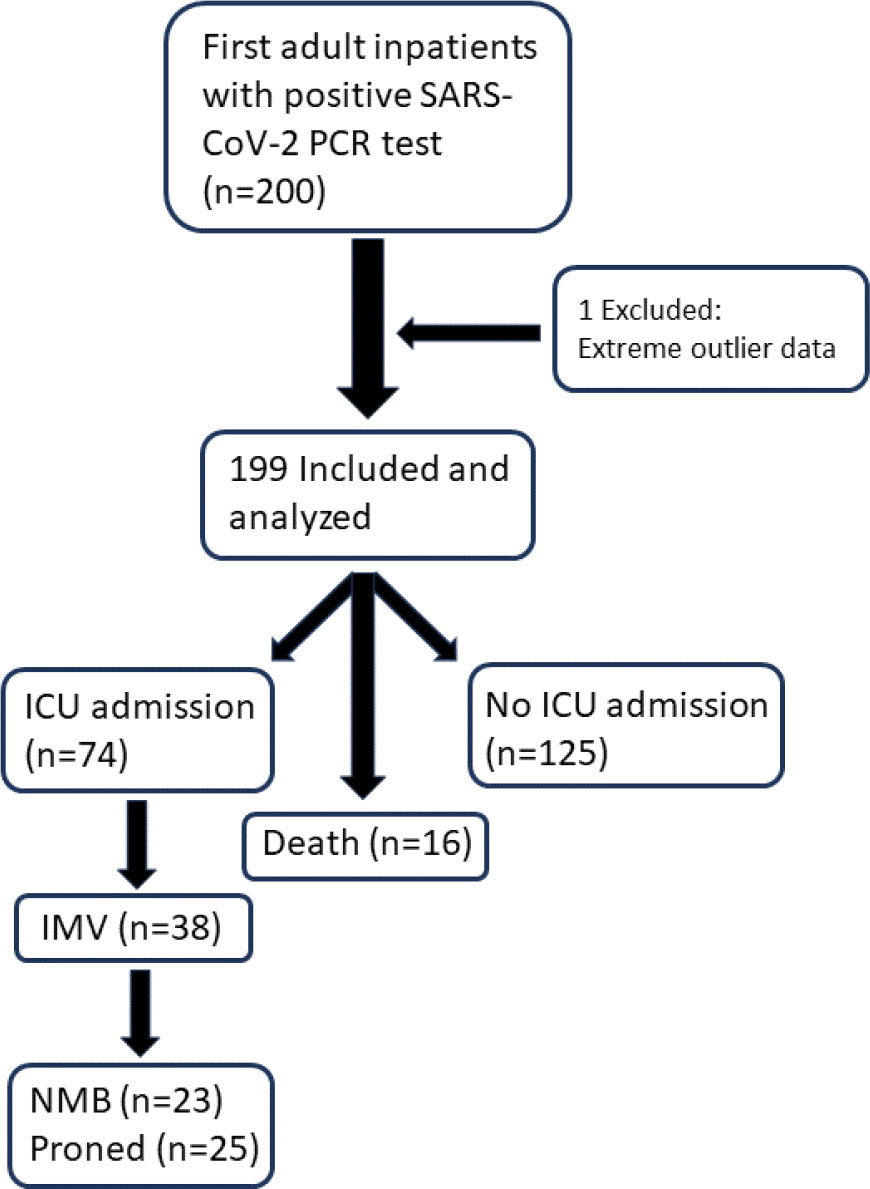
Fig. 1.
Flowchart of study subject selection and clinical outcomes. ICU = Intensive Care Unit; IMV = invasive mechanical ventilation; NMB = neuromuscular blockade.
Table 1.
Demographics and clinical characteristics of cohort
| Total (N = 199) | Non-obese (N = 133) | Obese (N = 66) | p-value | |
|---|---|---|---|---|
| Age | ||||
| Median (IQR) | 63 (45, 77) | 69 (51, 82) | 53 (41, 65) | <0.001 |
| Sex | ||||
| Male | 118 (59%) | 80 (60%) | 38 (58%) | 0.845 |
| Female | 81 (41%) | 53 (40%) | 28 (42%) | 0.845 |
| Race/Ethnicity | ||||
| Black | 19 (10%) | 14 (11%) | 5 (7%) | 0.681 |
| White | 78 (39%) | 59 (44%) | 19 (29%) | 0.049 |
| Asian | 17 (9%) | 13 (10%) | 4 (6%) | 0.540 |
| Latinx | 63 (32%) | 31 (23%) | 32 (48%) | <0.001 |
| Other | 22 (11%) | 16 (12%) | 6 (9%) | 0.702 |
| Comorbidities | ||||
| No PMHx | 16 (8%) | 15 (11%) | 1 (2%) | 0.035 |
| Diabetes w/end-organ damage* | 20 (10%) | 12 (9%) | 8 (12%) | 0.664 |
| Diabetes w/o end-organ damage* | 41 (21%) | 26 (20%) | 15 (23%) | 0.737 |
| Hypertension | 109 (55%) | 75 (56%) | 34 (52%) | 0.618 |
| Hyperlipidemia | 76 (38%) | 53 (40%) | 23 (35%) | 0.597 |
| CKD | 45 (23%) | 27 (20%) | 18 (27%) | 0.354 |
| COPD | 21 (11%) | 16 (12%) | 5 (8%) | 0.473 |
| CAD | 44 (22%) | 30 (23%) | 14 (21%) | 0.973 |
| Cancer | 4 (2%) | 4 (3%) | 0 (0%) | 0.375 |
| Asthma | 28 (14%) | 18 (14%) | 10 (15%) | 0.926 |
| Atrial arrhythmia | 19 (10%) | 14 (11%) | 5 (8%) | 0.681 |
| Myocardial infarction | 9 (5%) | 4 (3%) | 5 (8%) | 0.272 |
| Congestive heart failure (symptomatic) | 15 (8%) | 10 (8%) | 5 (8%) | 0.999 |
| Obstructive sleep apnea | 16 (8%) | 4 (3%) | 12 (18%) | <0.001 |
Age is reported as median (IQR), and all other data are reported as n (%). The p-value for age was obtained by Wilcoxon-Mann-Whitney rank-sum test. For non-age categories, p-values were obtained using a two-sample test of proportion. IQR: interquartile range; PMHx: Past medical history; CKD: chronic kidney disease; COPD: chronic obstructive pulmonary disease; CAD: coronary artery disease.
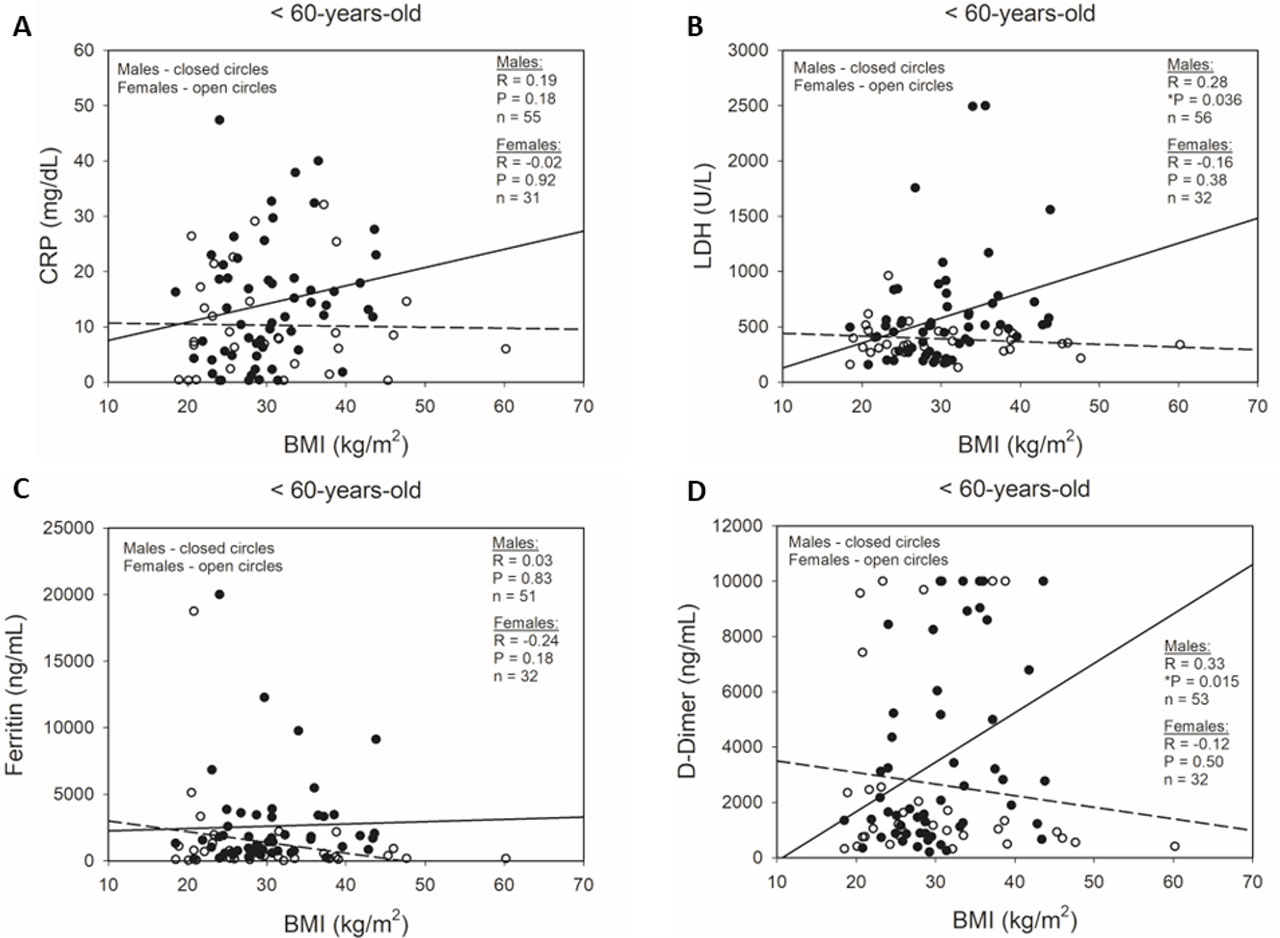
Fig. 2.
Correlations between BMI and inflammatory markers in <60-year-old male and female patients during COVID-19 hospitalization. Simple scatter plots of male and female patients with regression analyses of correlations between BMI and peak inpatient (A) CRP, (B) LDH, (C) ferritin, and (D) D-Dimer. ●: male subjects; ○: female subjects; solid regression line: male subjects; dashed regression line: female subjects. P-values calculated by Pearson Product Moment Correlation. *P<0.05.
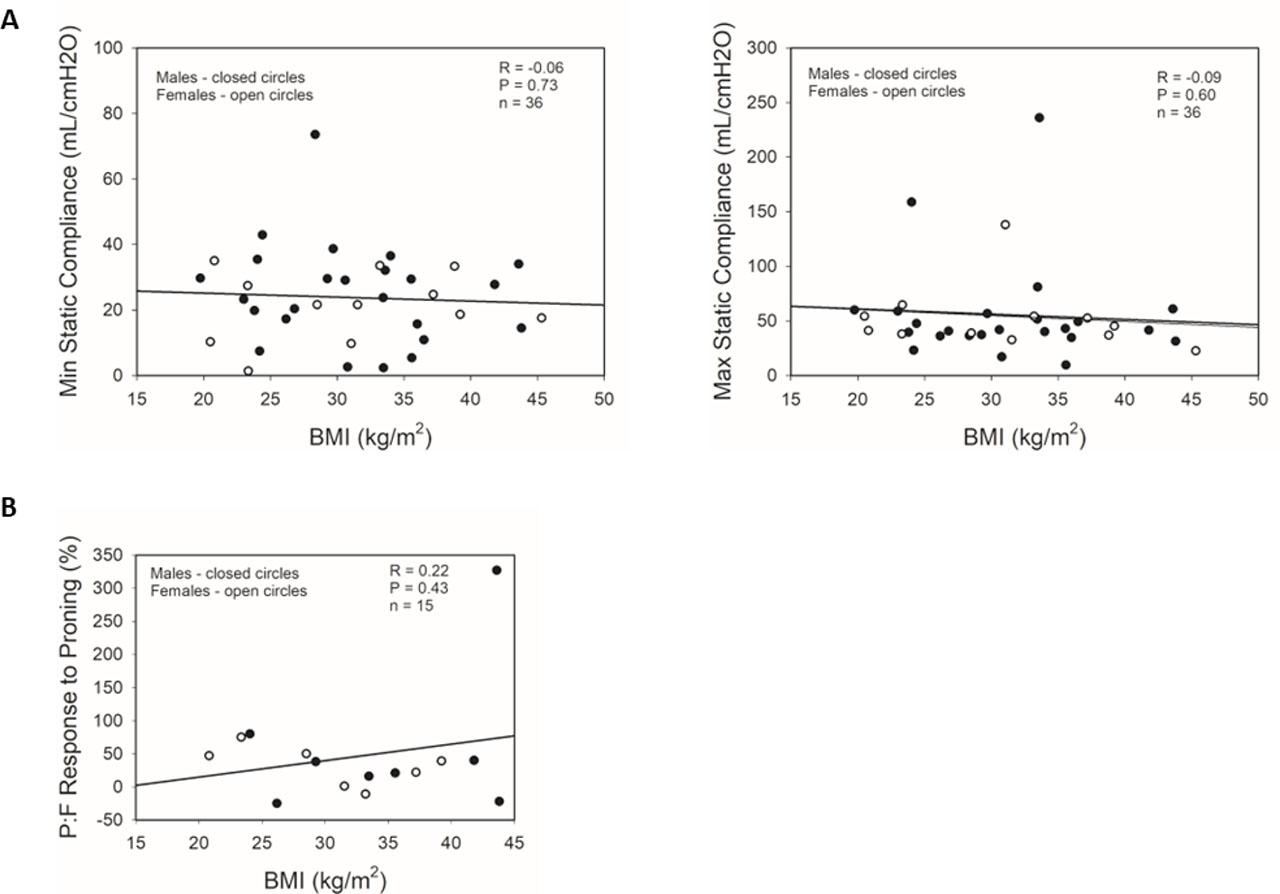
Fig. 3.
Correlations between BMI and respiratory physiology parameters in male and female intubated COVID-19 patients. Simple scatter plots of male and female patients with regression analyses of correlations between BMI and (A) minima and maxima static compliances during IMV, and (B) P:F responses to proning in male and female patients. ●: male subjects; ○: female subjects; regression lines represent combined male and female data. P:F response to proning = (P:F ratio after proning – P:F ratio before proning) / P:F ratio before proning X 100%. P-values calculated by Pearson Product Moment Correlation. IMV: invasive mechanical ventilation; P:F = ratio of partial pressure of arterial oxygen (PaO2): fraction of inspired oxygen (FiO2) of mechanical ventilator.