Fig. 1.
Effect of sarcopenia on High flow oxygen
| Variables | Patients with sarcopenian =54 | Patients without sarcopenia n = 50 | Total n = 104 | p |
|---|---|---|---|---|
| Age, years | 69.1 (+/−1) | 63.9 (+/−13.4) | 66.6(+/−12.4) | 0.032 |
| Male, n (%) | 42 (77.8) | 26 (52) | 68 (65.4) | 0.006 |
| Comorbidities | ||||
| Respiratory, n (%) | 17 (31.5) | 21 (42) | 38 (36.5) | 0.266 |
| Cardiac, n (%) | 19 (35.2) | 25 (50) | 44 (42.3) | 0.127 |
| Renal, n (%) | 3 (5.6) | 4 (8) | 7 (6.7) | 0.619 |
| Diabetes, n (%) | 18 (33.3) | 19 (38) | 37 (35.6) | 0.619 |
| BMI, kg/m2 | 27 (+/− 4.9) | 32.71 (+/−6.7) | 29.8 (+/−6.5) | <0.001 |
| CT-Scan variables | ||||
| Lung damage, n (%): | ||||
| Mild (<25%) | 17 (31.5) | 15 (30) | 32 (30.8) | 0.795 |
| Moderate (25–50%) | 29 (53.7) | 24 (48) | 53 (51) | |
| Severe (50–75%) | 7 (13) | 9 (18) | 16 (15.4) | |
| Very severe (>75%) | 1 (1.9) | 2 (4) | 3 (2.9) | |
| Pulmonary embolism, n (%) | 4 (7.4) | 1 (2) | 5 (4.8) | 0.198 |
| Scores | ||||
| SAPS II | 36.2 (+/−12.8) | 28.8 (+/−9.2) | 32.6 (+/−11.7) | 0.001 |
| SOFA | 3.4 (+/−2.1) | 2.6 (+/−1.7) | 2.9 (+/−1.9) | 0.084 |
| Biological parameters on ICU admission | ||||
| Lymphocytes, G/L | 0.9 (+/−0.9) | 1.1 (+/− 1.4) | 1.0 (+/−1.2) | 0.298 |
| Albumin, g/L | 29.2 (+/−4.9) | 29.5 (+/−3.3) | 29.3(+/−4.4) | 0.859 |
| Outcomes | ||||
| Mortality, n (%) | 6 (11.1) | 4 (8) | 10 (9.6) | 0,421 |
| Pneumonia, n (%) | 1 (1.9) | 1 (2) | 2 (1.9) | 0.733 |
| HFO duration, days | 6.8 (+/−4.4) | 5 (+/− 2.9) | 5.9 (+/−3.8) | 0.005 |
| ICU LOS, days | 8.2 (+/− 5) | 6.3 (+/− 3.1) | 7.3 (+/− 4.3) | 0.019 |
| Hospital LOS, days | 21.8 (+/− 17.6) | 17.1 (+/− 14.2) | 19.3 (+/−16.1) | 0.143 |
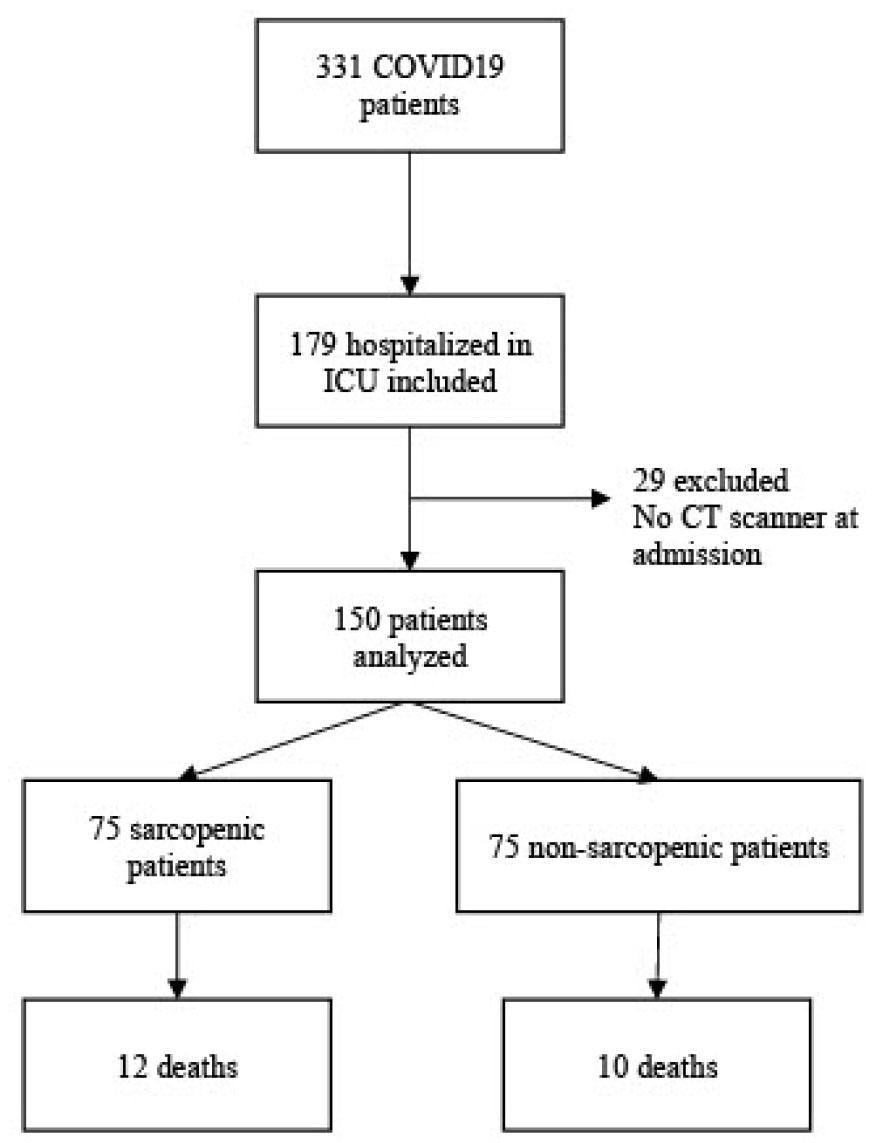
Patients characteristics and outcomes_
| Variables | Patients with sarcopenia n=75 | Patients without sarcopenia n = 75 | Total n = 150 | p |
|---|---|---|---|---|
| Age, years | 69.6 (+/−10) | 64.6 (+/−12.1) | 67.1 (+/−11.4) | 0.006 |
| Male, n (%) | 59 (78) | 41 (41) | 100 (66.7) | 0.002 |
| Comorbidities | ||||
| Respiratory, n (%) | 25 (33) | 26 (34.7) | 51 (34) | 0.863 |
| Cardiac, n (%) | 29 (38.7) | 39 (52) | 68 (45.3) | 0.101 |
| Renal, n (%) | 6 (8) | 10 (13) | 16 (10.7) | 0.290 |
| Diabetes, n (%) | 23 (30.7) | 29 (38.7) | 52 (34.7) | 0.303 |
| Obesity**, n (%) | 19 (26) | 50 (66.7) | 69 (46.6) | <0.001 |
| BMI, kg/m2 | 27.3 (+/−4.7) | 33.1 (+/−6.6) | 30.3 (+/−6.4) | <0.001 |
| CT scan variables | ||||
| Lung damage, n (%): | ||||
| Mild (<25%) | 21 (28) | 21 (28) | 42 (28) | 0.050 |
| Moderate (25–50%) | 42 (56) | 30 (40) | 72 (48) | |
| Severe (>50%) | 12 (16) | 24 (32) | 36 (24) | |
| Pulmonary embolism, n (%) | 5 (6.8) | 1 (1.3) | 6 (4) | 0.102 |
| SMA, cm2 | 70.5 (+/− 16.6) | 93.1 (+/−23.7) | 83.3 (+/−23.8) | <0.001 |
| SMI, cm2/m2 | 23.4 (+/− 4.5) | 32.7 (+/−6.9) | 28.8 (+/−7.5) | <0.001 |
| Scores | ||||
| SAPS II | 36.1 (+/−14.7) | 33.7 (+/−12.1) | 34.9 (+/−13.5) | 0.267 |
| SOFA | 5.4 (+/−8.1) | 3.6 (+/−2.9) | 4.34 (+/−5.8) | 0.089 |
| Biological parameters on ICU admission | ||||
| Lymphocytes, G/L | 0.84 (+/−0.83) | 1.11 (+/− 1.22) | 0.97 (+/−1.04) | 0.112 |
| Albumin, g/L | 27.5 (+/−4.8) | 29 (+/−5.3) | 28.1 (+/−5.1) | 0.266 |
| CRP, mg/L | 144.7 (+/− 116.2) | 119.5 (+/− 89.3) | 131.9 (+/−103.8) | 0.155 |
| D-Dimers, μg/L | 1889.1 (+/−1632.6) | 1291.42 (+/1311.5) | 1598.5 (+/1508.5) | 0.038 |
| Fibrinogen, mmol/L | 6.4 (+/−1.5) | 6.9 (+/−1.6) | 6.5 (+/−1.6) | 0.624 |
| Outcomes | ||||
| Mortality, n (%) | 12 (16) | 10 (13.3) | 22 (14.7) | 0.644 |
| Pneumonia, n (%) | 15 (20) | 22 (29.3) | 37 (24.7) | 0.185 |
| MV, n (%) | 21 (28) | 23 (37.3) | 44 (29.3) | 0.110 |
| HFO duration, days | 5.8 (+/−4.6) | 4.0 (+/− 3) | 4.9 (+/− 4) | 0.005 |
| MV duration, days | 6.9 (+/− 9) | 9.6 (+/− 12.1) | 8.5 (+/−10.9) | 0.233 |
| ICU LOS, days | 12.1 (+/− 9.7) | 13.1 (+/− 12.2) | 12.6 (+/− 11) | 0.575 |
| Hospital LOS, days | 26.9 (+/− 22.8) | 24.6 (+/− 20.6) | 25.8 (+/− 21.7) | 0.509 |
Effect of sarcopenia in obese patients
| Variables | Obese patients with sarcopenia n =19 | Obese patients without sarcopenia n = 50 | Total n = 69 | p |
|---|---|---|---|---|
| Age, years | 69.8 (+/−10.5) | 63.17 (+/−12.8) | 65 (+/−12.5) | 0.048 |
| Male, n (%) | 14 (73.7) | 28 (56) | 32 (60.9) | 0.179 |
| Comorbidities | ||||
| Respiratory, n (%) | 9 (47.4) | 22 (44.0) | 31 (44.9) | 0.802 |
| Cardiac, n (%) | 8 (42.1) | 27 (54) | 35 (50.7) | 0.377 |
| Renal, n (%) | 3 (15.8) | 10 (20) | 13 (18.8) | 0.689 |
| Diabetes, n (%) | 8 (42.1) | 24 (48) | 32 (46.4) | 0.661 |
| BMI, kg/m2 | 33.2 (+/− 4.5) | 36.3 (+/−5.7) | 35.5 (+/−5.6) | 0.036 |
| CT scan variables | ||||
| SMA, cm2 | 66.4 (+/− 12.1) | 99.5 (+/−25) | 90.9 (+/−27.3) | <0.001 |
| SMI, cm2/m2 | 23.0 (+/− 7.6) | 34.9 (+/−7.4) | 31.79 (+/−8.6) | <0.001 |
| Scores | ||||
| SAPS II | 35.8 (+/−17.6) | 34.1 (+/−11.9) | 34.6 (+/−13.6) | 0.652 |
| SOFA | 7.2 (+/−11.6) | 3.8 (+/−2.8) | 4.5 (+/−5.8) | 0.069 |
| Biological parameters at admission | ||||
| Lymphocytes, G/L | 1.00 (+/−1.4) | 1.01 (+/− 0.6) | 1.01 (+/−0.9) | 0.971 |
| Albumin, g/L | 28.8 (+/−6) | 28.7 (+/−6) | 28.8 (+/−6) | 0.94 |
| Outcomes | ||||
| Mortality, n (%) | 4 (21.1) | 5 (10) | 9 (13) | 0.223 |
| Pneumonia, n (%) | 6 (31.6) | 16 (32) | 22 (31.9) | 0.973 |
| MV, n (%) | 7 (36.8) | 18 (36.0) | 25 (36.2) | 0.984 |
| HFO duration, days | 4.6 (+/−3.3) | 3.6 (+/− 2.7) | 3.9 (+/−2.9) | 0.207 |
| MV duration, days | 8.0 (+/− 8.1) | 11.8 (+/− 13.5) | 10.8 (+/−12.4) | 0.367 |
| ICU LOS, days | 12.5 (+/− 8.7) | 14.7 (+/− 14.2) | 14.1 (+/− 12.9) | 0.518 |
| Hospital LOS, days | 263.8 (+/− 22.4) | 25.5 (+/− 21.3) | 25.1 (+/− 21.5) | 0.768 |
Effect of mechanical ventilation at admission
| Variables | Mechanical ventilation on admission n =13 | No mechanical ventilation on admission n = 137 | Total n = 150 | p |
|---|---|---|---|---|
| Age, years | 67.1 (+/−11.4) | 67.13 (+/−11.4) | 67.13(+/−11.3) | 0.998 |
| Male, n (%) | 6 (46.2) | 94 (68.6) | 100 (66.7) | 0.101 |
| Comorbidities | ||||
| Respiratory, n (%) | 3 (23.1) | 48 (35) | 51 (34) | 0.294 |
| Cardiac, n (%) | 6 (46.2) | 62 (45.3) | 68 (45.3) | 0.950 |
| Renal, n (%) | 1 (7.7) | 15 (10.9) | 16 (10.7) | 0.584 |
| Diabetes, n (%) | 5 (30.8) | 48 (35) | 52 (34.7) | 0.509 |
| Sarcopenia, n (%) | 4 (30.8) | 71 (51.8) | 75 (50) | 0.123 |
| BMI, kg/m2 | 33.1(+/− 8) | 30.0 (+/−6.2) | 30.3 (+/−6.4) | 0.101 |
| CT-Scan variables | ||||
| Lung damage, n(%): | ||||
| Mild (<25%) | 3 (23.1) | 39 (28.5) | 42 (28) | 0.062 |
| Moderate (25–50%) | 3 (23.1) | 69 (50.4) | 72 (48) | |
| Severe (50–75%) | 6 (46.2) | 24 (17.5) | 30 (20) | |
| Very severe (>75%) | 1 (7.7) | 5 (3.6) | 6 (4) | |
| Pulmonary embolism, n (%) | 0 (0) | 6 (4.4) | 6 (4) | 0.573 |
| Scores | ||||
| SAPS II | 46.8 (+/−18.7) | 33.8 (+/−12.1) | 34.9 (+/−13.5) | 0.001 |
| SOFA | 6.0 (+/−4.2) | 4.2 (+/−6) | 4.3 (+/−5.8) | 0.276 |
| Biological parameters at admission | ||||
| Lymphocytes, G/L | 0.96 (+/−0.8) | 0.97 (+/− 1.1) | 0.97 (+/−1.1) | 0.968 |
| Albumin, g/L | 28.8 (+/−8.1) | 28.0 (+/−4.5) | 28.1 (+/−5.1) | 0.670 |
| Outcomes | ||||
| Mortality, n (%) | 3 (23.1) | 19 (13.9) | 22 (14.7) | 0.292 |
| Pneumonia, n (%) | 11 (84.6) | 26 (19) | 37 (24.7) | <0.001 |
| MV duration, days | 19.0 (+/− 9.6) | 6.8 (+/− 10.2) | 8.5 (+/−10.9) | <0.001 |
| ICU LOS, days | 23.7 (+/− 13.28) | 11.5 (+/− 10.2) | 12.6 (+/− 11.0) | 0.001 |
| Hospital LOS, days | 34.0 (+/− 20.4) | 25.0 (+/− 21.7) | 25.8 (+/− 21.7) | 0.154 |