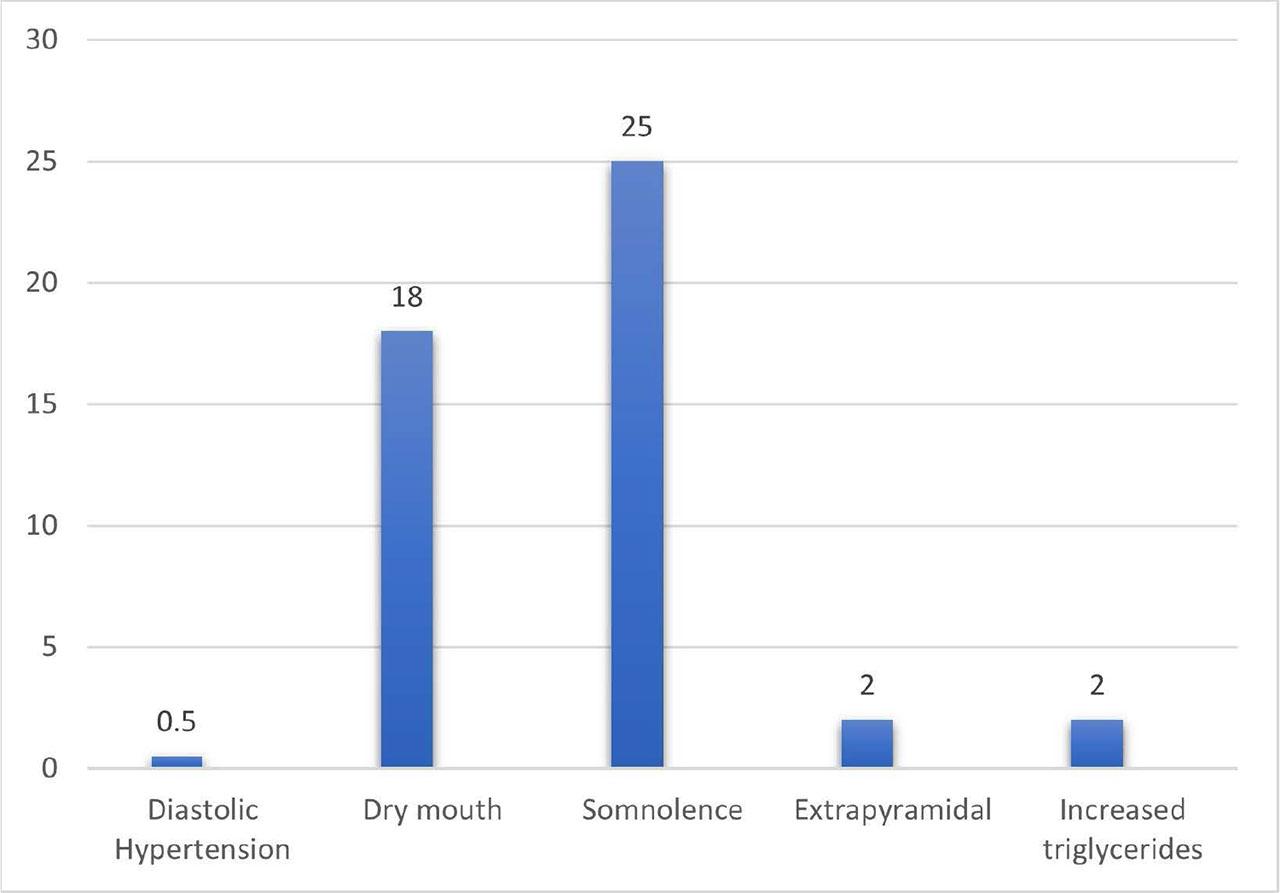
Fig. 1.
Demographics and clinical parameters of patients among the two groups
| Group Q | Group C | P value | |
|---|---|---|---|
| Age [mean ± SD] | 68.7 ± 7.6 | 71.2 ± 5.7 | 0.02 |
| Gender [n (%)] | |||
| Male | 19 (42%) | 15 (33%) | 0.38 |
| Female | 26 (58%) | 30 (67%) | |
| Co-morbidities [n (%)] | |||
| Respiratory diseases | 4 (9%) | 5 (11%) | 0.5 |
| Metabolic diseases | 2 (5%) | 8 (18%) | |
| Cardiac diseases | 16 (36%) | 17 (37%) | |
| Neurological diseases | 2 (4%) | 0 (0%) | |
| Multiple | 20 (44%) | 15 (34%) | |
| qSOFA Score [median (IQR)] | 3 (1–6) | 3 (1–4) | 0.0001 |
| Length of hospital stay [median (IQR)] | 15 (10–19) | 10 (5–14) | 0.001 |
Intensive care delirium screening checklist (ICDSC)
| Main item | Subitem |
|---|---|
| 1. Altered level of consciousness: | A: No response |
| B: Response to intense and repeated stimulation | |
| C: Response to mild or moderate stimulation | |
| D: Normal wakefulness | |
| E: Exaggerated response to normal stimulation | |
| 2. Inattentiveness: | Difficulty following instructions or easily distracted |
| 3. Disorientation To time, place, or person | |
| 4. Hallucination-delusion-psychosis: | Clinical manifestation or suggestive behavior |
| 5. Psychomotor agitation or retardation: | Agitation requiring use of drugs or restraints, or slowing |
| 6. Inappropriate speech or mood: | Related to events or situation, or incoherent speech |
| 7. Sleep/wake cycle disturbance: | Sleeping < 4hrs day, walking all the night, sleeping all day |
| 8. Symptom fluctuation Symptoms above occurring intermittently | |
Risk factors for ICU delirium among the two groups
| Group Q | Group C | P value | |
|---|---|---|---|
| Immobilization [n (%)] | 37 (82%) | 21 (47%) | 0.0004 |
| Urinary catheter [n (%)] | 33 (73%) | 26 (58%) | 0.12 |
| Infection [n (%)] | 37 (82%) | 19 (42%) | 0.0001 |
| Visual Impairment [n (%)] | 8 (18%) | 23 (51%) | 0.0008 |
| Auditory impairment [n (%)] | 11 (24%) | 17 (38%) | 0.17 |
| Hemoglobin [gm/dl, mean ± SD] | 9.7 ± 1.8 | 9.6 ± 1.5 | 0.13 |
| Analgesic & Sedative [n (%)] | 17 (38%) | 16 (36%) | 0.83 |
| Shocked [n (%)] | 8 (18%) | 9 (20%) | 0.78 |
| Intubated [n (%)] | 2 (4%) | 0 (0%) | 0.25 |
| Metabolic abnormalities [n (%)] | 40 (89%) | 34 (76%) | 0.09 |
Comparison between the cases presented with delirium among the two groups
| Group Q | Group C | P value | ||
|---|---|---|---|---|
| Delirium | No | 34 (75%) | 23 (51%) | 0.01 |
| Hypoactive | 9 (20%) | 5 (11%) | ||
| Hyperactive | 2 (5%) | 17(38%) | ||
CAM-ICU-7 and ICDSE scores among the two groups
| Group Q | Group C | P value | |||||
|---|---|---|---|---|---|---|---|
| Min | Max | Median (IQR) | Min | Max | Median (IQR) | ||
| CAM-ICU-7 | 0 | 7 | 2 (0–3) | 0 | 7 | 2 (0–6) | 0.37 |
| ICDSC | 0 | 7 | 0 (0–2) | 0 | 7 | 0 (0–4) | 0.06 |