
Table 1
Patient characteristics according to treatment groups.
| Patient characteristics | Dexmedetomidine (n=45) | Haloperidol (n=45) | P value |
|---|---|---|---|
| Age (years) (mean±SD) | 77.2±9.0 | 73.2±15.8 | 0.14 |
| Sex (male%) | 48.9 | 51.1 | 0.84 |
| BMI (kg/m2) (mean±SD) | 28.0±6.6 | 28.0±6.9 | 0.95 |
| APACHE II (mean±SD) | 32.8±5.3 | 32.0±7.0 | 0.58 |
| GCS (mean±SD) | 9.1±2.2 | 9.4±1.3 | 0.48 |
| Hospitalization period (day) (median±SD) | 16±13 | 21±34 | 0.016* |
| Time to delirium (hour) (median±SD) | 48±197 | 120±146 | 0.27 |
| Ventilator duration (day) (median±SD) | 14±13.4 | 21±34.7 | 0.013* |
| Drug infusion time (hour) (median±SD) | 108±95.2 | 126±75.5 | 0.94 |
| Total amount of drug (mg) (median±SD) | 3.8±1.6 | 150±107.4 | <0.001* |
| In-hospital mortality (%) | 48.9 | 57.8 | 0.4 |
| Pre-infusion SBP (mmHg) (mean±SD) | 117.5±23.4 | 137.5±24.4 | <0.001* |
| Pre-infusion HR (bpm) (mean±SD) | 98.5±25.6 | 97.5±19.7 | 0.83 |
| Pre-infusion SpO2 (mean±SD) | 96.2±2.2 | 97.2±2.3 | 0.04* |
| Pre-infusion Ramsay SS (median±SD) | 1.3±0.8 | 1.5±1.0 | 0.26 |
| Pre-infusion RASS score (median±SD) | 2.45±1.45 | 1.96±2.2 | 0.18 |
| Pre-infusion QT interval (ms) (mean±SD) | 360.5±81.7 | 363.2±51.1 | 0.85 |
| Pre-infusion QTc interval (ms) (mean±SD) | 409.4±63.1 | 427.3±45.8 | 0.99 |
[i] APACHE: Acute Physiology and Chronic Health Evaluation, BMI: Body mass index, bpm: Beats per minute, GCS: Glasgow Coma Score, HR: Heart rate, QTc: Corrected QT, RASS: Richmond Agitation-Sedation Scale, SBP: Systolic blood pressure, SD: Standard deviation, SpO2: Pulse oximeter oxygen saturation, SS: Sedation scale
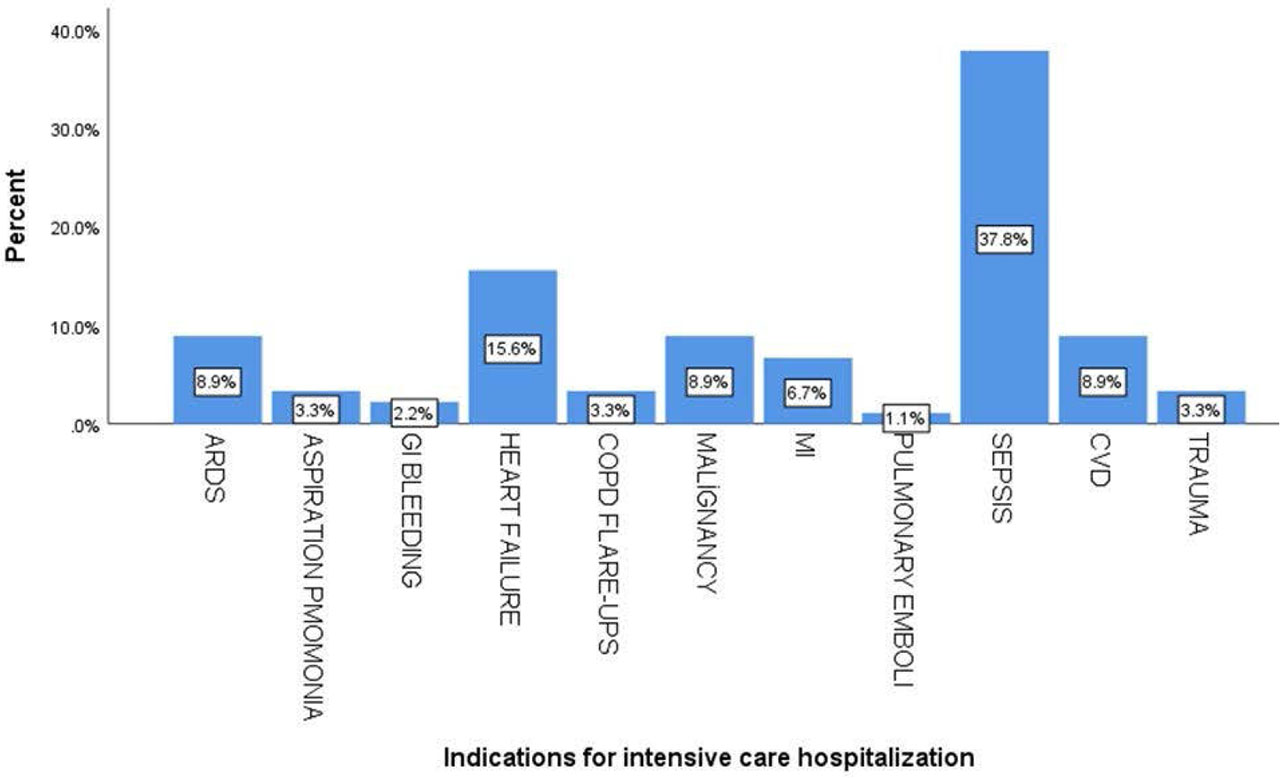
Fig. 1
Indications for hospitalization in the intensive care unit.
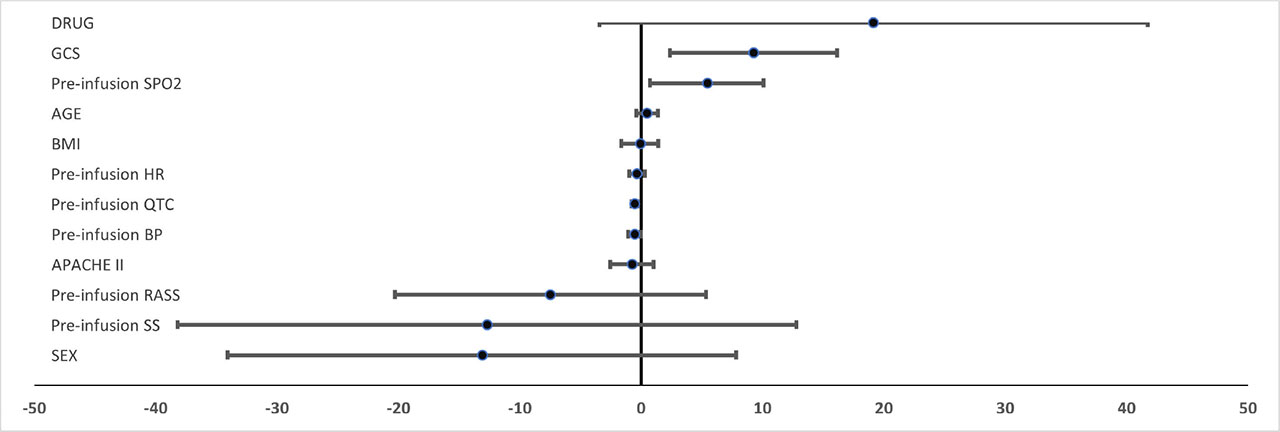
Fig. 2
Forest plot graph of the relationship between baseline characteristics of patients and QTc prolongation after drug infusions.
Table 2.
Blood pressure, heart rate, oxygen saturation, sedation depth, and QT interval before and after haloperidol and dexmedetomidine treatment.
| Patient characteristics | Dexmedetomidine (n=45) | Haloperidol (n=45) | ||||
|---|---|---|---|---|---|---|
| Pre-infusion | Post-infusion | P value | Pre-infusion | Post-infusion | P value | |
| Systolic blood pressure (mmHg) | 117.6±3.4 | 113.2±27.2 | 0.345 | 137.5±24.4 | 117.4±26.0 | <0.001* |
| Heart rate (bpm) | 98.5±25.7 | 100.4±23.1 | 0.664 | 97.5±19.7 | 88.5±27.8 | 0.014* |
| Pulse oximeter oxygen saturation (SpO2) (%) | 96.2±2.2 | 96.9±2.3 | 0.004* | 97.2±2.3 | 97.0±2.2 | 0.585 |
| Ramsay Sedation scale | 1.3±0.8 | 1.4±0.6 | 0.204 | 1.5±1.0 | 1.8±1.0 | 0.015* |
| RASS | 2.5±1.5 | 1.2±1.2 | <0.001* | 2.0±2.2 | 0.40±1.5 | <0.001* |
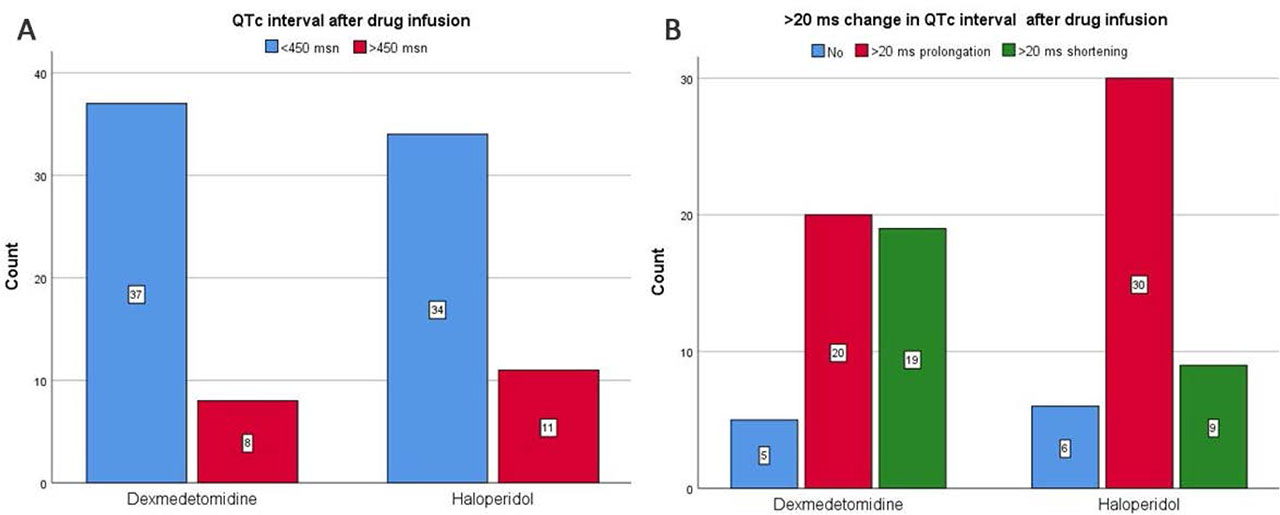
Fig. 3.
A Patients with QTc interval above 450 msec after drug infusions, B: Patients with >20 msec prolongation in QTc interval after drug infusions.
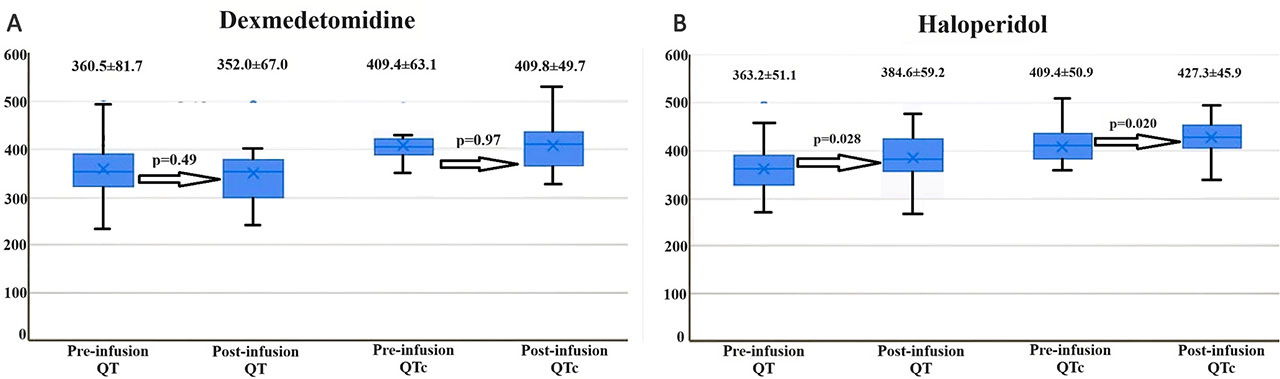
Fig. 4
The effect of dexmedetomidine (A) and haloperidol (B) treatment on QT and QTc interval in box plot graph.