
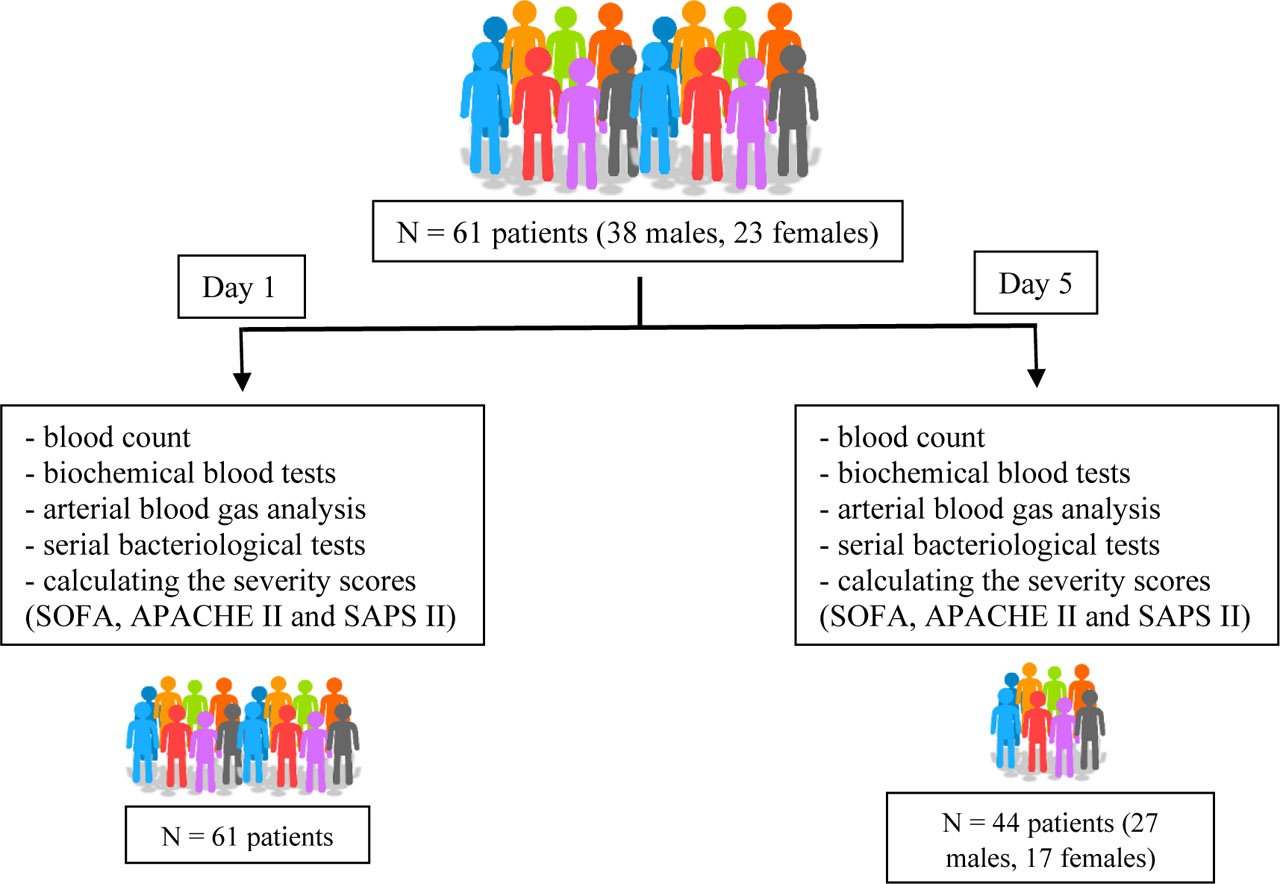
Fig. 1.
Visual description of the study (N – number of patients; SOFA - Sequential Organ Failure Assessment; APACHE II - Acute Physiology and Chronic Health Evaluation II; SAPS II - Simplified Acute Physiology Score II)
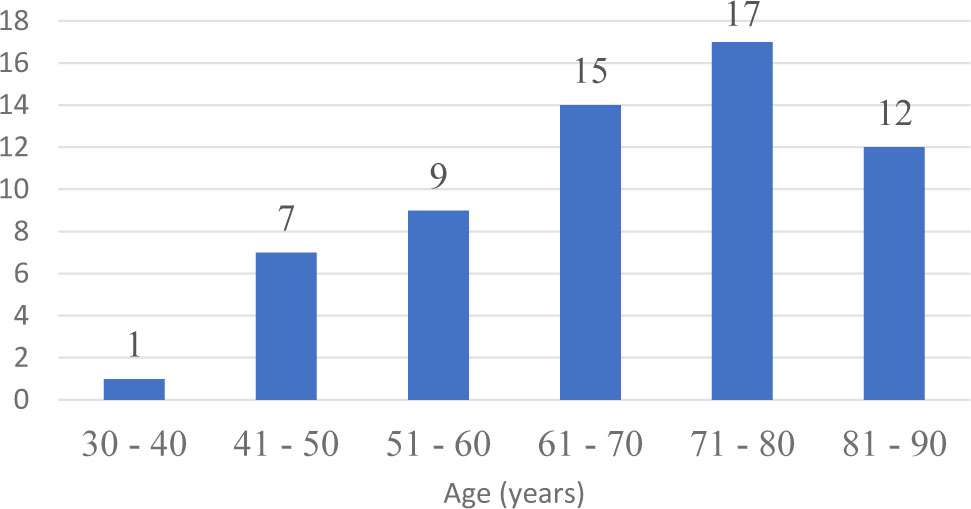
Figure 2.
Distribution by age
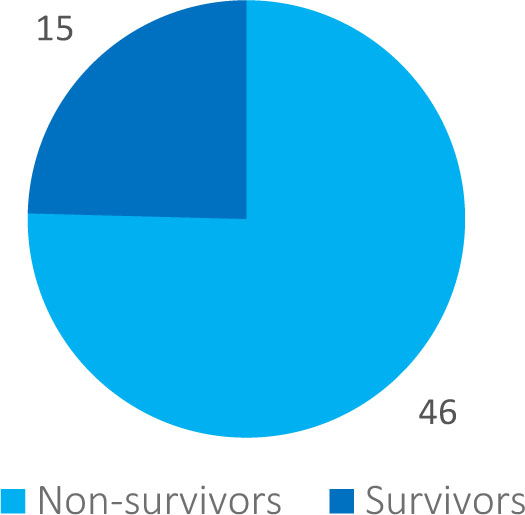
Figure 3.
Distribution by mortality
Table 1.
Descriptive statistics on D1
| SOFA | APACHE II (points) | SAPS II (points) | NLR | COHb | |
|---|---|---|---|---|---|
| Minimum | 1.000 | 7.000 | 17.00 | 0.7420 | 0.000 |
| 25% Percentile | 6.000 | 14.00 | 34.50 | 8.236 | 0.4250 |
| Median | 9.000 | 22.00 | 56.00 | 14.14 | 1.100 |
| 75% Percentile | 13.00 | 30.00 | 72.00 | 25.01 | 1.500 |
| Maximum | 19.00 | 44.00 | 118.0 | 59.67 | 2.500 |
| Range | 18.00 | 37.00 | 101.0 | 58.93 | 2.500 |
| Mean | 9.459 | 22.30 | 54.61 | 17.06 | 1.080 |
| Std.Deviation | 4.700 | 9.426 | 21.84 | 11.76 | 0.6356 |
| Std. Error of Mean | 0.6017 | 1.207 | 2.796 | 1.505 | 0.08206 |
[i] SOFA – Sequential Organ Failure Assessment; APACHE II – Acute Physiology and Chronic Health Evaluation II; SAPS II – Simplified Acute Physiology Score II; NLR – Neutrophil-Lymphocytes Ratio; COHb – Carboxyhaemoglobin; D1 – day 1
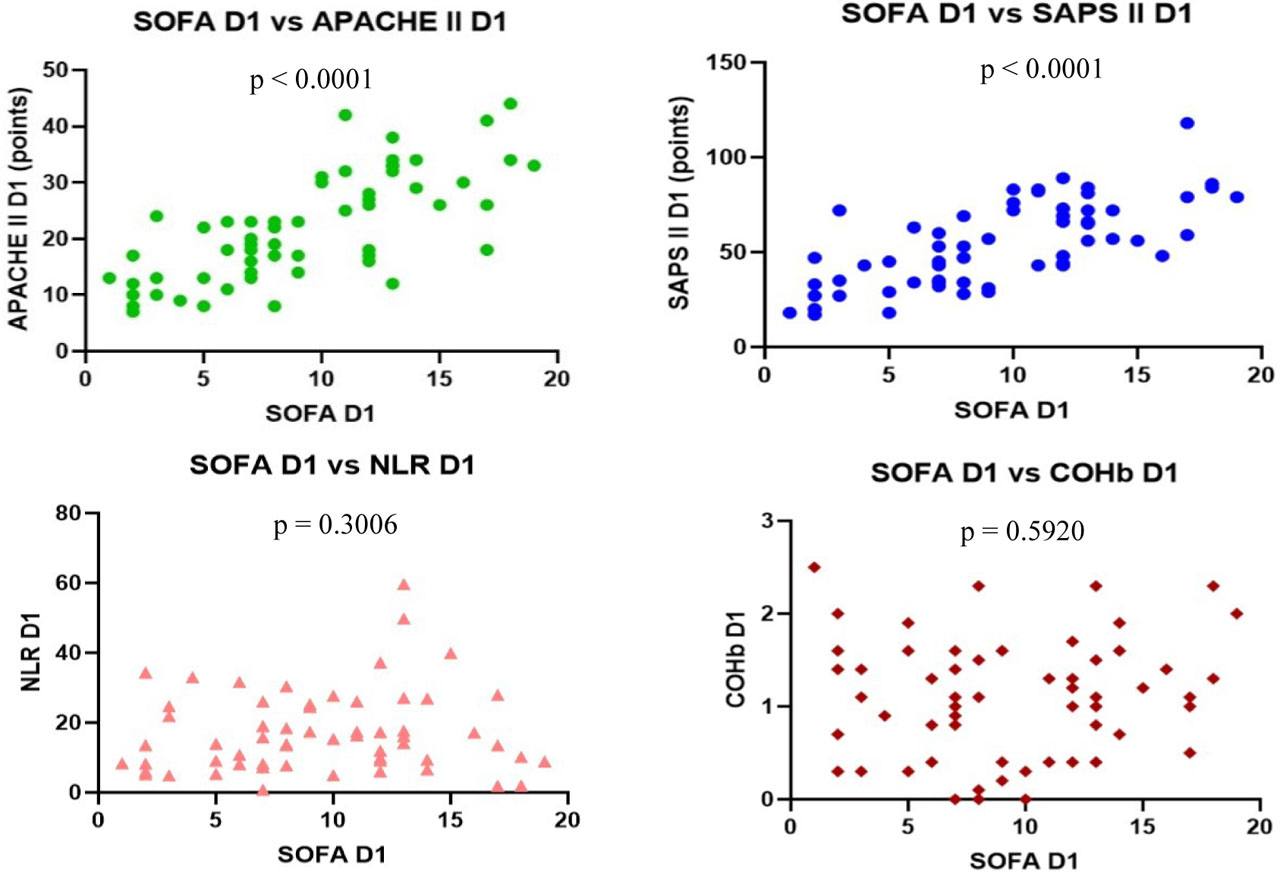
Fig. 4.
Positive correlation between SOFA vs. APACHE II and SOFA vs. SAPS II. No correlation between SOFA vs. NLR and SOFA vs. COHb levels on D1 (SOFA – Sequential Organ Failure Assessment; APACHE II – Acute Physiology and Chronic Health Evaluation II; SAPS II – Simplified Acute Physiology Score II; NLR – Neutrophil-Lymphocytes Ratio; COHb – Carboxyhaemoglobin; D1 – day 1)
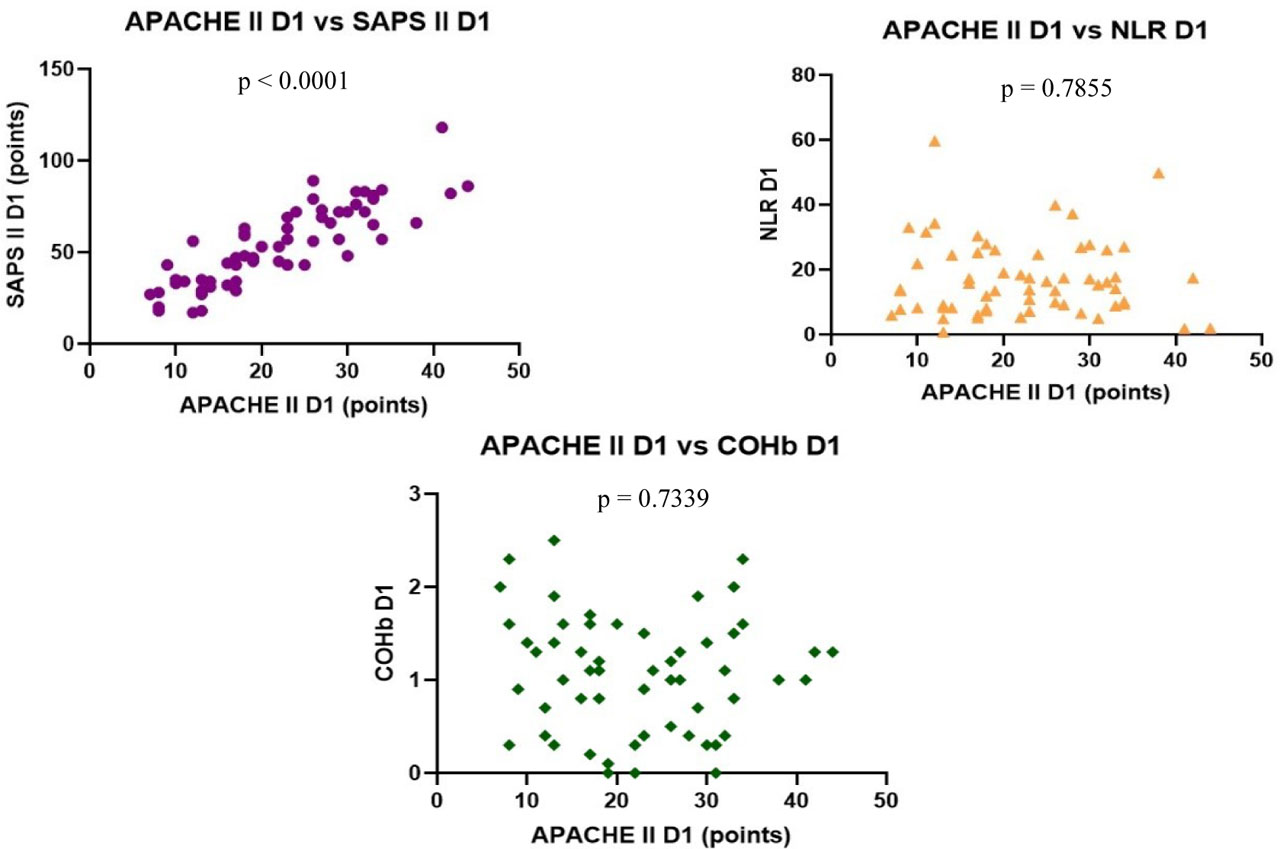
Fig. 5.
Positive correlation between APACHE II vs. SAPS II. No correlation between APACHE II vs. NLR, APACHE II vs. COHb levels on D1 (APACHE II – Acute Physiology and Chronic Health Evaluation II; SAPS II – Simplified Acute Physiology Score II; NLR – Neutrophil-Lymphocytes Ratio; COHb – Carboxyhaemoglobin; D1 – day 1)
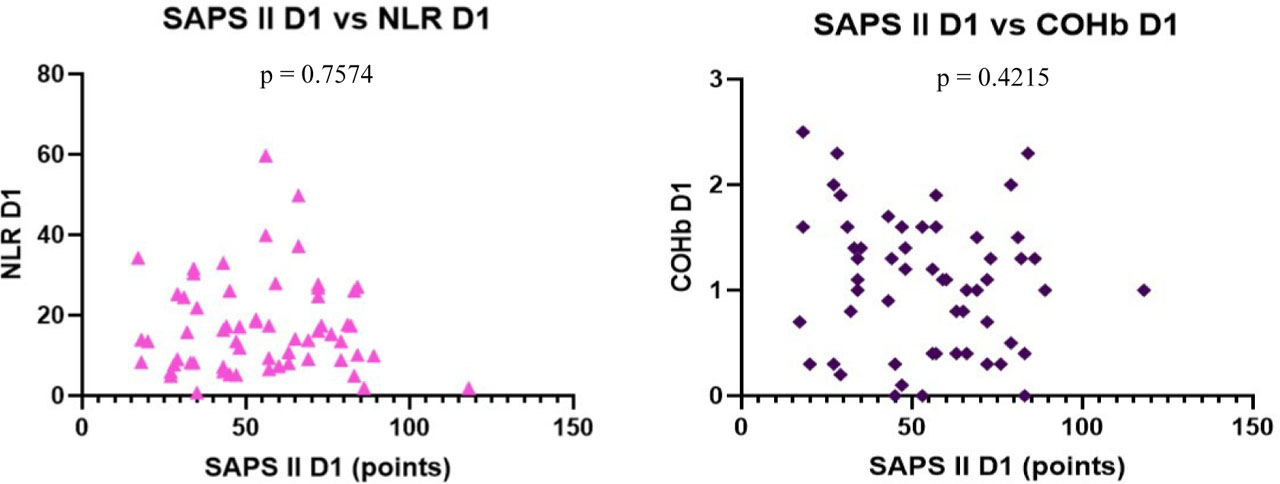
Fig. 6.
No correlation between SAPS II vs. NLR, SAPS II vs. COHb levels on D1 (SAPS II – Simplified Acute Physiology Score II; NLR – Neutrophil-Lymphocytes Ratio; COHb – Carboxyhaemoglobin; D1 – day 1)
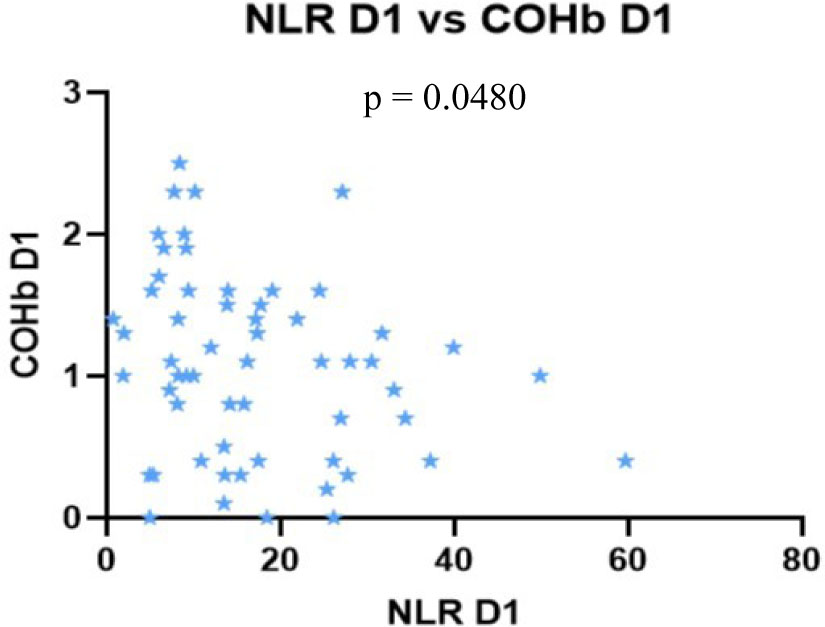
Fig. 7.
Negative correlation between NLR vs. COHb on D1 (NLR – Neutrophil-Lymphocytes Ratio; COHb – Carboxyhaemoglobin; D1 – day 1)
Table 2.
Descriptive statistics on D5
| SOFA | APACHE II (points) | SAPS II (points) | NLR | COHb | |
|---|---|---|---|---|---|
| Minimum | 0.000 | 5.000 | 15.00 | 0.7860 | 0.000 |
| 25% Percentile | 2.000 | 11.00 | 29.00 | 5.422 | 0.600 |
| Median | 7.000 | 18.00 | 46.00 | 9.005 | 1.000 |
| 75% Percentile | 12.00 | 27.00 | 61.00 | 17.87 | 1.500 |
| Maximum | 19.00 | 34.00 | 85.00 | 46.75 | 17.00 |
| Range | 19.00 | 29.00 | 70.00 | 45.96 | 17.00 |
| Mean | 7.359 | 18.74 | 45.36 | 13.03 | 1.471 |
| Std. Deviation | 5.334 | 9.318 | 20.40 | 10.84 | 2.550 |
| Std. Error of Mean | 0.8541 | 1.492 | 3.267 | 1.714 | 0.3982 |
[i] SOFA – Sequential Organ Failure Assessment; APACHE II – Acute Physiology and Chronic Health Evaluation II; SAPS II – Simplified Acute Physiology Score II; NLR – Neutrophil-Lymphocytes Ratio; COHb – Carboxyhaemoglobin; D5 – day 5
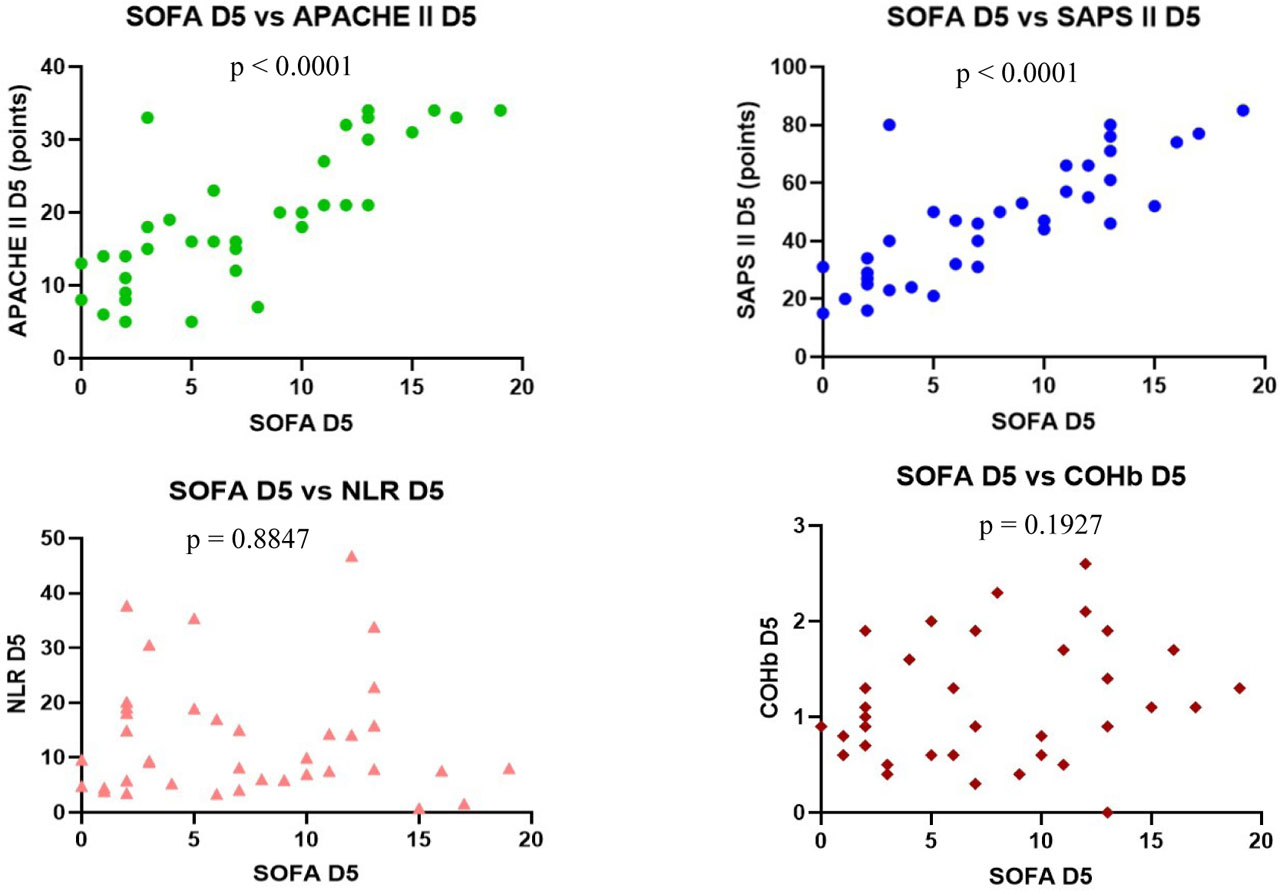
Fig. 8.
Positive correlation between SOFA vs. APACHE II, SOFA vs. SAPS II. No correlation between SOFA vs. NLR and SOFA vs. COHb levels on D5 (SOFA – Sequential Organ Failure Assessment; APACHE II – Acute Physiology and Chronic Health Evaluation II; SAPS II – Simplified Acute Physiology Score II; NLR – Neutrophil-Lymphocytes Ratio; COHb – Carboxyhaemoglobin; D5 – day 5)
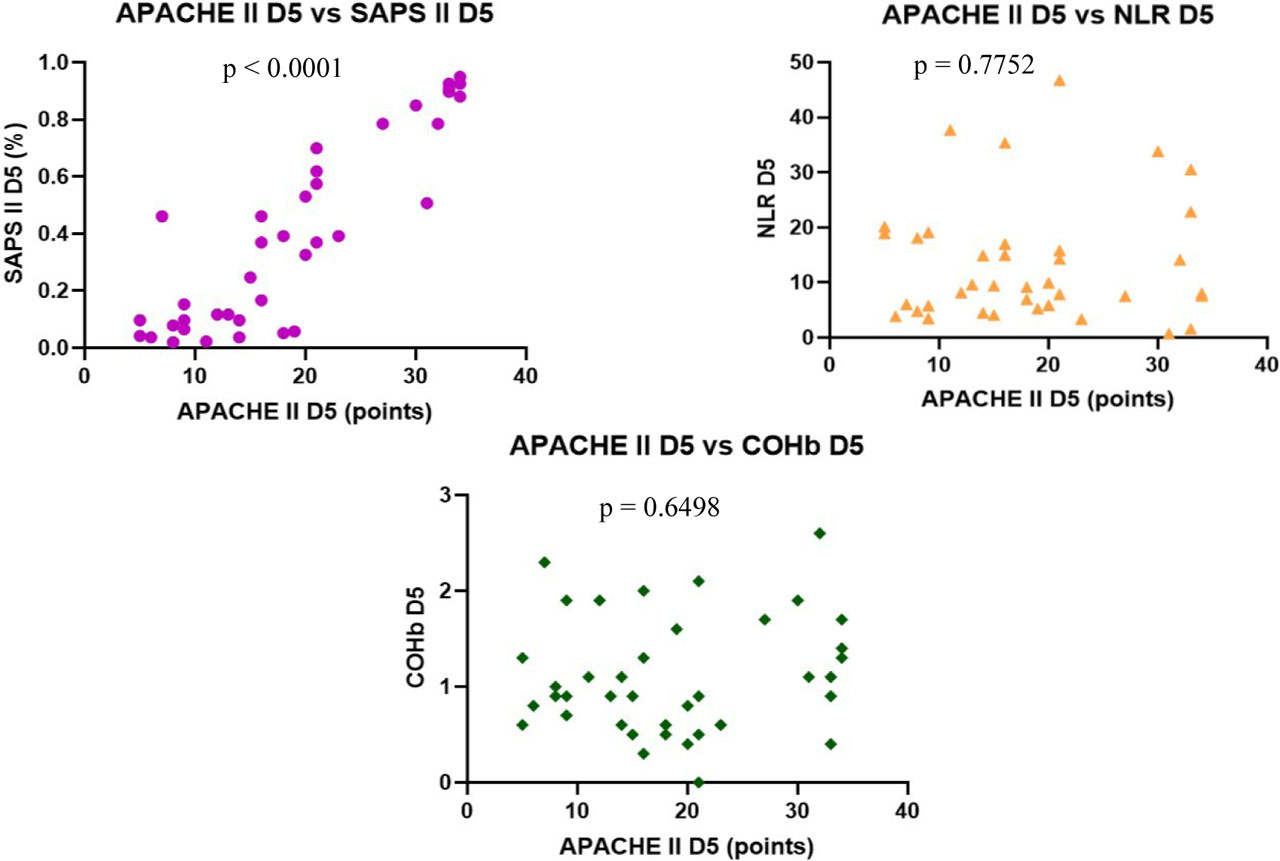
Fig. 9.
Positive correlation between APACHE II vs. SAPS II. No correlation between APACHE II vs. NLR, APACHE II vs. COHb levels on D5 (APACHE II – Acute Physiology and Chronic Health Evaluation II; SAPS II – Simplified Acute Physiology Score II; NLR – Neutrophil-Lymphocytes Ratio; COHb – Carboxyhaemoglobin; D5 – day 5)
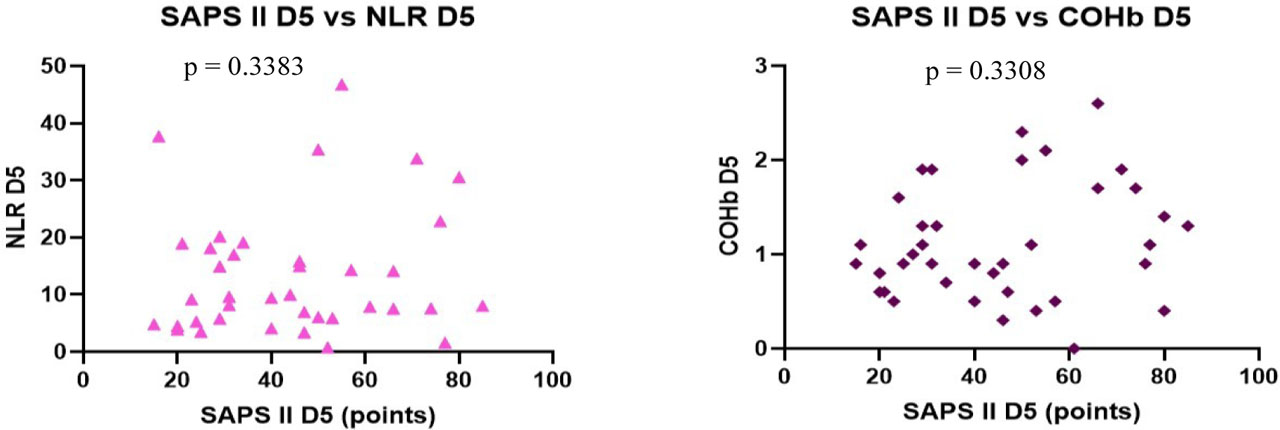
Fig. 10.
No correlation between SAPS II vs. NLR, SAPS II vs. COHb levels on D5 (SAPS II – Simplified Acute Physiology Score II; NLR – Neutrophil-Lymphocytes Ratio; COHb – Carboxyhaemoglobin; D5 – day 5)
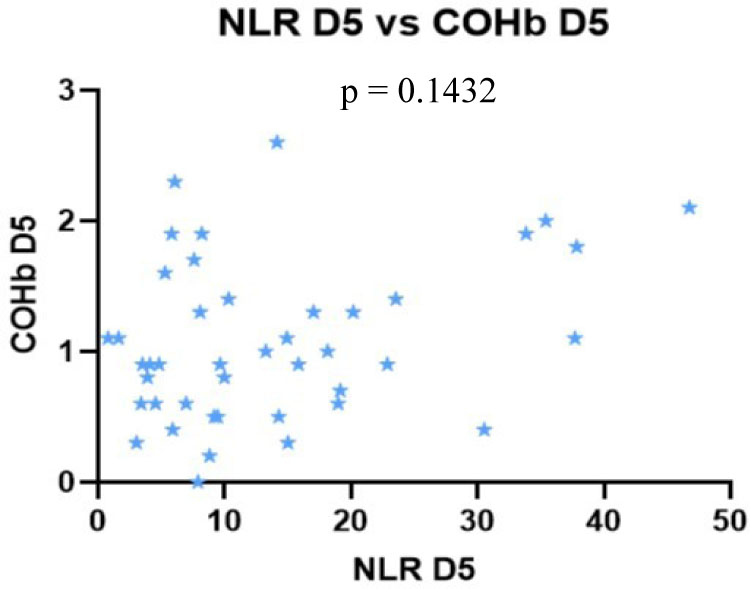
Fig. 11.
No correlation between NLR vs. COHb on D5 (NLR – Neutrophil-Lymphocytes Ratio; COHb – Carboxyhaemoglobin; D5 – day 5)
Table 3.
Predictability of mortality by NLR and COHb variation from D1 to D5 of survivors and non-survivors
| Survivors (n = 15) | Non-survivors (n = 46) | |
|---|---|---|
| NLRD1 ↓ D5 and COHb D1 ↓ D5 | 11 | 9 |
| NLRD1 ↓ D5 and COHb D1 ↑ D5 | 1 | 14 |
| NLRD1 ↑ D5 and COHb D1 ↑ D5 | 2 | 3 |
| NLRD1 ↑ D5 and COHb D1 ↓ D5 | 0 | 4 |
| NLR only on D1 and COHb only on D1 | 1 | 16 |
[i] NLR – Neutrophil-Lymphocytes Ratio; COHb – Carboxyhaemoglobin; D1 – day 1; D5 – day 5
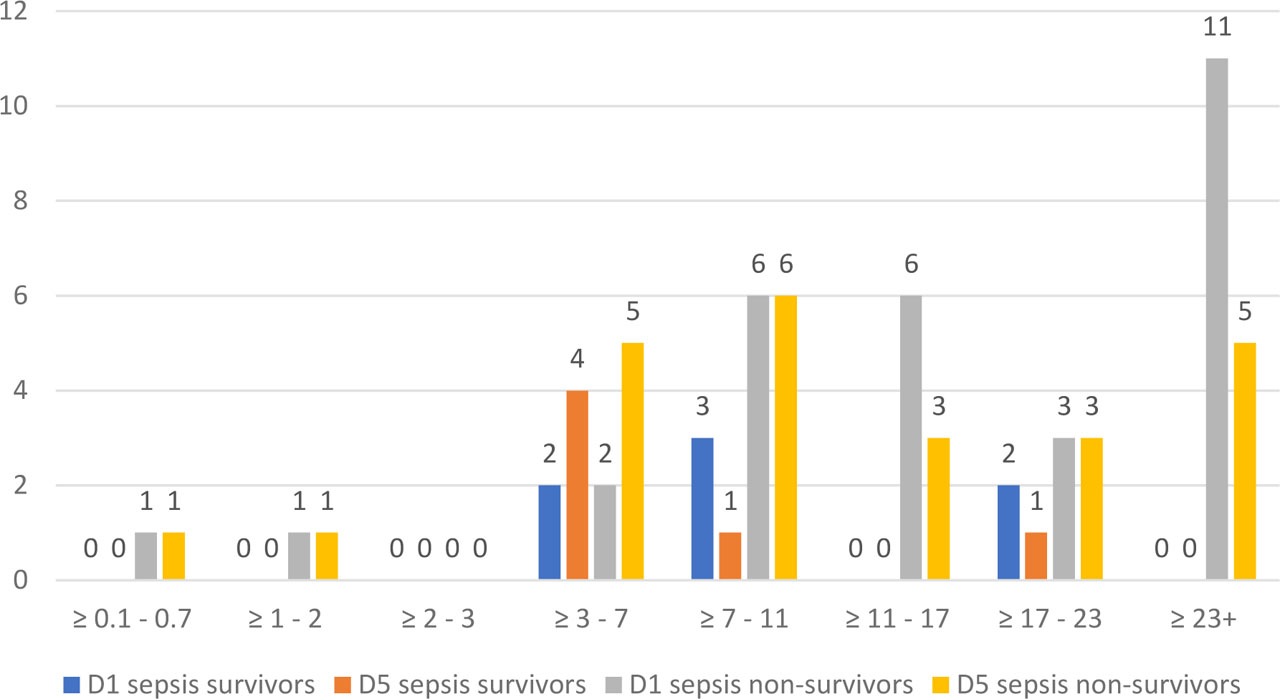
Fig. 12.
Evolution of NLR on D1 and D5 in sepsis survivors and non-survivors (NLR – Neutrophil-Lymphocytes Ratio; D1 – day 1; D5 – day 5)
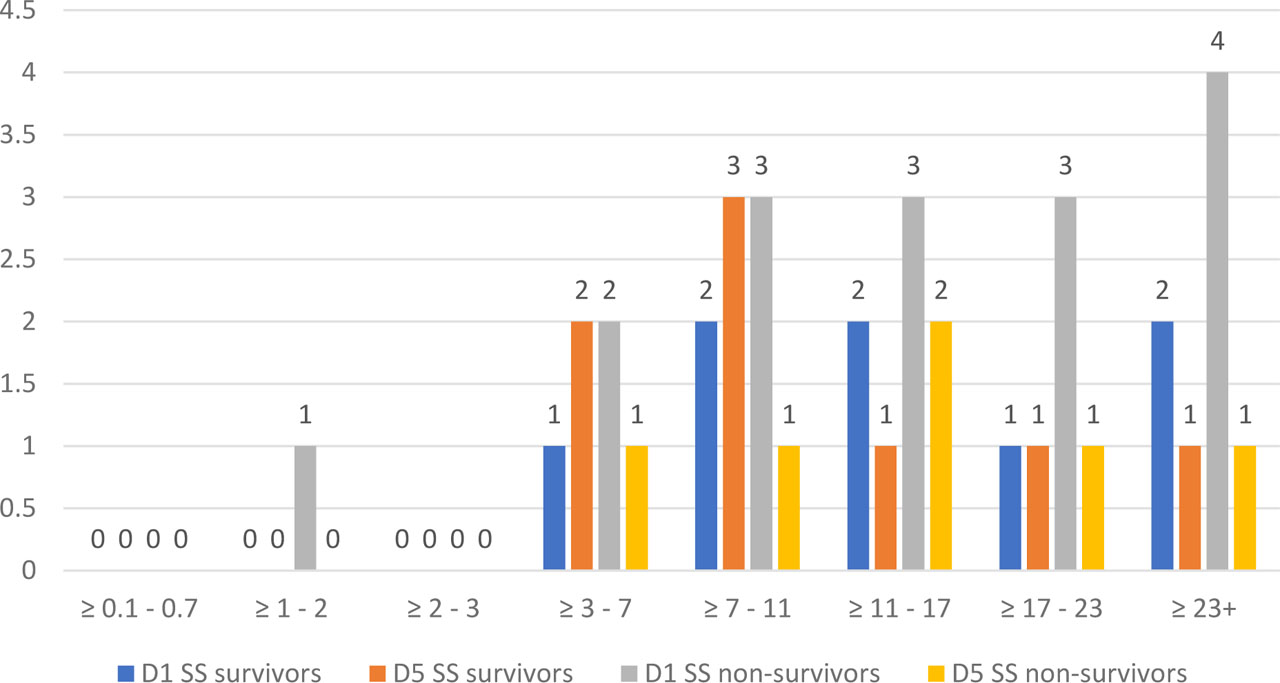
Fig. 13.
Evolution of NLR on D1 and D5 in septic shock survivors and non-survivors (NLR – Neutrophil-Lymphocytes Ratio; SS – septic shock; D1 – day 1; D5 – day 5)
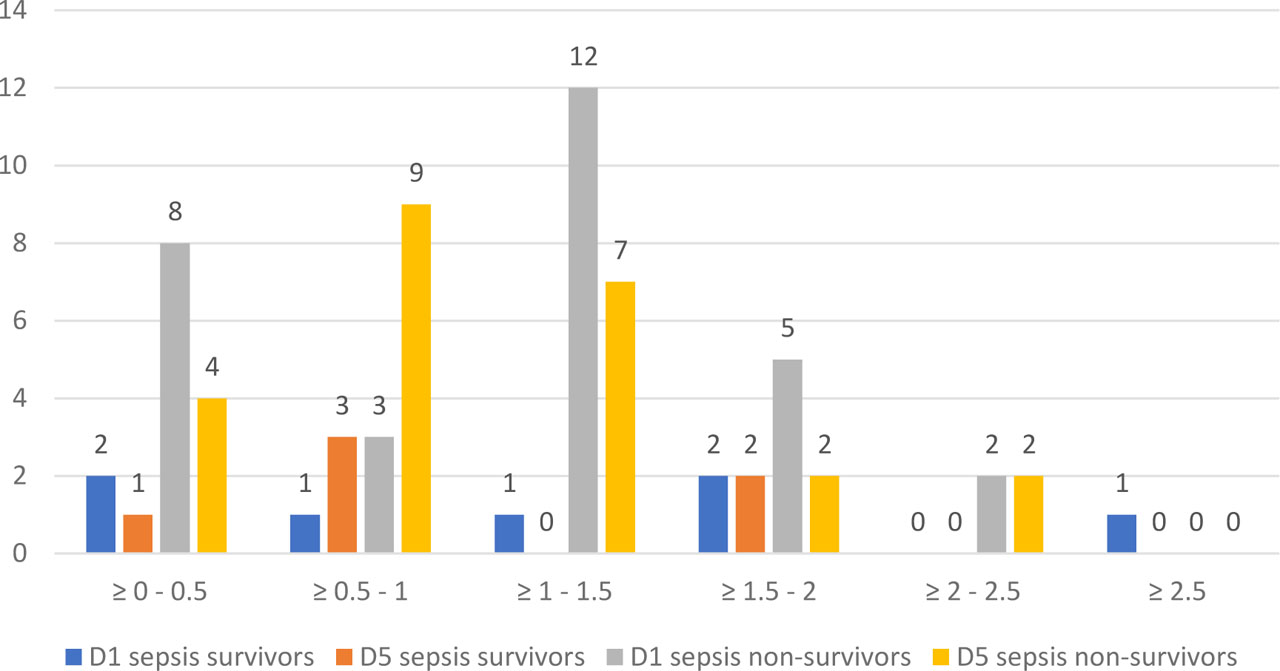
Fig. 14.
Evolution of COHb (%) on D1 and D5 in sepsis survivors and non-survivors (COHb – Carboxyhaemoglobin; D1 – day 1; D5 – day 5)
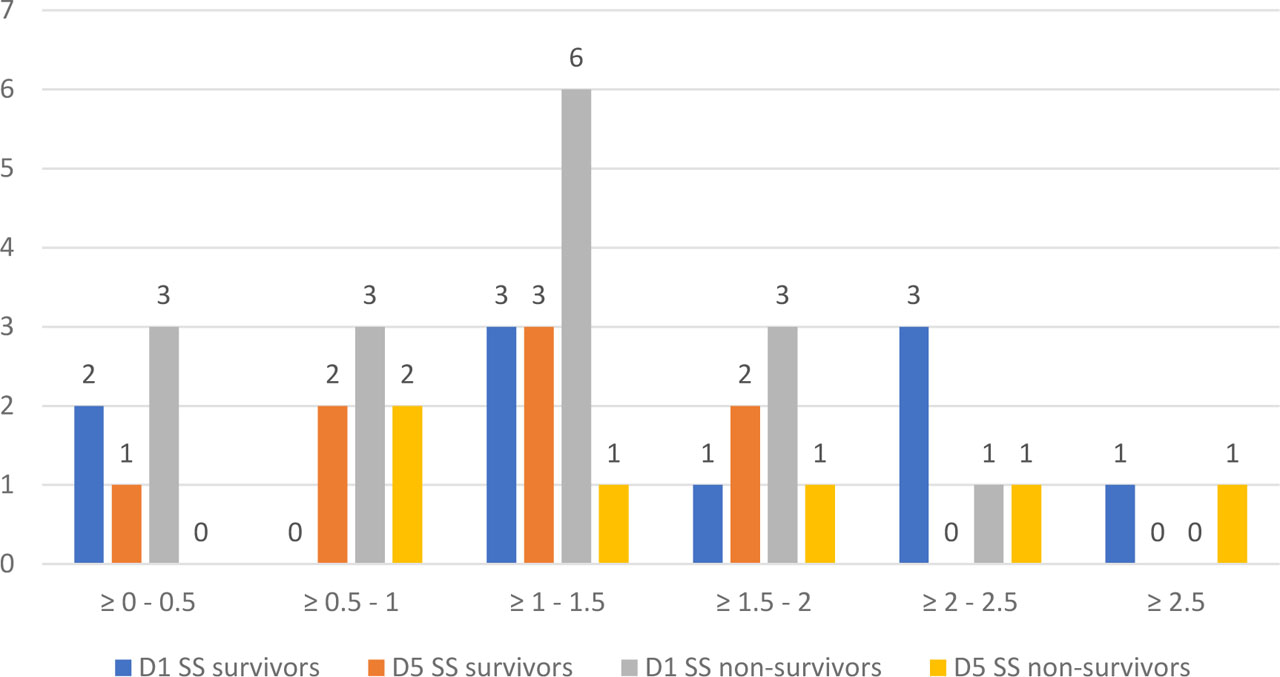
Fig. 15.
Evolution of COHb (%) on D1 and D5 in septic shock survivors and non-survivors (COHb – Carboxyhaemoglobin; SS – septic shock; D1 – day 1; D5 – day 5)
Table 4.
Site of infection and aetiology of infection of patients included in the study.
| Site of infection | Number of patients | Aetiology | Number of patients |
|---|---|---|---|
| Pulmonary | 36 | Pneumonia / Bronchopneumonia | 33 |
| Abdominal | 27 | Peritonitis | 12 |
| Cutaneous | 5 | Intestinal obstruction | 5 |
| Urinary tract | 4 | Enterocolitis | 2 |
| Bloodstream | 3 | Sepsis / septic shock of unknown origin | 2 |
| Soft tissue | 3 | Pancreatitis | 3 |
| Biliary tract | 1 | Urinary tract infection | 2 |
| Unspecified | 1 | Cutaneous abscess | 5 |
| Prosthetic joint infection | 1 |
Table 5.
Pathogens associated with infection of patients involved in the study.
| Pathogens | Number of patients | |
|---|---|---|
| Pseudomonas aeruginosa | 9 | |
| Klebsiella pneumoniae | CPE | 8 |
| BLSE | 2 | |
| unspecified | 2 | |
| Acinetobacter baumanii | 13 | |
| Proteus vulgaris | 2 | |
| Enterococcus faecalis | 5 | |
| Escherichia coli | BLSE | 4 |
| unspecified | 3 | |
| Staphylococcus arureus | MRSA | 1 |
| MSSA | 2 | |
| Streptococcus pneumoniae | 1 | |
| Candida spp. | 8 | |
| Clostridiumdifficile | 3 | |
| Other | 16 | |
| MDR | Yes | 13 |
| No | 48 |