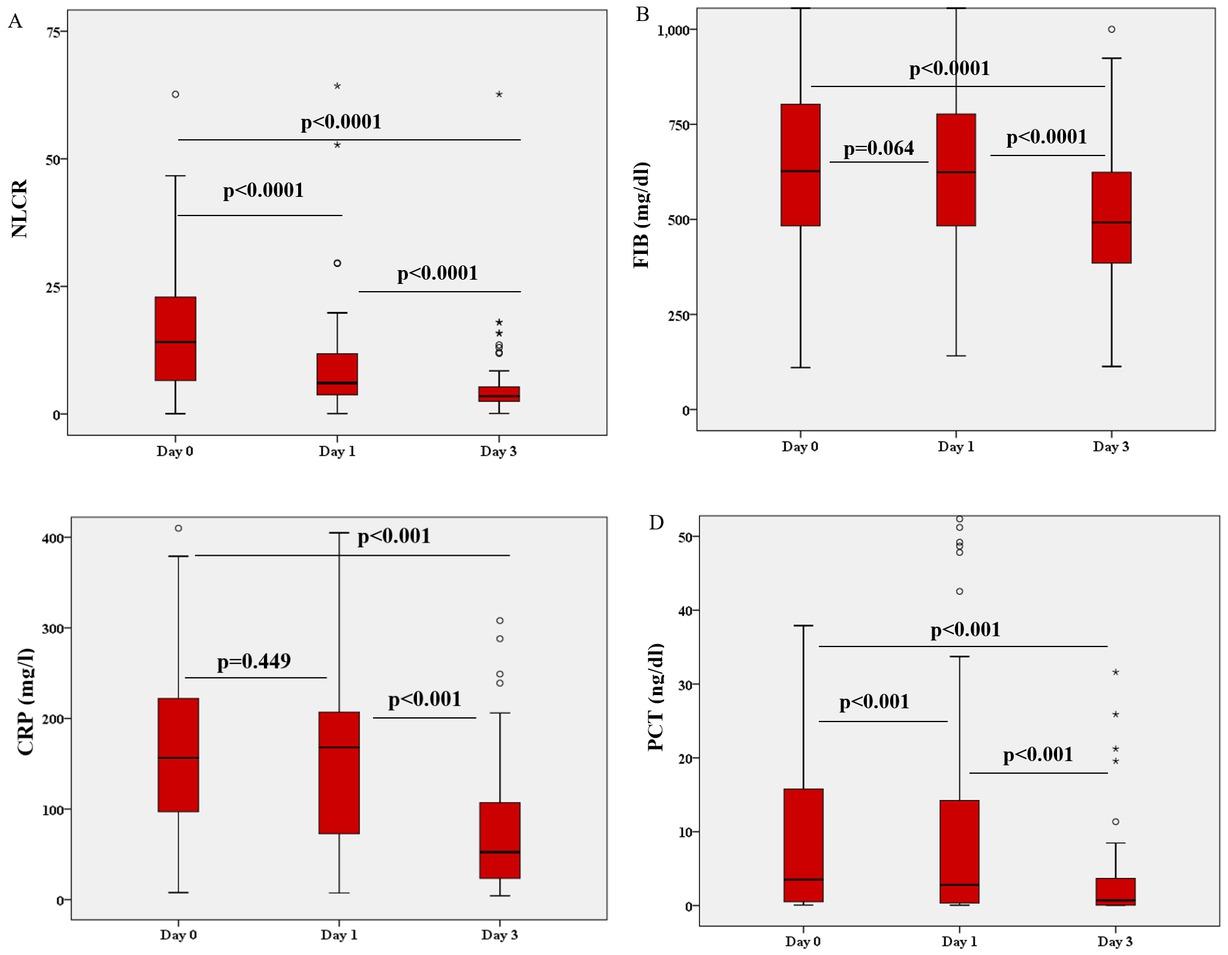
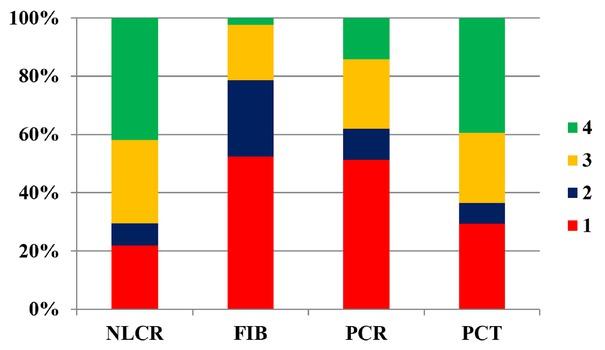
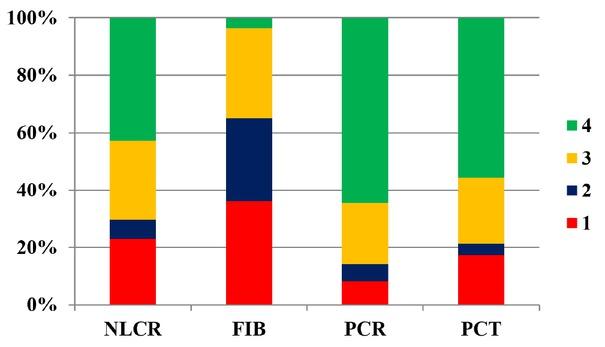
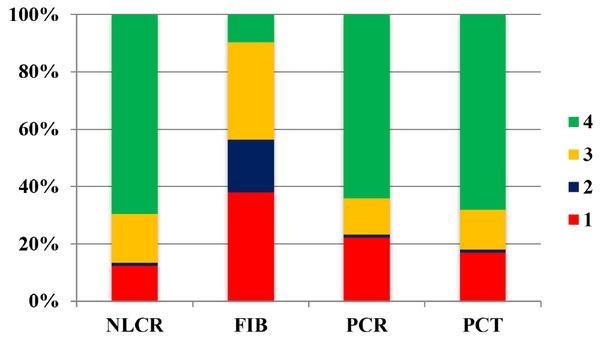
Have a personal or library account? Click to login
The Dynamical Assessment of Inflammatory Biomarkers in Predicting the Outcome of Septic Patients and the Response to Antimicrobial Therapy Cover

The Dynamical Assessment of Inflammatory Biomarkers in Predicting the Outcome of Septic Patients and the Response to Antimicrobial Therapy

Open Access
|Jan 2020

Figures & Tables

Fig. 1

The differences between the levels of serum biomarkers on days 0, 1 and 3. A. NLCR time course. Day 0 – Day 1 difference, p<0.0001; Day 0 – Day 3 difference, p<0.0001; Day 1 – Day 3 difference, p<0.0001. B. FIB time course. Day 0 – Day 1 difference, p=0.064; Day 0 – Day 3 difference, p<0.0001; Day 1 – Day 3 difference, p<0.0001. C. CRP time course. Day 0 – Day 1 difference, p=0.449; Day 0 – Day 3 difference, p<0.001; Day 1 – Day 3 difference, p<0.001. C. PCT time course. Day 0 – Day 1 difference, p<0.001; Day 0 – Day 3 difference, p=0.001; Day 1 – Day 3 difference, p<0.001. NLCR, Neutrophil/lymphocyte count ratio; FIB, fibrinogen; CRP, C-reactive protein; PCT, procalcitonin.

Fig. 2

Comparison of proportions of NLCR, FIB, CRP and PCT between days 0 and 1. 1 – patients who registered an increasing or a minor decreasing (<5% of the initial values) of serum biomarkers; 2 – patients who registered a decreasing of serum biomarkers between 5-20%; 3 – patients who registered a decreasing of serum biomarkers between 20-50%; 4 – patients who registered a major decreasing (>50%) of serum biomarkers. NLCR, Neutrophil/lymphocyte count ratio; FIB, fibrinogen; CRP, C-reactive protein; PCT, procalcitonin.

Fig. 3

Comparison of proportions of NLCR, FIB, CRP and PCT between days 1 and 3. 1 – patients who registered an increasing or a minor decreasing (<5% of the value at 24 hours) of serum biomarkers; 2 – patients who registered a decreasing of serum biomarkers between 5-20%; 3 – patients who registered a decreasing of serum biomarkers between 20-50%; 4 – patients who registered a major decreasing (>50%) of serum biomarkers. NLCR, Neutrophil/lymphocyte count ratio; FIB, fibrinogen; CRP, C-reactive protein; PCT, procalcitonin.

Fig. 4

Comparison of proportions of NLCR, FIB, CRP and PCT between days 0 and 3. 1 – patients who registered an increasing or a minor decreasing (<5% of the initial value) of serum biomarkers; 2 – patients who registered a decreasing of serum biomarkers between 5-20%; 3 – patients who registered a decreasing of serum biomarkers between 20-50%; 4 – patients who registered a major decreasing (>50%) of serum biomarkers. NLCR, Neutrophil/lymphocyte count ratio; FIB, fibrinogen; CRP, C-reactive protein; PCT, procalcitonin.

The dynamical values of NLCR, FIB, CRP and PCT on days 0, 1 and 3_ The results are presented as median (IQR)_

VariableAdmission (day 0)After 24 hours (day 1)After 72 hours (day 3)
NLCR13.4 (6; 22.8)6.14 (3.7; 12.86)3.63 (2.49; 5.98)
FIB (mg/dl)606 (475; 753)564 (474; 730)474 (385; 616)
CRP (mg/l)157 (102; 232)169 (73; 212)58.4 (23.5; 109)
PCT (ng/dl)4.36 (0.51; 22.71)3.34 (0.36; 22.06)0.78 (0.05; 4.77)
DOI: https://doi.org/10.2478/jccm-2020-0004 | Journal eISSN: 2393-1817 | Journal ISSN: 2393-1809
Language: English
Page range: 25 - 31
Submitted on: Nov 2, 2019
Accepted on: Jan 29, 2020
Published on: Jan 31, 2020
Published by: University of Medicine, Pharmacy, Science and Technology of Targu Mures
In partnership with: Paradigm Publishing Services
Publication frequency: 4 issues per year

© 2020 Alina Orfanu, Victoria Aramă, Cristina Popescu, Cătălin Tilişcan, Adrian Streinu-Cercel, Ştefan Sorin Aramă, published by University of Medicine, Pharmacy, Science and Technology of Targu Mures
This work is licensed under the Creative Commons Attribution-NonCommercial-NoDerivatives 4.0 License.