
Table 1.
Univariate Analysis.
| Factors | Mean, Median/IQR | Number (percentages) | Fistula Presence | P-Value | |
|---|---|---|---|---|---|
| Yes | NO | ||||
| Age in years | Mean: 50.49±13.03 | 18–30 years 10 (8.8) | 1 | 9 | 0.785 |
| 31–50 years 41 (36) | 9 | 32 | |||
| 51–70 years 57 (50) | 9 | 48 | |||
| 71 years & above 6 (5.3) | 1 | 5 | |||
| Gender | Male: 67 (58.8) | 16 | 51 | 0.034* | |
| Female: 47 (41.2) | 4 | 43 | |||
| BMI in kg | Mean:24.74±4.53 | Underweight 12 (10.5) | 3 | 9 | 0.198 |
| Healthy weight 46 (40.4) | 5 | 41 | |||
| Overweight 43 (37.7) | 11 | 32 | |||
| Obesity 13 (11.4) | 1 | 12 | |||
| Duct Size mm | Median:2.70 | Duct size <3mm 66 (58) | 16 | 50 | 0.044* |
| IQR: 1.80–4.20 | Duct size >3mm 48 (42) | 4 | 44 | ||
| Duct to Parenchyma Ration | Mean: 0.261±1.52 | High risk (<0.25): 61 (53.5) | 16 | 46 | 0.013* |
| Low risk (>0.25): 53 (46.5) | 4 | 48 | |||
| Fistula risk score | Mean: 4.38±2.05 | Low risk: 25 | 2 | 23 | 0.004* |
| Medium risk: 71 | 10 | 61 | |||
| High risk: 18 | 8 | 10 | |||
| Gland consistency | Soft 71 (62.28) | 14 | 57 | 0.940 | |
| Hard 43 (37.72) | 6 | 37 | |||
| Post-operative histopathology | Moderately diff- Adenocarcinoma 64 (56) | 10 | 54 | 0.552 | |
| Poorly diff- Adenocarcinoma 15 (13) | 1 | 14 | |||
| Well diff-Adenocarcinoma 17 (15) | 6 | 11 | |||
| Well to mod-diff adenocarcinoma 1 (0.9) | 0 | 1 | |||
| Neuroendocrine tumour Grade-I 2 (1.8) | 0 | 2 | |||
| Neuroendocrine tumour Grade -II 2 (1.8) | 1 | 1 | |||
| Neuroendocrine tumour Grade -III 3 (2.6) | 1 | 2 | |||
| Pseudopapillary neoplasm 2 (1.8) | 0 | 2 | |||
| Intraductal papillary mucinous neoplasm 2 (1.8) | 0 | 2 | |||
| Chronic Pancreatitis 5 (4.4) | 1 | 4 | |||
| Tubulovillious Adenoma 1 (0.9) | 0 | 1 | |||
| Blood loss in ml | Median: 200 ml | Less than 500 ml: 103 (90) | 19 | 84 | 0.717 |
| IQR:100–300 ml | 500ml–1000 ml: 10 (8.8) | 1 | 9 | ||
| More than 1000ml: 1 (0.9) | 0 | 1 | |||
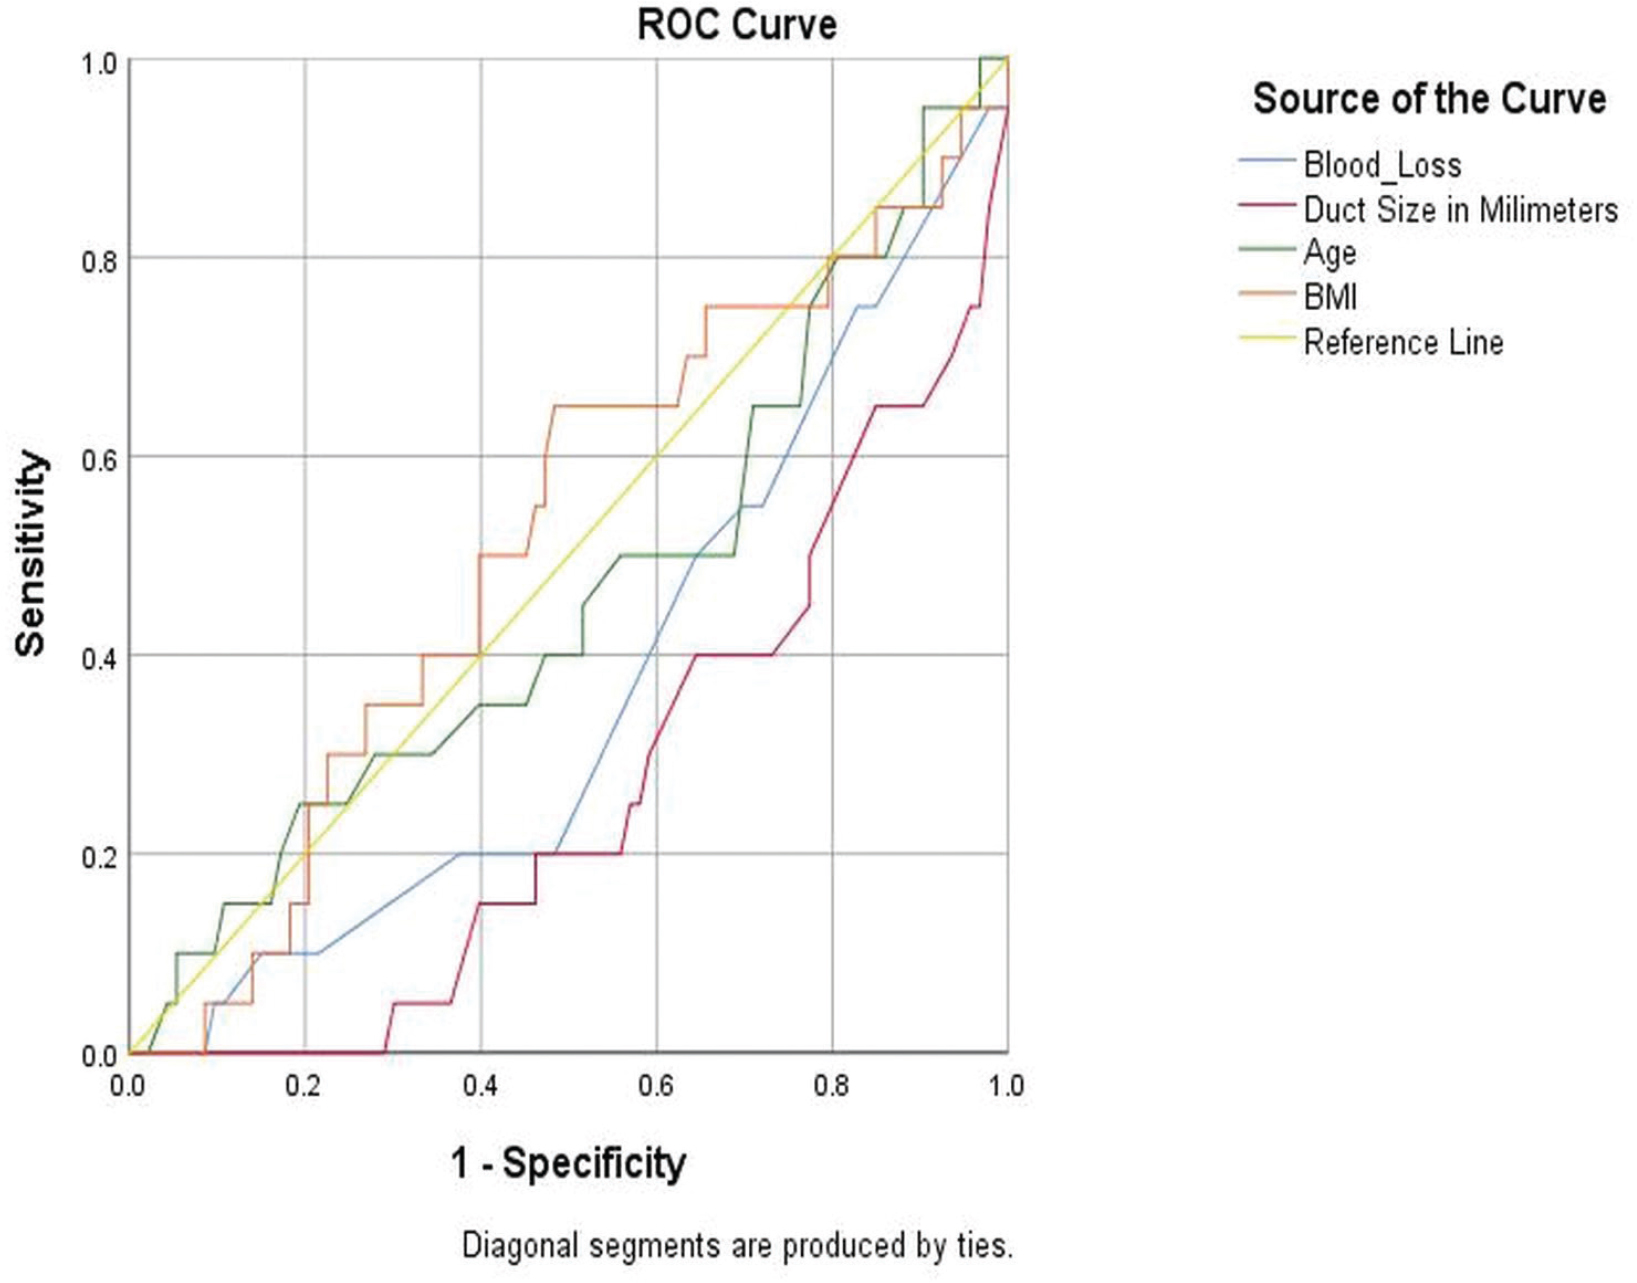
Figure 1.
ROC (Receiver Operating Characteristic) curve for original Fistula Risk Score (o-FRS) and duct-to-parenchyma ratio (DPR).
Table 2.
Area under curve (AUC) analysis of o-FRS and DPR with corresponding significance and confidence intervals.
| SN | Test variable | Area under curve | Confidence interval | Level of significance | Standard error |
|---|---|---|---|---|---|
| 1 | O-FRS | 0.709 | 0.577–0.841 | 0.003 | 0.067 |
| 2 | DPR | 0.232 | 0.132–0.332 | 0.000 | 0.051 |
Table 3.
Multivariate Logistic regression.
| Variables | Odds Ratio | Confidence Interval | P-value |
|---|---|---|---|
| Age | 0.99 | 0.95–1.04 | 0.932 |
| BMI | 0.96 | 0.86–1.07 | 0.520 |
| Gland consistency | |||
| soft | 0.822 | 0.254–2.663 | 0.744 |
| hard | |||
| Duct size in mm | 0.43 | 0.23–0.78 | 0.006* |
| Gender | |||
| male | Reference | ||
| female | 3.96 | 1.09–4.38 | 0.036* |
| Blood loss in ml | 0.998 | 0.994–1.00 | 0.214 |
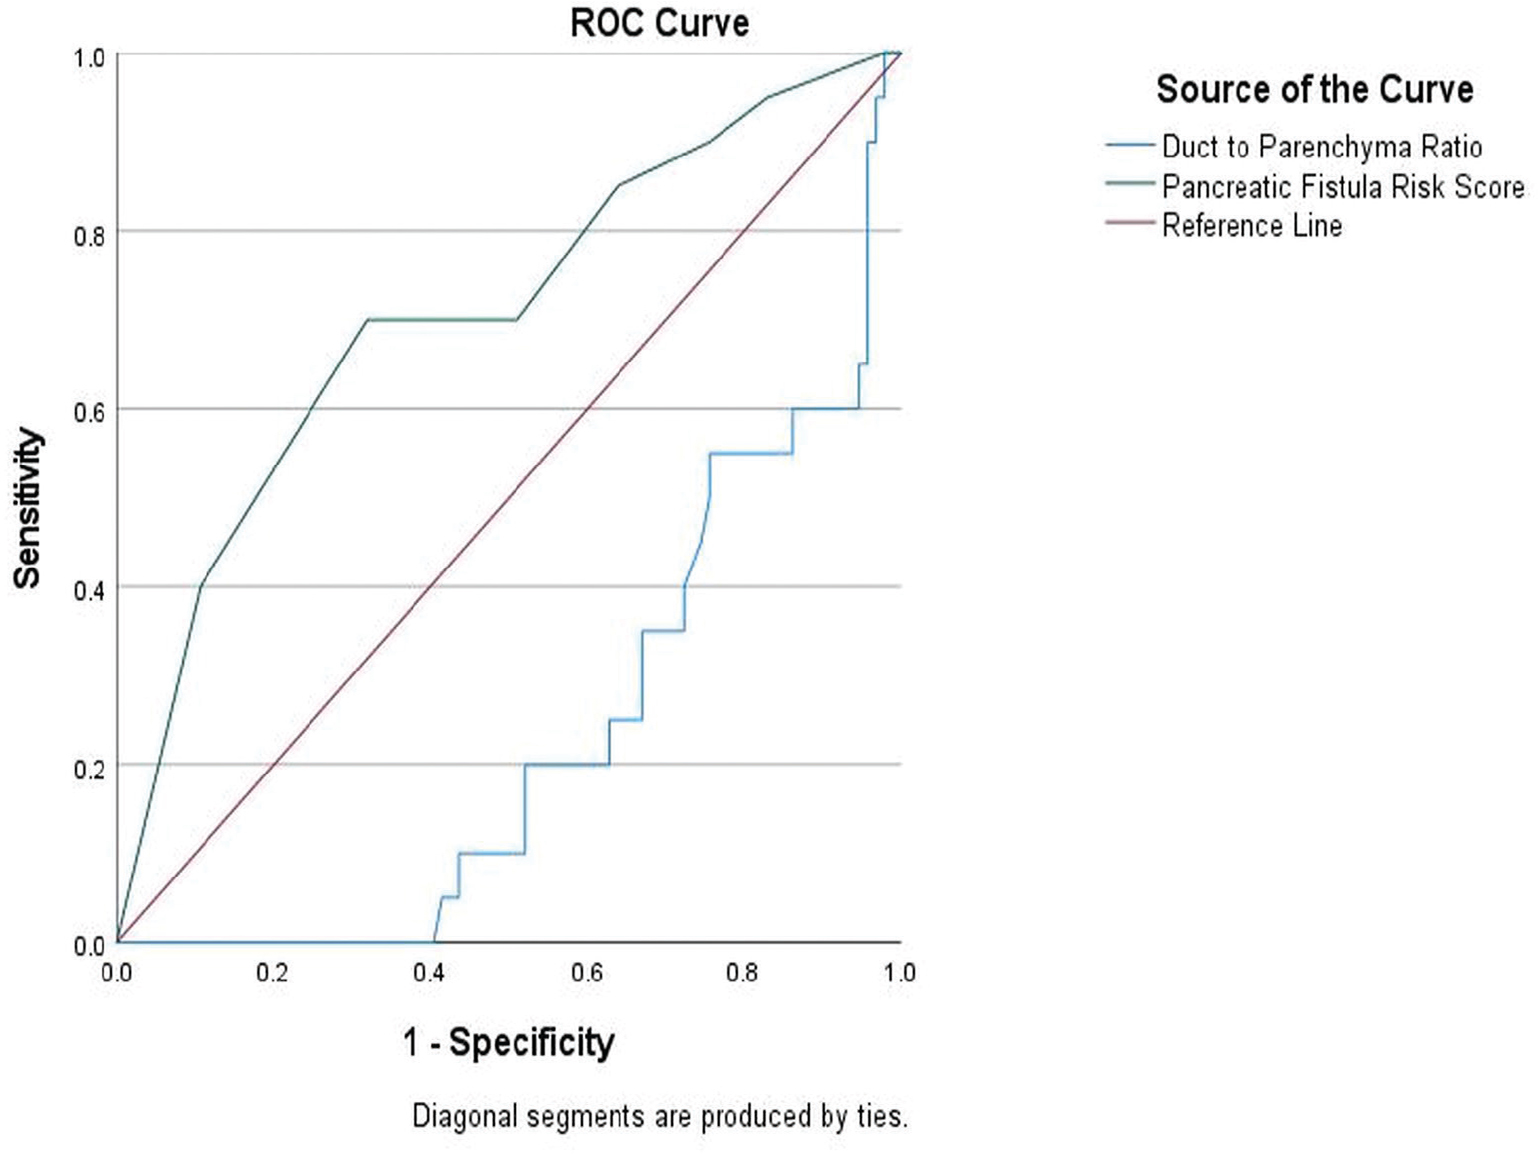
Figure 2.
ROC (Receiver Operating Characteristic) curve for individual factors.