
Table 1.
Baseline Demographic and Clinicopathological Characteristics of Children with B-Cell Non-Hodgkin’s Lymphoma.
| Variables | Characteristics | Frequency n (%) |
|---|---|---|
| Age (years) | Median (IQR) | 5.0 (2.0) |
| Gender | Male | 212 (76.8) |
| Female | 64 (23.2) | |
| Area of Residence | Punjab | 64 (23.2) |
| Khyber Pakhtunkhwa | 158 (57.2) | |
| Afghanistan | 39 (14.1) | |
| Balochistan | 13 (4.7) | |
| Sindh | 1 (0.4) | |
| Others | 3 (1.1) | |
| Diagnosis | Burkitt’s lymphoma | 246 (89.1) |
| DLBCL | 26 (9.4) | |
| B-cell NHL, NOS | 4 (1.4) | |
| Diagnostic Procedure | Biopsy | 150 (54.3) |
| Laparotomy | 126 (45.7) | |
| Tumor Lysis Syndrome | Yes | 68 (24.6) |
| No | 208 (75.4) | |
| Clinical Stage | Low stage (I–II) | 13 (4.7) |
| Advanced stage (III–IV) | 263 (95.3) | |
| Primary Site of Disease | Abdomen | 231 (83.7) |
| Face | 28 (10.1) | |
| Neck | 6 (2.2) | |
| Paraspinal | 8 (2.9) | |
| Others | 3 (1.1) | |
| Stage IV Disease | None | 203 (73.6) |
| Bone marrow involvement | 28 (10.1) | |
| CNS disease (cranial mass or nerve palsy) | 28 (10.1) | |
| CSF positive | 3 (1.1) | |
| Both BM & CNS involvement | 14 (5.1) | |
| Reassessment Scan | Not done | 88 (31.9) |
| Complete response | 174 (63.0) | |
| Partial treatment response | 9 (3.3) | |
| Disease progression | 5 (1.8) |
Table 2.
Association of Baseline Clinical Characteristics with Mortality Among Children with B-cell Non-Hodgkin’s Lymphoma.
| Variables | Characteristics | Alive: n (%) | Death: n (%) | P-value |
|---|---|---|---|---|
| Sex | Male | 140 (66.0) | 72 (34.0) | 0.182 |
| Female | 36 (56.3) | 28 (43.8) | ||
| Baseline LDH | ≤2× upper limit of normal | 115 (80.4) | 28 (19.6) | <0.001 |
| >2× upper limit of normal | 61 (45.9) | 72 (54.1) | ||
| Primary Disease Site | Abdomen | 151 (65.4) | 80 (34.6) | 0.051 |
| Face | 15 (53.6) | 13 (46.4) | ||
| Paraspinal | 2 (25.0) | 6 (75.0) | ||
| Clinical Stage | Low stage (I–II) | 12 (92.0) | 1 (8.0) | <0.001 |
| Advanced stage (III–IV) | 163 (63.0) | 99 (37.0) | ||
| Surgery Type at Diagnosis | Biopsy | 82 (54.7) | 68 (45.3) | <0.001 |
| Laparotomy | 94 (74.6) | 32 (25.4) | ||
| Tumour Lysis Syndrome | No | 157 (75.5) | 51 (24.5) | <0.001 |
| Yes | 19 (27.9) | 49 (72.1) | ||
| Reassessment Scan | Complete response | 165 (94.8) | 9 (5.2) | <0.001 |
| Partial response | 7 (77.8) | 2 (22.2) | ||
| Disease progression | 1 (20.0) | 4 (80.0) |
Table 3.
Predictors of Mortality in B-cell Non-Hodgkin Lymphoma (Unadjusted and Adjusted).
| Analysis | Variables | Characteristics | Unadjusted OR (95% CI) | p-Value |
|---|---|---|---|---|
| Univariate | Gender | Male | Reference | |
| Female | 1.31 (0.85–2.04) | 0.216 | ||
| Baseline LDH | <2× upper limit of normal | Reference | ||
| >2× upper limit of normal | 3.31 (2.13–5.13) | <0.001 | ||
| Tumor Lysis Syndrome | No | Reference | ||
| Yes | 4.04 (2.71–6.02) | <0.001 | ||
| Surgery at Diagnosis | Laparotomy | Reference | ||
| Biopsy | 0.50 (0.33–0.77) | 0.002 | ||
| Multivariate | Gender | Male | Reference | |
| Female | 1.41 (0.91–2.20) | 0.120 | ||
| Baseline LDH | <2× upper limit of normal | Reference | ||
| >2× upper limit of normal | 2.03 (1.24–3.30) | 0.004 | ||
| Tumour Lysis Syndrome | No | Reference | ||
| Yes | 2.86 (1.83–4.45) | <0.001 | ||
| Surgery at Diagnosis | Laparotomy | Reference | ||
| Biopsy | 0.86 (0.54–1.37) | 0.530 |
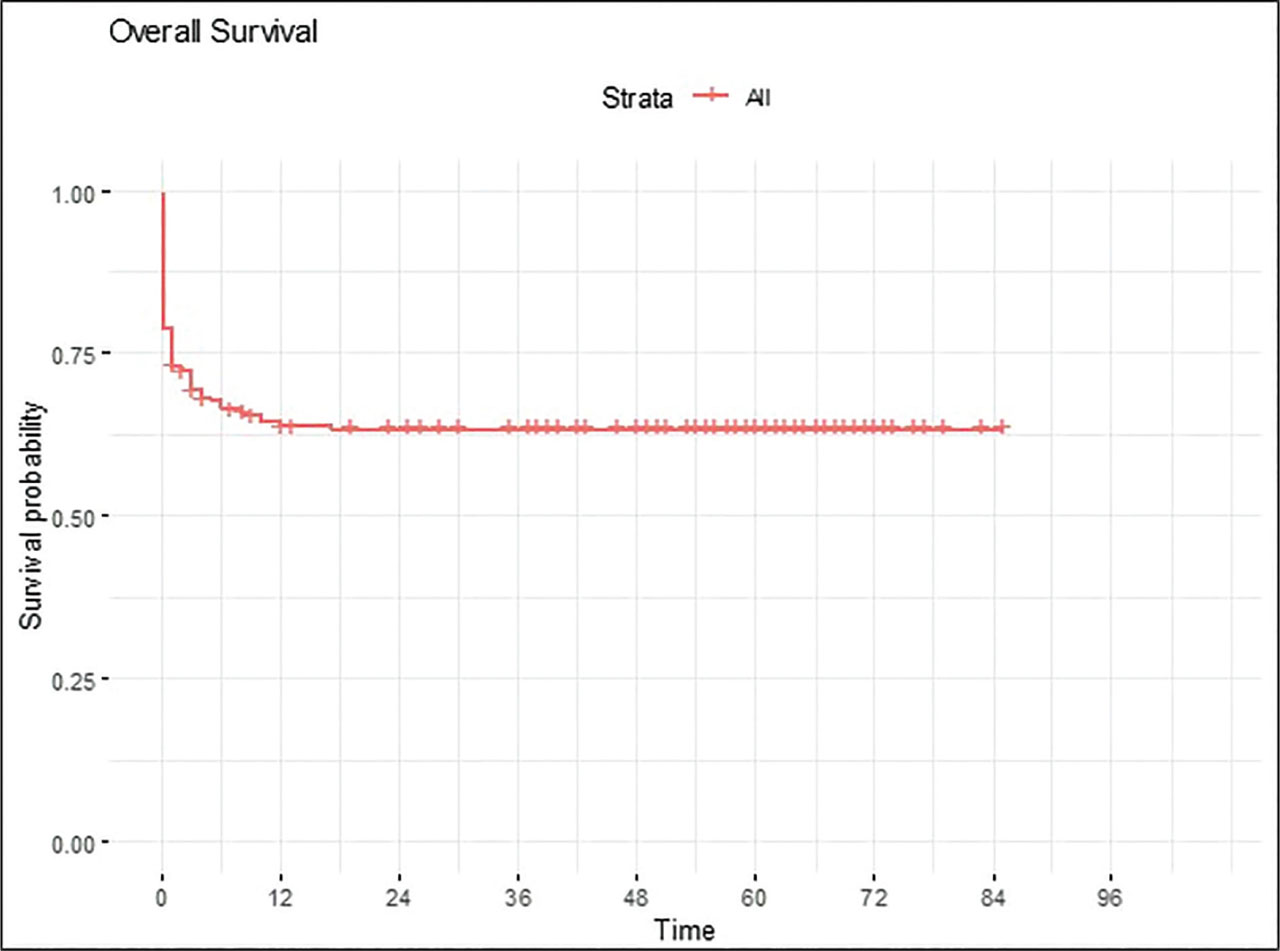
Figure 1.
Kaplan–Meier Curve of Overall Survival in Patients with B-cell Non-Hodgkin Lymphoma.
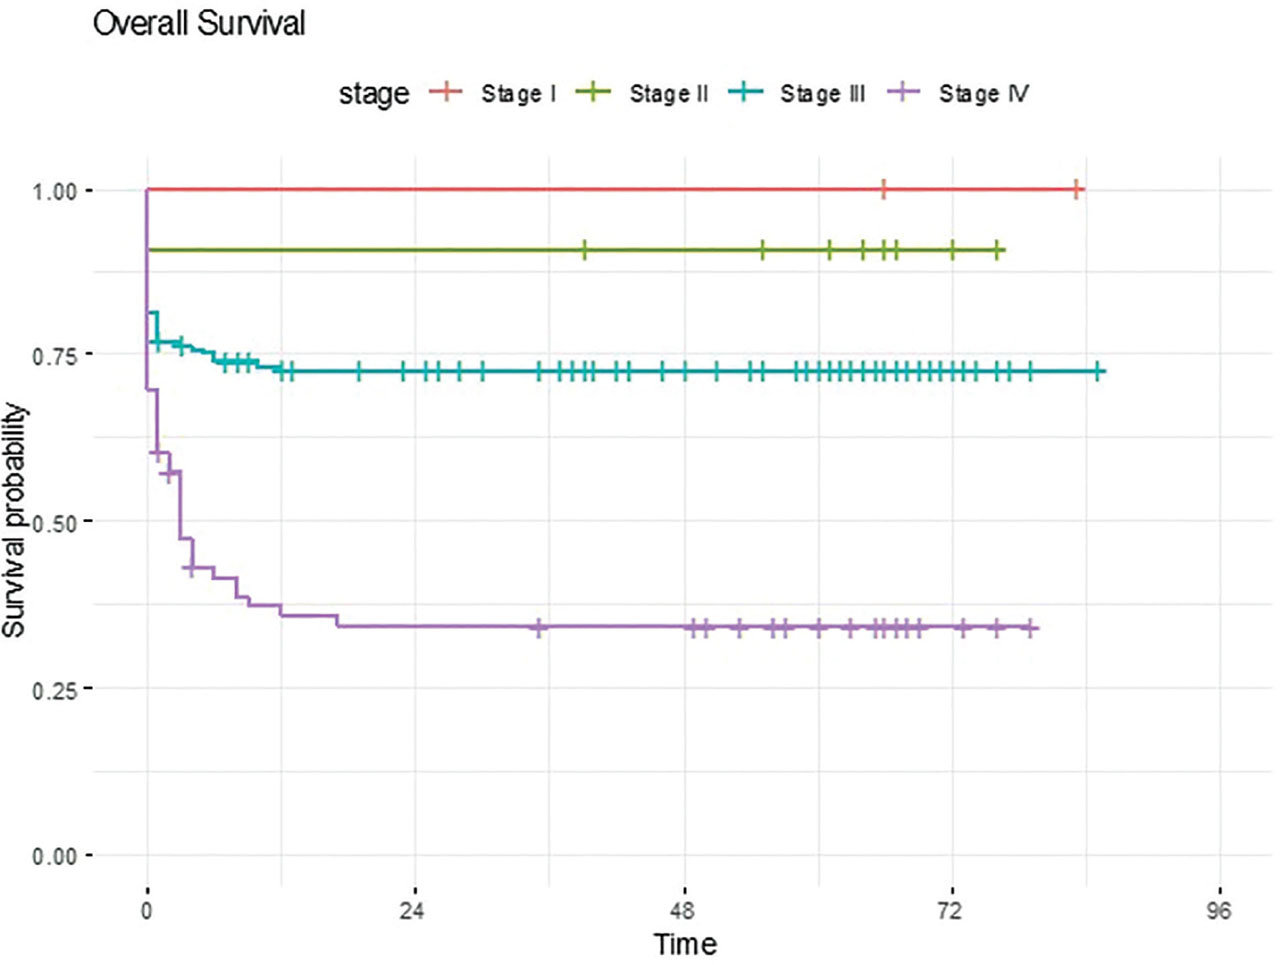
Figure 2.
Kaplan–Meier Curve of Overall Survival Stratified by Clinical Stage in Patients with B-cell Non-Hodgkin Lymphoma.
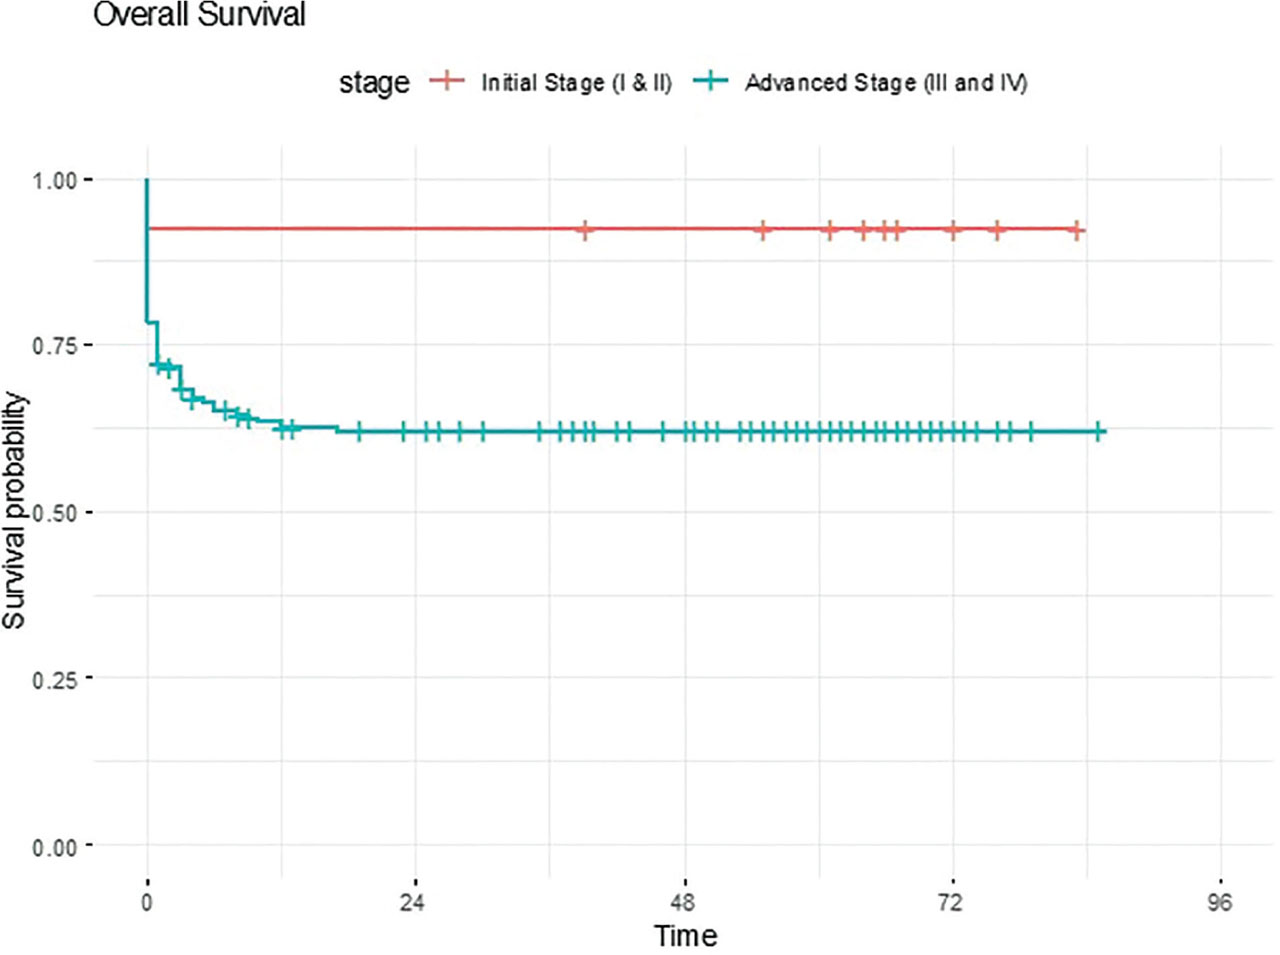
Figure 3.
Kaplan–Meier Curve of Overall Survival Stratified by Disease Burden in Patients with B-cell Non-Hodgkin Lymphoma.
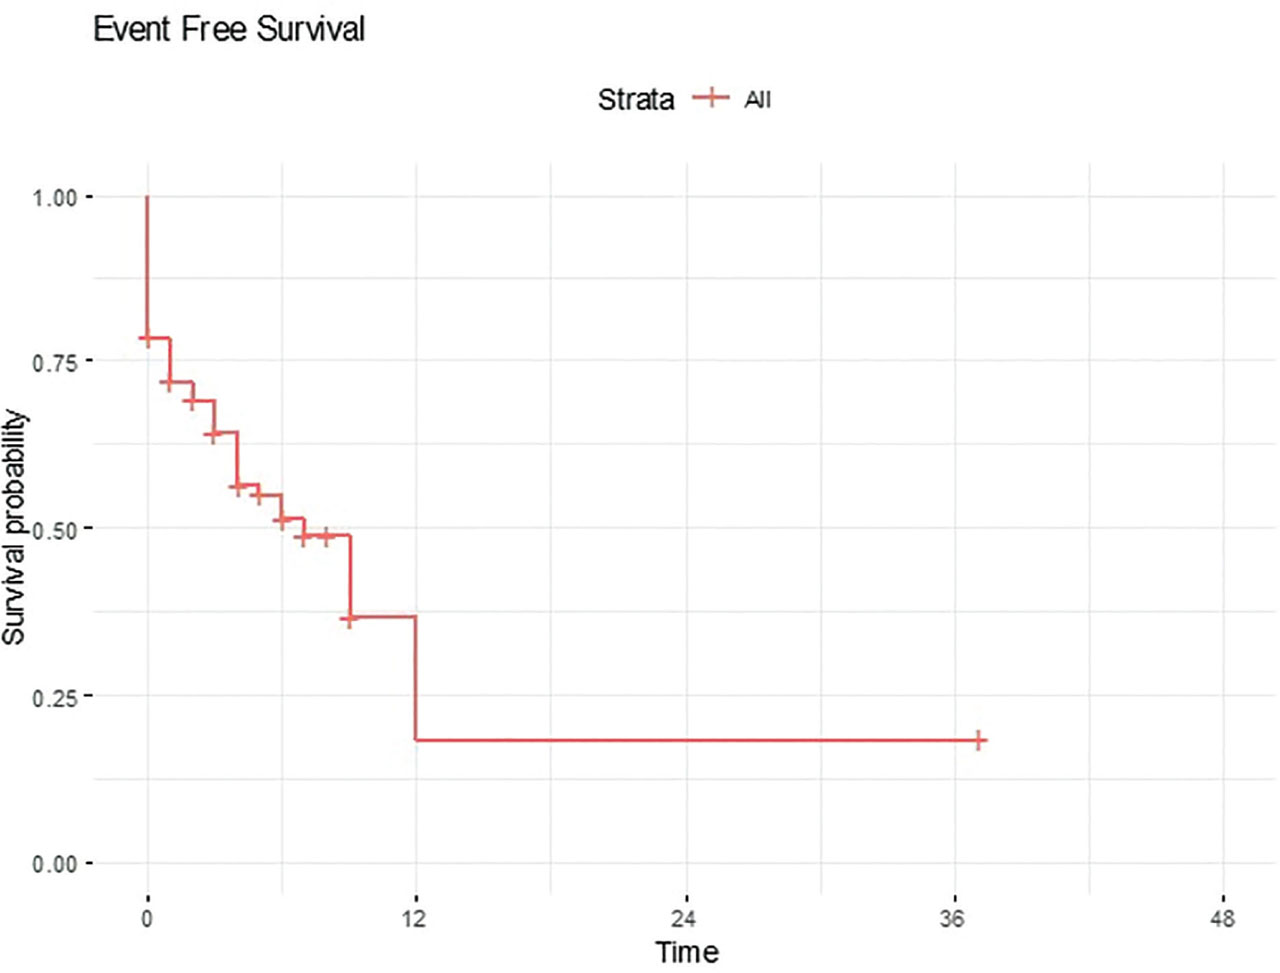
Figure 4.
Kaplan–Meier Curve of Event-Free Survival in Patients with B-cell Non-Hodgkin Lymphoma.
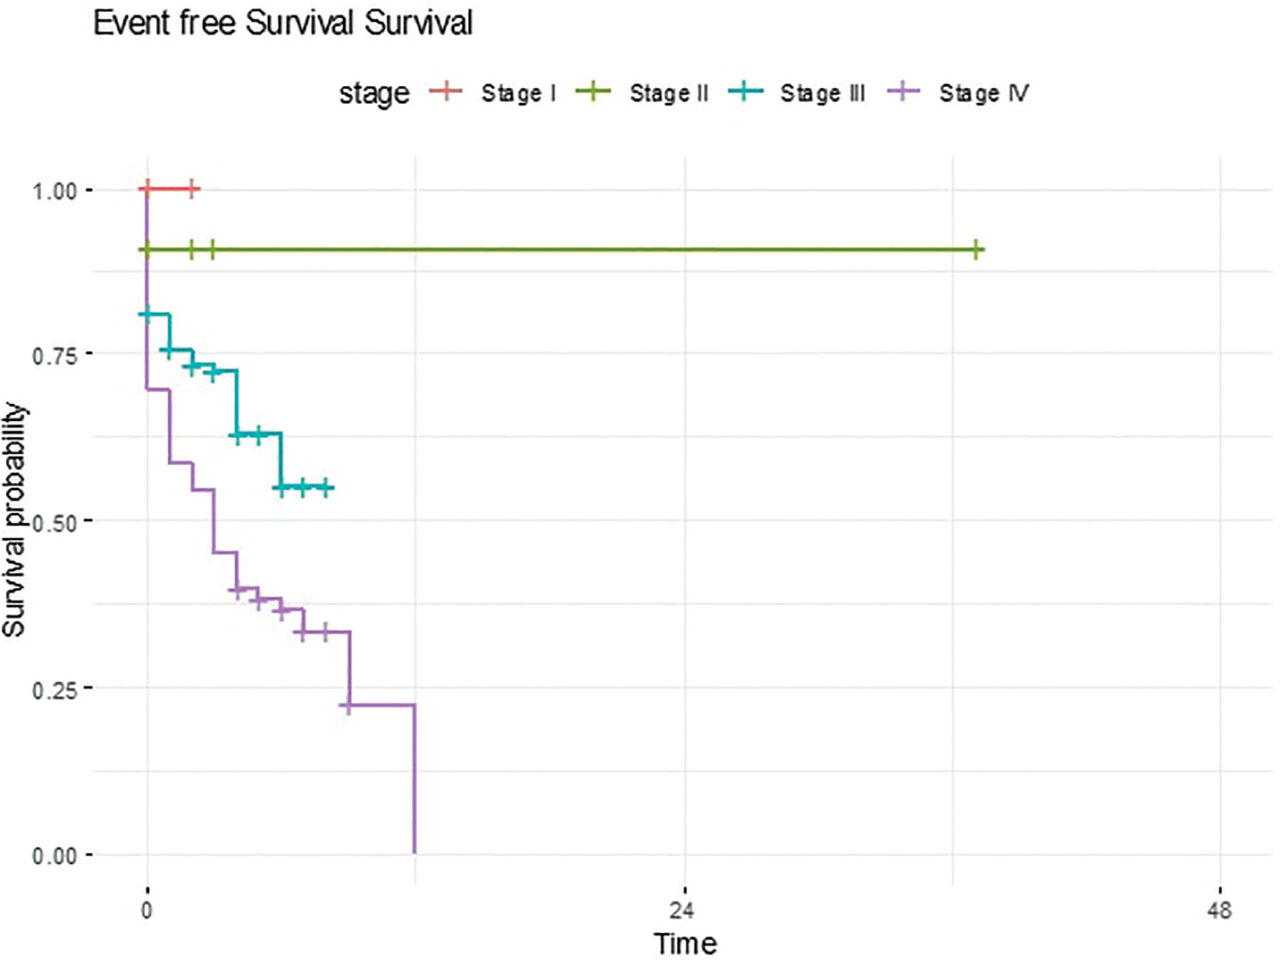
Figure 5.
Kaplan–Meier Curve of Event Free Survival Stratified by Clinical Stage in Patients with B-cell Non-Hodgkin Lymphoma
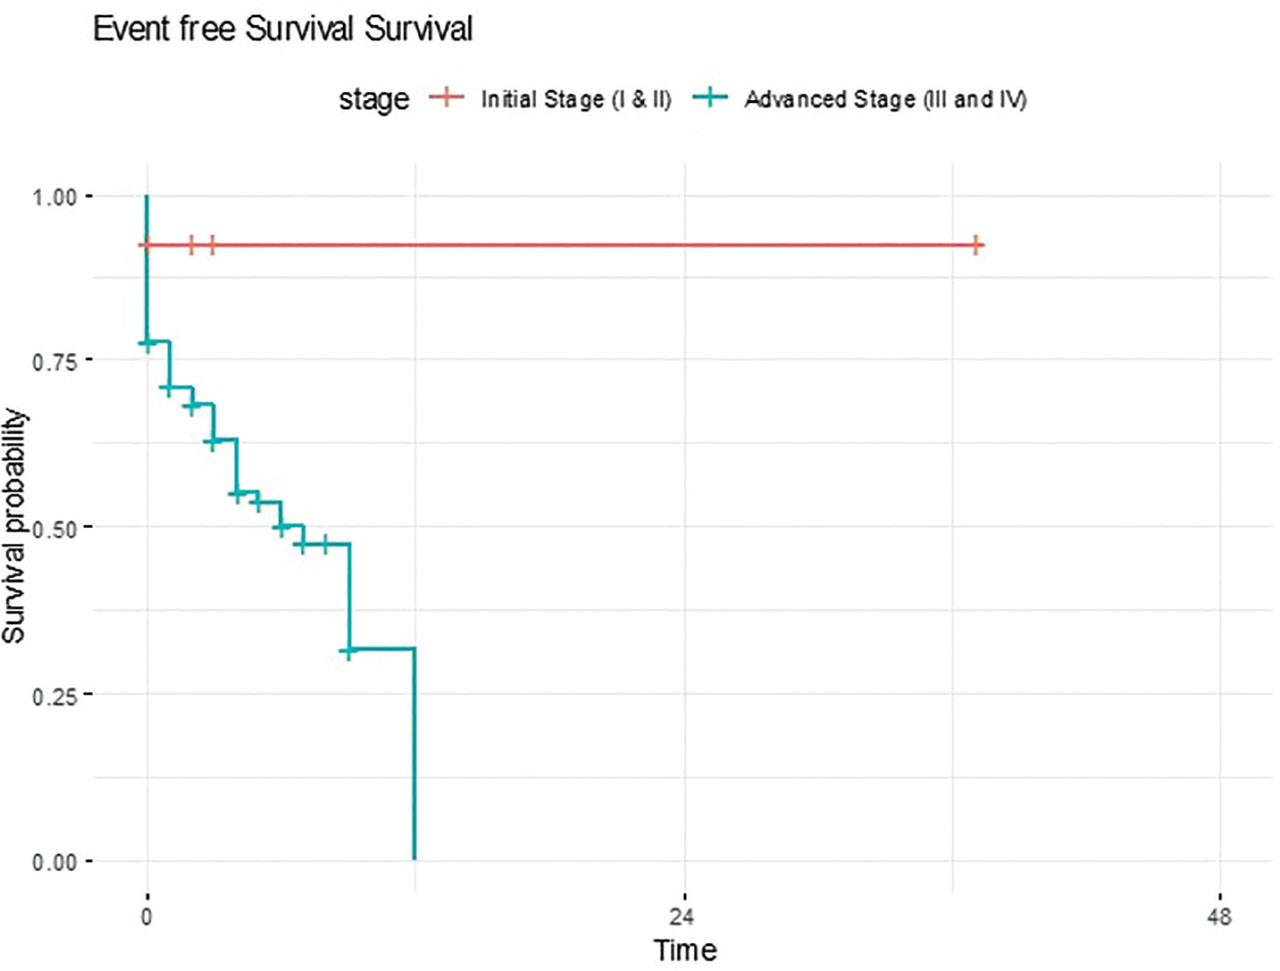
Figure 6.
Kaplan–Meier Curve of Event-Free Survival Stratified by Disease Burden in Patients with B-cell Non-Hodgkin Lymphoma.