
Table 1.
Biodemographic Characteristics of Study Population.
| Characteristic | Number (Percentage %) |
|---|---|
| Age | |
| Age, median (years) | 3 |
| Age, mean (years) | 3.3 |
| Age range (years) | 1–7 (IQR: 3–4) |
| Gender | |
| • Male | 268 (61.5%) |
| • Female | 168 (38.5%) |
| Follow up | |
| Follow-up, median (months) | 46 (IQR: 26–64) |
| Total Patients | 436 |
| Risk Group | |
| Standard-risk | 420 (96.3%) |
| High-risk | 16 (3.7%) |
| CNS involvement | 2 (<1%) |
| CNS 2 | 1 |
| CNS 3 | 1 |
| Testicular Involvement | 5 (1.1%) |
| Treatment Regimen | |
| Standard-risk | 420 (96.3%) 3 Drug Induction |
| High-risk | 16 (3.7%) (4 Drug Induction) |
Table 2.
Details of FISH/Karyotype.
| FISH / Karyotype | Number of Patients |
|---|---|
| Performed in all patients | 436 |
| No result/not performed | 5 |
| TEL-AML/ETV6/RUNX1 translocation | 72 |
| MLL Gene rearrangement | 2 |
| BCR ABL translocation | 6 |
| Hyperploidy | 11 |
| Hypodiploidy or Haploidy | 0 |
| Hypotriploidy | 1 |
| Translocation (1:19) | 3 |
| Normal Karyotype | 336 |
Table 3.
Details about Treatment Response.
| Remission Status | Number (Percentage %) |
|---|---|
| Total patients | 436 |
| • Post induction Bone marrow examination (BME) performed | 389 (89.2%) |
| • Post induction number of patients who did not have BME | 47 (10.8%) |
| Standard risk Patient who had BME (n = 373) | |
| • Complete remission post induction (Minimal residual disease MRD on FCM) ≤0.01 | 305 (81.8%) |
| • MRD-positive end of induction (≥0.01 on FCM) | 65 (17.4%) |
| • MRD-positive end of induction (≥5% on FCM) | 3 (0.8%) |
| • MRD-positive end of consolidation (≥0.01 on FCM) | 13 (3.5%) |
| High risk (n = 16) | |
| • Complete remission | 12 (75.0%) |
| • MRD-positive at end of induction | 4 (25%) |
| • MRD Positive end of consolidation | 2 (12.5%) |
Table 4.
Relapse Details of the Included Patients.
| Characteristic | Number of patients (%) |
|---|---|
| Total Patients in complete remission | 374 |
| Total number of relapses | 56 (14.9%) * |
| Type of Relapse based on Timing | Total 56 |
| Very early relapse | 13 (23.2%) |
| Early relapse | 23 (41.1%) |
| Late relapse | 20 (35.7%) |
| Type of Relapse based on involved site | Total 56 |
| Isolated Bone marrow relapse | 30 (53.6%) |
| Isolated CNS relapse | 10 (17.8%) |
| Combined Relapse | 16 (28.6) |
Table 5.
Mortality related Statistics of the Study Population.
| Characteristic | Number of patients (%) |
|---|---|
| Total Patients | 436 |
| Overall mortality | 114 (26.1%) |
| Induction mortality | 51 (11.7%)* |
| Causes of death | |
| Sepsis | 74 (59.7%) |
| Relapse | 36 (29%) |
| Refractory disease | 3 (2.4%) |
| Other causes | 11 (8.9%) |
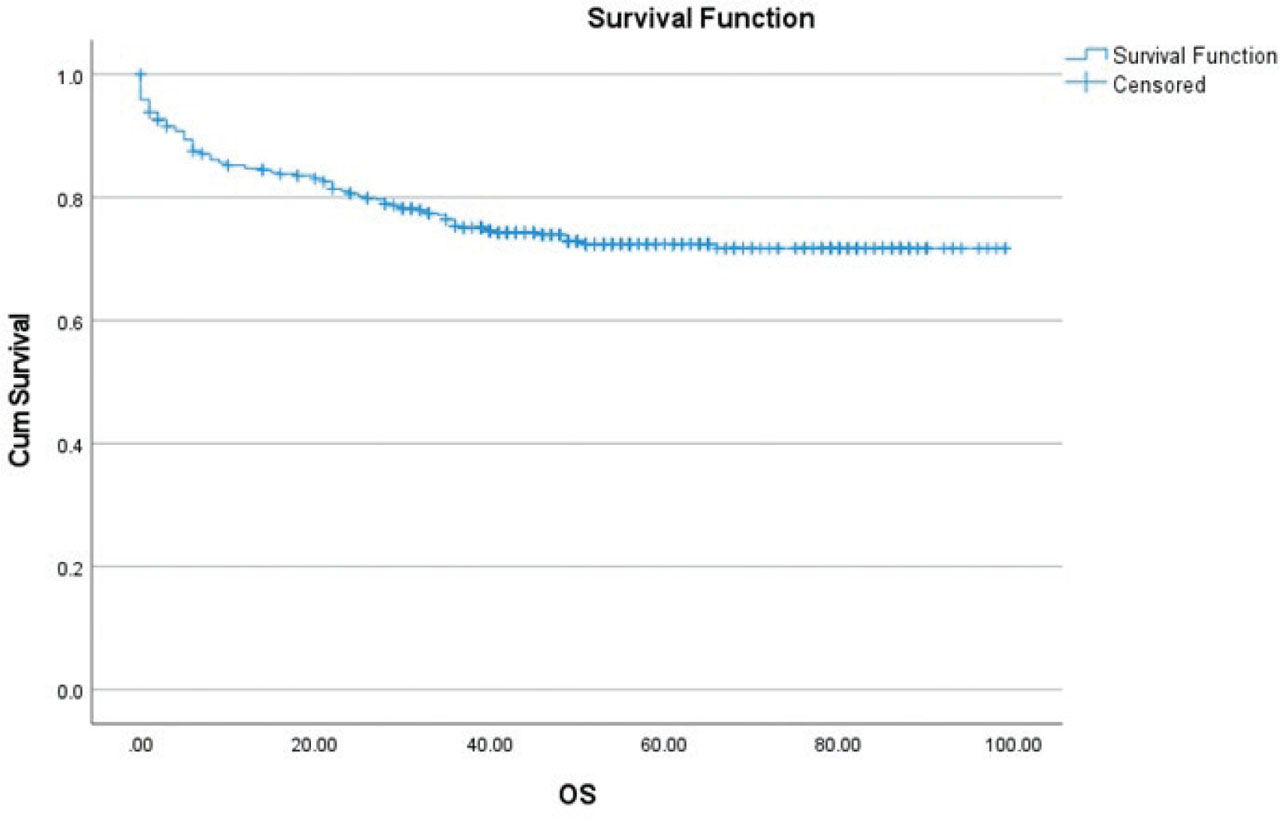
Figure 1.
Five-year overall survival (OS) of precursor B cell acute lymphoblastic lymphoma patients cohort treated at our centre.
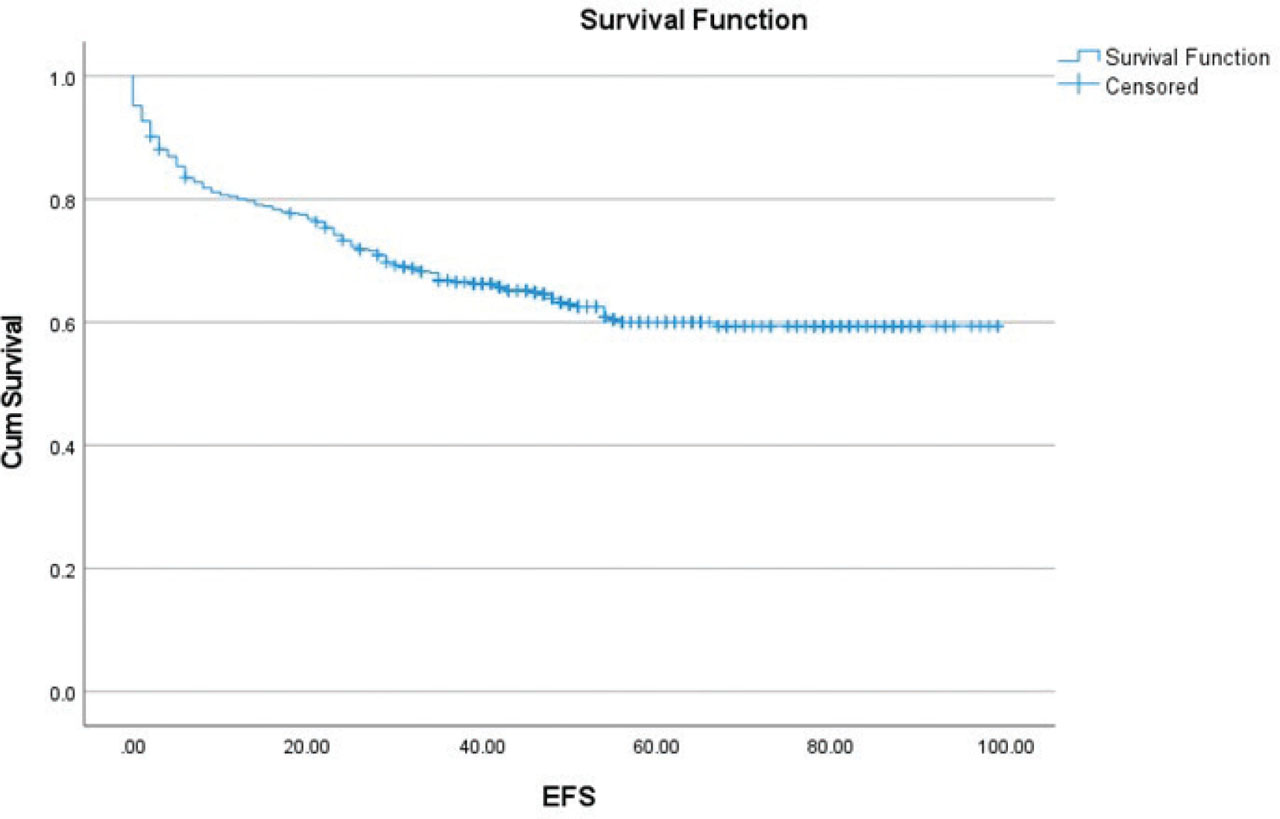
Figure 2.
Five-year event free survival (EFS) of precursor B cell acute lymphoblastic lymphoma patients cohort treated at our centre.