
Introduction
Acute lymphoblastic leukemia (ALL) is the most common childhood malignancy (1). Precursor B-cell ALL, the most frequent pediatric subtype, has seen remarkable improvements in survival in high-income countries (HICs), primarily due to large, multi-center cooperative group clinical trials. However, these advancements have not translated to low- and middle-income countries (LMICs), where most children with cancer reside (2). Several factors adversely affect outcomes in LMICs (1). Major barriers include treatment abandonment, logistical challenges, insufficient social and financial support, lack of universal health coverage, suboptimal healthcare budgets, and limited infrastructure (3). Inferior outcomes are also linked to delayed oncology referrals, inadequate risk stratification, inability to implement intensive, risk-based treatment regimens, and limited capacity to manage relapsed ALL (4).
Despite these ongoing challenges, survival outcomes in LMICs have improved steadily over the past decade. Our institution, a tertiary care center in Pakistan, serves as a major referral hub for pediatric oncology patients nationwide. Pakistan has made gradual but meaningful progress in pediatric cancer care through improved healthcare infrastructure and increased availability of trained pediatric oncologists in both public and private sectors.
To achieve outcomes comparable to international standards, it is essential to adopt standardized treatment protocols aligned with international collaborative groups, making appropriate modifications for local resource settings. These adaptations help minimize treatment-related toxicities and mortality while maintaining the therapeutic intensity needed for optimal disease control. Furthermore, integrating modern diagnostic and monitoring techniques—such as advanced risk stratification, prognostic assessment, and structured follow-up—is critical for improving outcomes.
In this context, we present our institutional experience managing pediatric precursor B-cell ALL, the most common type of childhood leukemia (5). This study aimed to evaluate the treatment outcomes of children diagnosed with precursor B-cell ALL at our center.
Material and Methods
Study Design and Setting: This retrospective cohort study was conducted in the pediatric hematology and oncology unit at Shaukat Khanum Cancer Hospital and Research Centre, Lahore, Pakistan.
Patient Selection: All newly diagnosed patients with precursor B-cell acute lymphoblastic leukemia, aged 6 months to 18 years, who registered for treatment at our hospital between September 2017 and September 2022 (5 years) were included. Institutional Review Board (IRB) approval was obtained.
Data Collection: Basic clinical information—including age, gender, diagnosis, investigations, and risk stratification—was obtained manually from electronic medical records. The diagnosis of precursor B-cell acute lymphoblastic leukemia was based on bone marrow aspirate (BMA) morphology and flow cytometry (FCM). Patients with 20% or more lymphoid blasts in the bone marrow were diagnosed with acute lymphoblastic leukemia. A lumbar puncture was performed to assess CNS status. Central nervous system (CNS) involvement was classified as CNS1 (absence of blasts), CNS2 (fewer than 5 blasts/μL), and CNS3 (5 or more unequivocal blasts/μL) according to standard criteria. Neurological deficits or radiologic evidence of leukemic intracranial infiltration were also classified as CNS3. Fluorescent in situ hybridization (FISH) for ETV6-RUNX1 (TEL/AML) translocation, MLL gene rearrangement, and BCR-ABL translocation, along with karyotyping of diagnostic bone marrow, was performed for all patients. A biochemical and infectious profile—including hepatic and renal function tests, uric acid, phosphate, HBsAg, anti-HIV antibodies, anti-HCV, and cardiac assessment by echocardiography—was completed before starting treatment. Patients diagnosed before implementation of the UKALL 2019 Interim Guidelines were treated according to the standard arms of the UKALL 2011 trial protocol Version 3.0 (6). Most patients were subsequently treated according to the UKALL 2019 Interim Guidelines (Versions 1.0 and 1.1), which are based on the non-randomized standard arms of the UKALL 2011 trial protocol (7). Thus, the treatment backbone for all patients in this study was the standard arm of the UKALL 2011 protocol. Patients received induction therapy followed by consolidation, interim maintenance, single delayed intensification, and maintenance. Maintenance was given for two years in girls and three years in boys from Day 1 of interim maintenance. Patients received intrathecal methotrexate as per protocol (CNS-directed therapy). Patients with Philadelphia chromosome–positive pre-B ALL were treated according to the COG ALL 1631 protocol. No cases of infant acute lymphoblastic leukemia were identified in the cohort. Patients were stratified as standard- or high-risk according to National Cancer Institute (NCI) criteria. Standard risk was defined as WBC count <50 × 109/L and age 1–10 years. High risk was defined as WBC count ≥50 × 109/L, age >10 years, or high-risk cytogenetics. Standard-risk patients and those with Down syndrome (Trisomy 21) received three-drug induction (Regimen A). High-risk patients received four-drug induction (Regimen B). A small number of NCI standard-risk pre-B ALL patients initially treated with Regimen A who were later found to have high-risk cytogenetics (MLL [KMT2A] rearrangements, near-haploidy/low-hypodiploidy) were switched to Regimen C induction on day 15. Bone marrow examination was performed at the end of induction for disease assessment and treatment response. Bone marrow aspirate morphology and minimal residual disease (MRD) by flow cytometry were performed at end of induction. Complete remission (CR) was defined as morphological remission (blasts <5%) with negative MRD (<0.01% by flow cytometry). MRD risk was defined as MRD ≥0.01%. Bone marrow examination and end-of-consolidation flow MRD were repeated in patients who were MRD risk after induction.
Only a few modifications were made to the standard arm of the UKALL 2011 trial protocol and UKALL 2019 Interim Guidelines. During Regimen A interim maintenance, patients received a single dose of intrathecal methotrexate on Day 15 instead of two doses on Days 15 and 43, to reduce neurotoxicity risk. Additionally, patients with good-risk cytogenetics (ETV6-RUNX1 translocation or hyperdiploidy) and end-of-induction MRD >0.01% (by flow cytometry) were escalated to intensive chemotherapy (Regimen C). This approach differed from the UKALL Interim 2019 guidelines and UKALL 2011 protocol, where patients with good-risk cytogenetics continued their original induction if MRD was <0.1%. This modification was adopted because flow cytometry–based MRD assessment was introduced at our center only at the end of September 2017 (the study start date), and escalation was intended to avoid undertreatment.
Statistical Analysis: Data analysis was performed using IBM SPSS (version 26.0). The primary outcome measures were 5-year overall survival (OS) and event-free survival (EFS). Survival outcomes were analyzed using Kaplan-Meier methods. OS was defined as the time from diagnosis to last follow-up or death, with censoring at the date of last follow-up. EFS was defined as the time from diagnosis to relapse, progression, abandonment, loss to follow-up, or death. Relapses were defined by morphology, flow cytometry, and site involvement based on the presence of leukemic blasts. Very early relapse was defined as within 18 months of diagnosis; early relapse as 18 months post-diagnosis and within 6 months after end of treatment; and late relapse as more than 6 months after the end of treatment.
Results
A total of 436 pediatric patients with precursor B-cell acute lymphoblastic leukemia were included in the study. The median age at diagnosis was 3 years (mean: 3.3 years; range: 1–7 years; IQR: 3–4). There was a male predominance, with 268 (61.5%) males and 168 (38.5%) females. The median follow-up duration was 46 months (range: 1–99 months; IQR: 24–64) (Table 1).
Table 1.
Biodemographic Characteristics of Study Population.
| Characteristic | Number (Percentage %) |
|---|---|
| Age | |
| Age, median (years) | 3 |
| Age, mean (years) | 3.3 |
| Age range (years) | 1–7 (IQR: 3–4) |
| Gender | |
| • Male | 268 (61.5%) |
| • Female | 168 (38.5%) |
| Follow up | |
| Follow-up, median (months) | 46 (IQR: 26–64) |
| Total Patients | 436 |
| Risk Group | |
| Standard-risk | 420 (96.3%) |
| High-risk | 16 (3.7%) |
| CNS involvement | 2 (<1%) |
| CNS 2 | 1 |
| CNS 3 | 1 |
| Testicular Involvement | 5 (1.1%) |
| Treatment Regimen | |
| Standard-risk | 420 (96.3%) 3 Drug Induction |
| High-risk | 16 (3.7%) (4 Drug Induction) |
Most patients were classified as standard-risk (420/436, 96.3%), while 16 patients (3.7%) were categorized as high-risk. CNS involvement was identified in two patients (<1%), including one with CNS-2 and one with CNS-3 status. Testicular involvement was observed in five patients (1.1%). Standard-risk patients received a three-drug induction regimen, while high-risk patients received a four-drug induction regimen (Table 1).
FISH/karyotype analysis was performed in all 436 patients, with no result obtained in 5 cases (Table 2). The most common finding was a normal karyotype (336 patients). Among abnormal cytogenetic findings, TEL-AML/ETV6-RUNX1 translocation was seen in 72 patients, hyperdiploidy in 11, and BCR-ABL translocation in 6. Less frequent abnormalities included t(1;19) in 3 patients, MLL gene rearrangement in 2, and hypotriploidy in 1 patient. No cases of hypodiploidy/haploidy were identified (Table 2).
Table 2.
Details of FISH/Karyotype.
| FISH / Karyotype | Number of Patients |
|---|---|
| Performed in all patients | 436 |
| No result/not performed | 5 |
| TEL-AML/ETV6/RUNX1 translocation | 72 |
| MLL Gene rearrangement | 2 |
| BCR ABL translocation | 6 |
| Hyperploidy | 11 |
| Hypodiploidy or Haploidy | 0 |
| Hypotriploidy | 1 |
| Translocation (1:19) | 3 |
| Normal Karyotype | 336 |
Post-induction bone marrow examination (BME) was performed in 389 patients (89.2%); 47 patients (10.8%) did not undergo BME due to illness or death. Among standard-risk patients who underwent BME (n=373), complete remission following induction therapy was achieved in 305 (81.8%). MRD positivity at the end of induction (≥0.01% by flow cytometry) was observed in 65 (17.4%), while three (0.8%) had MRD levels ≥5%. At the end of consolidation therapy, 13 (3.5%) remained MRD-positive. Among high-risk patients (n=16), complete remission was achieved in 12 (75.0%). MRD positivity at the end of induction was seen in four (25%), while two (12.5%) remained MRD-positive following consolidation therapy (Table 3).
Table 3.
Details about Treatment Response.
| Remission Status | Number (Percentage %) |
|---|---|
| Total patients | 436 |
| • Post induction Bone marrow examination (BME) performed | 389 (89.2%) |
| • Post induction number of patients who did not have BME | 47 (10.8%) |
| Standard risk Patient who had BME (n = 373) | |
| • Complete remission post induction (Minimal residual disease MRD on FCM) ≤0.01 | 305 (81.8%) |
| • MRD-positive end of induction (≥0.01 on FCM) | 65 (17.4%) |
| • MRD-positive end of induction (≥5% on FCM) | 3 (0.8%) |
| • MRD-positive end of consolidation (≥0.01 on FCM) | 13 (3.5%) |
| High risk (n = 16) | |
| • Complete remission | 12 (75.0%) |
| • MRD-positive at end of induction | 4 (25%) |
| • MRD Positive end of consolidation | 2 (12.5%) |
Overall, 374 patients achieved complete remission. Relapse occurred in 56 patients (14.9%) who achieved remission. By timing, early relapse was most common (23 patients, 41.1%), followed by late relapse (20, 35.7%) and very early relapse (13, 23.2%). By site, isolated bone marrow relapse was most frequent (30, 53.6%), followed by combined relapse (16, 28.6%) and isolated CNS relapse (10, 17.8%) (Table 4).
Table 4.
Relapse Details of the Included Patients.
| Characteristic | Number of patients (%) |
|---|---|
| Total Patients in complete remission | 374 |
| Total number of relapses | 56 (14.9%) * |
| Type of Relapse based on Timing | Total 56 |
| Very early relapse | 13 (23.2%) |
| Early relapse | 23 (41.1%) |
| Late relapse | 20 (35.7%) |
| Type of Relapse based on involved site | Total 56 |
| Isolated Bone marrow relapse | 30 (53.6%) |
| Isolated CNS relapse | 10 (17.8%) |
| Combined Relapse | 16 (28.6) |
The overall mortality rate was 26.1% (114/436), while induction-related mortality accounted for 11.7% (51/436). Sepsis was the leading cause of death (74, 59.7%), followed by relapse (36, 29%), refractory disease (3, 2.4%), and other causes (11, 8.9%). Five patients (1.1%) abandoned treatment, and 13 (2.9%) were lost to follow-up after completing therapy (Table 5). Five-year overall survival (OS) and event-free survival (EFS) were 75.8% (95% CI: 72.1–79.5) and 66.4% (95% CI: 62.5–70.4), respectively (Figures 1 and 2).
Table 5.
Mortality related Statistics of the Study Population.
| Characteristic | Number of patients (%) |
|---|---|
| Total Patients | 436 |
| Overall mortality | 114 (26.1%) |
| Induction mortality | 51 (11.7%)* |
| Causes of death | |
| Sepsis | 74 (59.7%) |
| Relapse | 36 (29%) |
| Refractory disease | 3 (2.4%) |
| Other causes | 11 (8.9%) |
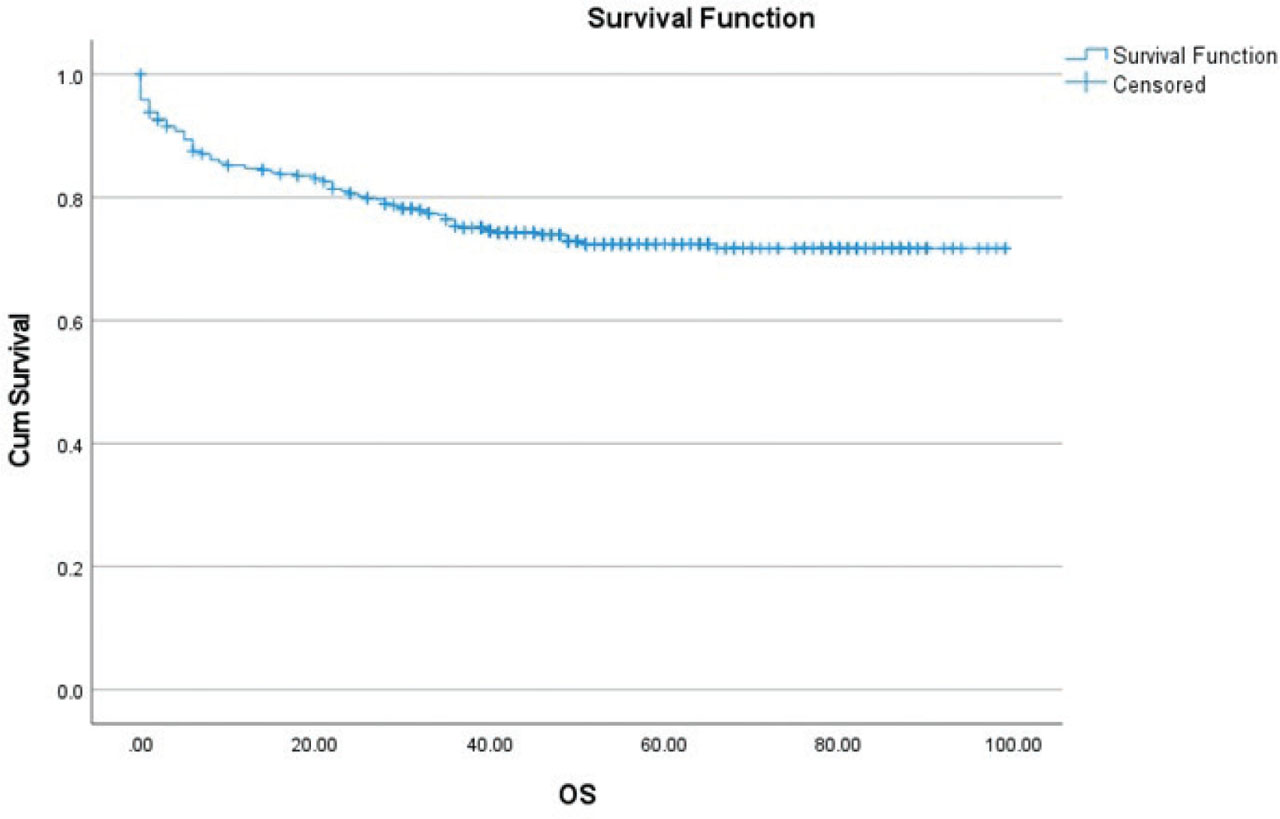
Figure 1.
Five-year overall survival (OS) of precursor B cell acute lymphoblastic lymphoma patients cohort treated at our centre.
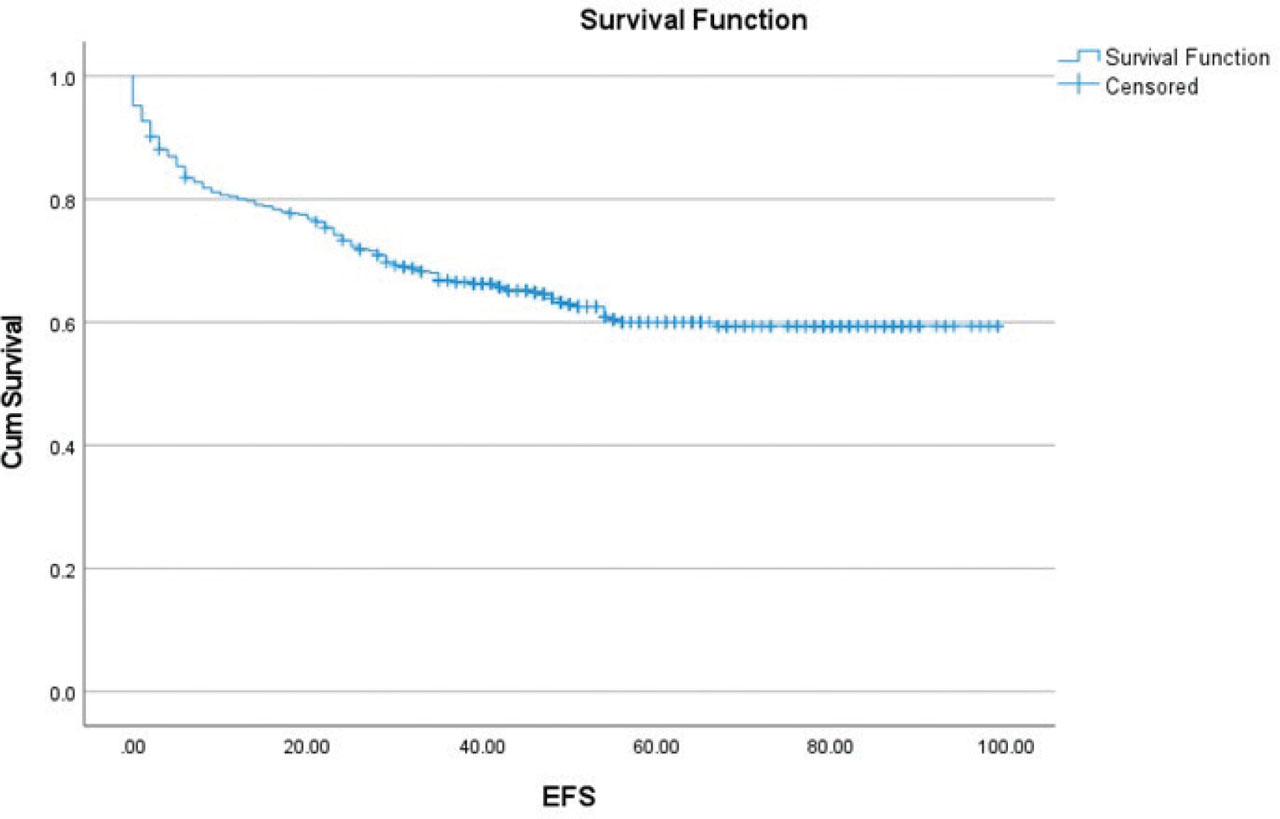
Figure 2.
Five-year event free survival (EFS) of precursor B cell acute lymphoblastic lymphoma patients cohort treated at our centre.
Discussion
Pediatric Precursor B-cell acute lymphoblastic leukemia (Pre B ALL) has excellent outcomes in high-income countries (HICs). However, outcomes in low- and middle-income countries (LMICs) remain inferior. Our study, conducted at a tertiary care cancer center in Pakistan, provides important real-world insights into the clinical profile, treatment response, and outcomes of children with precursor B-cell Acute Lymphoblastic Leukemia in a resource-constrained setting. The cohort was characterized by a young median age of 3.3 years (range, 1–7 years), which aligns with the reported peak incidence of acute lymphoblastic leukemia between 2 and 5 years of age (8,9). There was a male predominance, consistent with the known epidemiology of pediatric acute lymphoblastic leukemia (9). Most children were treated under the standard-risk category (96.3%), consistent with other studies from low-income countries (10,11,12). However, the proportion of high-risk (HR) patients in our cohort was lower than that reported in comparable studies (13,14). The predominance of younger children and the small number of HR patients likely reflect the referral pattern at our tertiary care cancer center. Therefore, the observed age distribution and small proportion of HR patients is representative of our institutional referral population rather than the result of selection bias.
Regarding cytogenetic findings, the predominance of the TEL-AML/ETV6-RUNX1 translocation in our cohort is consistent with its known frequency in Pre B ALL and its association with a favorable prognosis. In contrast, high-risk cytogenetic abnormalities such as BCR-ABL translocation and MLL rearrangement were infrequent. The absence of hypodiploidy/haploidy, another poor prognostic feature, may partly reflect the relatively lower prevalence of adverse cytogenetic profiles in our study population. Notably, none of the patients with t(1;19) experienced relapse or CNS relapse. Testing for t(17;19) and iAMP21 was not available at our center.
The post-induction complete remission rate of 81.8% (n = 373) observed in standard-risk patients is encouraging; however, it remains lower than the >90% remission rates reported in high-income countries. Nevertheless, these findings are comparable to data from other low- and middle-income settings, including India, where post-induction complete remission rates of approximately 70% have been reported (15). Another study from South America reported a 73.2% remission rate after induction (14). Importantly, the burden of minimal residual disease (MRD) at the end of induction (17.4% in standard-risk patients) is clinically meaningful, as MRD is one of the strongest predictors of relapse in Acute Lymphoblastic Leukemia (10,11). The persistence of MRD at the end of consolidation, albeit in a smaller proportion of patients, highlights a subgroup with suboptimal treatment response who may benefit from alternative therapeutic strategies such as blinatumomab, a bispecific CD3/CD19 T-cell engager. These findings emphasize the need to integrate MRD-guided risk stratification into routine clinical practice to optimize outcomes in cancer centers in LMICs.
The overall relapse rate of 14.9% observed in this study is comparable to that reported in various cohorts from Pakistan (13.2% and 14.8%), South America (19.8%), India (25%), and Indonesia (55.5%) (11,12,13,14,18). The predominance of bone marrow relapse (53.6%) is consistent with the natural history of acute lymphoblastic leukemia and has been observed in studies from both LMICs and HICs (15,17). A substantial proportion of relapses (64.3%; 36/56) occurred early or very early, which is typically associated with inferior survival outcomes. In LMIC settings, prognosis following relapse is further compromised by limited access to advanced salvage therapies, including immunotherapy, hematopoietic stem cell transplantation, and cellular therapies such as chimeric antigen receptor T-cell (CAR-T) therapy, largely because of financial and infrastructural constraints.
The overall mortality rate of 26.1% remains a major concern and represents one of the most significant barriers to improving survival. Reported survival rates in LMICs vary widely, ranging from 22% to 79% (16). Recently, one study from Pakistan reported 30% overall mortality and 12.3% induction mortality (13). Induction-related mortality alone accounted for 11.7% (51/436) of all patients in this study. Another study from Pakistan reported an induction mortality of 15.4% (18). Sepsis was the cause of death in 67.8% (n = 74) of deaths, which is comparable to figures reported from South America (89.6%) and Pakistan (64.8%) (13,14). The high mortality related to infection highlights the need for comprehensive supportive care, strict infection prevention measures, timely access to broad-spectrum antimicrobials, and greater awareness of sepsis among affected families. The contribution of relapse to mortality (29%) further illustrates the dual challenge of disease control and treatment-related toxicity. Treatment abandonment and loss to follow-up were very low in our cohort, with only 5 (1.1%) patients abandoning treatment and 13 (2.9%) lost to follow-up after completion of therapy. Treatment abandonment is an important contributor to poor survival in LMICs. Multiple studies from Pakistan have reported treatment abandonment rates ranging from 2.3% to 46.1% (13,19,20,21). A study from Indonesia reported a treatment abandonment rate of 21.9%, while a South American study reported 13% (14,16). Effective counseling, close clinical monitoring, and the provision of free medicines and accommodation during treatment likely contributed to the lower treatment abandonment rate observed in our study. Nevertheless, even small proportions of treatment discontinuation and post-therapy attrition remain clinically significant, as they can adversely affect long-term outcome assessment, timely identification of relapse or late complications, and overall survival estimates.
Despite these challenges, the estimated 5-year overall survival (OS) of 75.8% (95% CI 72.12–79.48) and event-free survival (EFS) of 66.4% (95% CI 62.5–70.4), with a median follow-up of 46 months (IQR: 26–64), are encouraging and suggest that meaningful long-term outcomes can be achieved even in resource-limited settings. Our results are comparable to OS and EFS rates reported from Karachi and Rawalpindi. Nisar et al. and Ahmed et al. reported OS rates of 72.9% and 70.6%, and EFS rates of 59.2% and 68.3%, respectively. Similar outcomes have also been reported by Duffy Caitlyn et al. from South America, with OS and EFS rates of 74.4 ± 3.0% and 62.5 ± 3.3%, respectively (14). However, these outcomes remain inferior to those reported in high-income countries, where survival rates for pediatric Acute Lymphoblastic Leukemia exceed 85–90%. The survival gap is likely attributable not only to differences in disease biology and treatment protocols but also, more importantly, to disparities in supportive care, early diagnosis, treatment adherence, and the availability of advanced diagnostics such as MRD monitoring.
The strengths of this study include a relatively large cohort of pediatric precursor B-cell acute lymphoblastic leukemia from a tertiary care center in Pakistan, detailed clinical and survival data, and reasonable follow-up. The very low rates of treatment abandonment and loss to follow-up further enhance the reliability of outcome assessment. However, this was a single-center retrospective study, and the predominance of younger children and low-risk patients in our cohort resulted in a lower proportion of high-risk patients than in many previously published studies. The limited number of high-risk patients reduced the statistical power of subgroup analyses and may have affected the precision of overall survival estimates for the cohort. The lack of advanced molecular testing, including t(17;19) and iAMP21, may have resulted in the under-identification of high-risk cytogenetic subgroups.
In conclusion, this study demonstrates that while substantial progress has been made in the management of pediatric precursor B cell acute lymphoblastic leukemia in resource-constrained LMIC settings, significant challenges remain, particularly with respect to treatment-related mortality and relapse. Addressing these issues through improved supportive care, risk-adapted therapy, and health system strengthening will be crucial to achieving outcomes comparable to those in high-resource environments.
Acknowledgments
We acknowledge the effort made by Miss Afshan Khanum and Dr. Farhan Babar and Dr. Shahid Mehmood from cancer registry.
Notes
[3] Contributed by Author contributions
Conceived and designed the analysis: NAB, NS.
Collected the data: AA, HMMW, SS.
Contributed data: NS, AR, IIS, HA, AT.
Performed the analysis: NAB, NS.
Wrote the paper: NAB, NJS.