
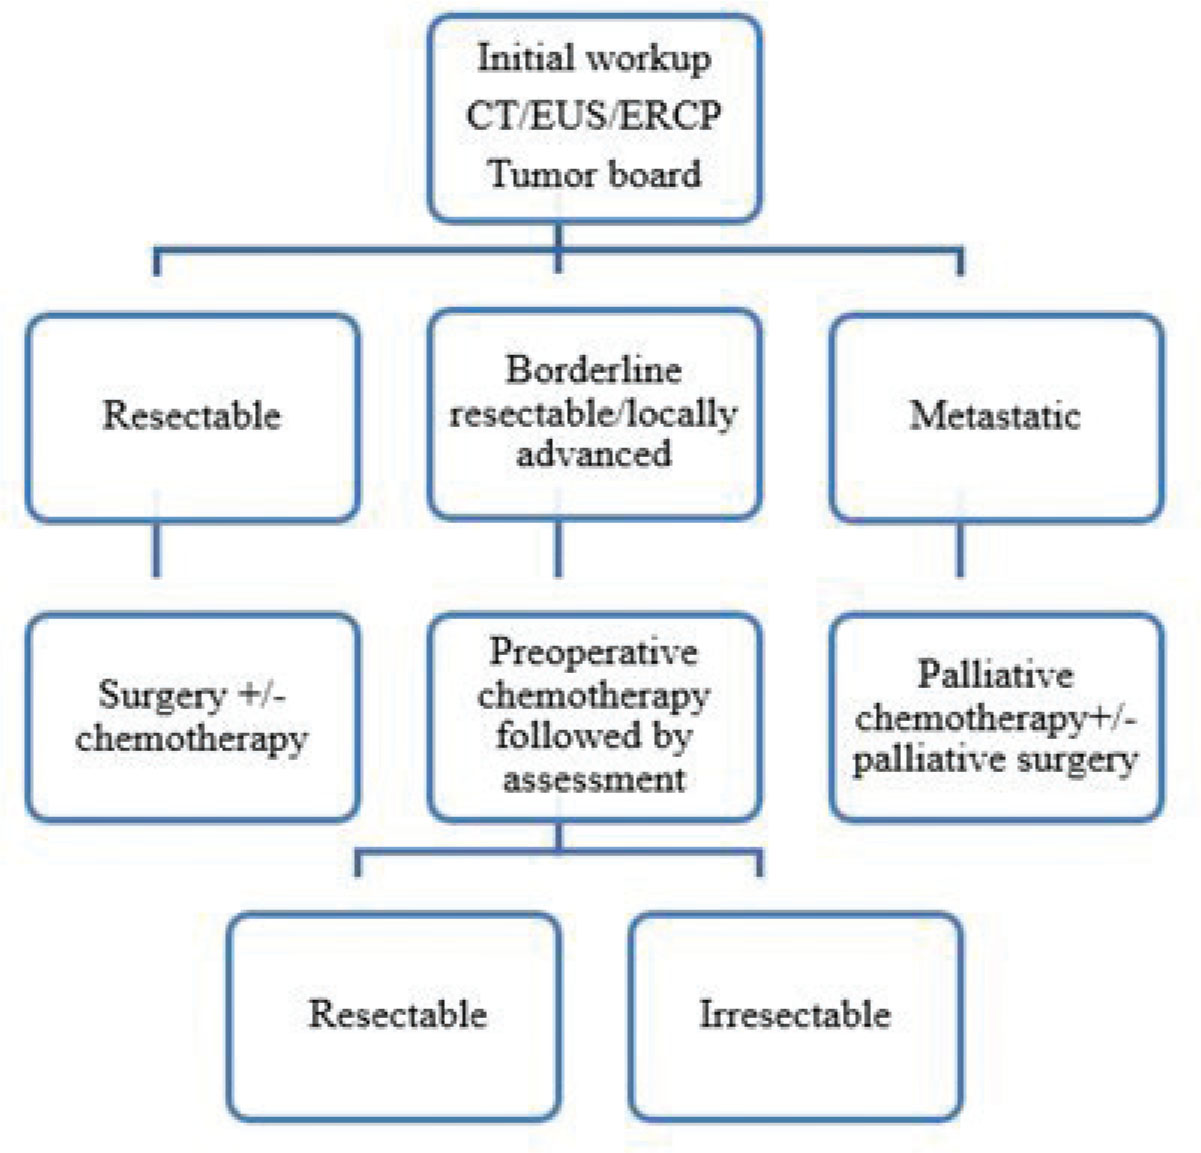
Figure 1.
Patient flow at Shaukat Khanum Memorial Cancer Hospital, Pakistan.
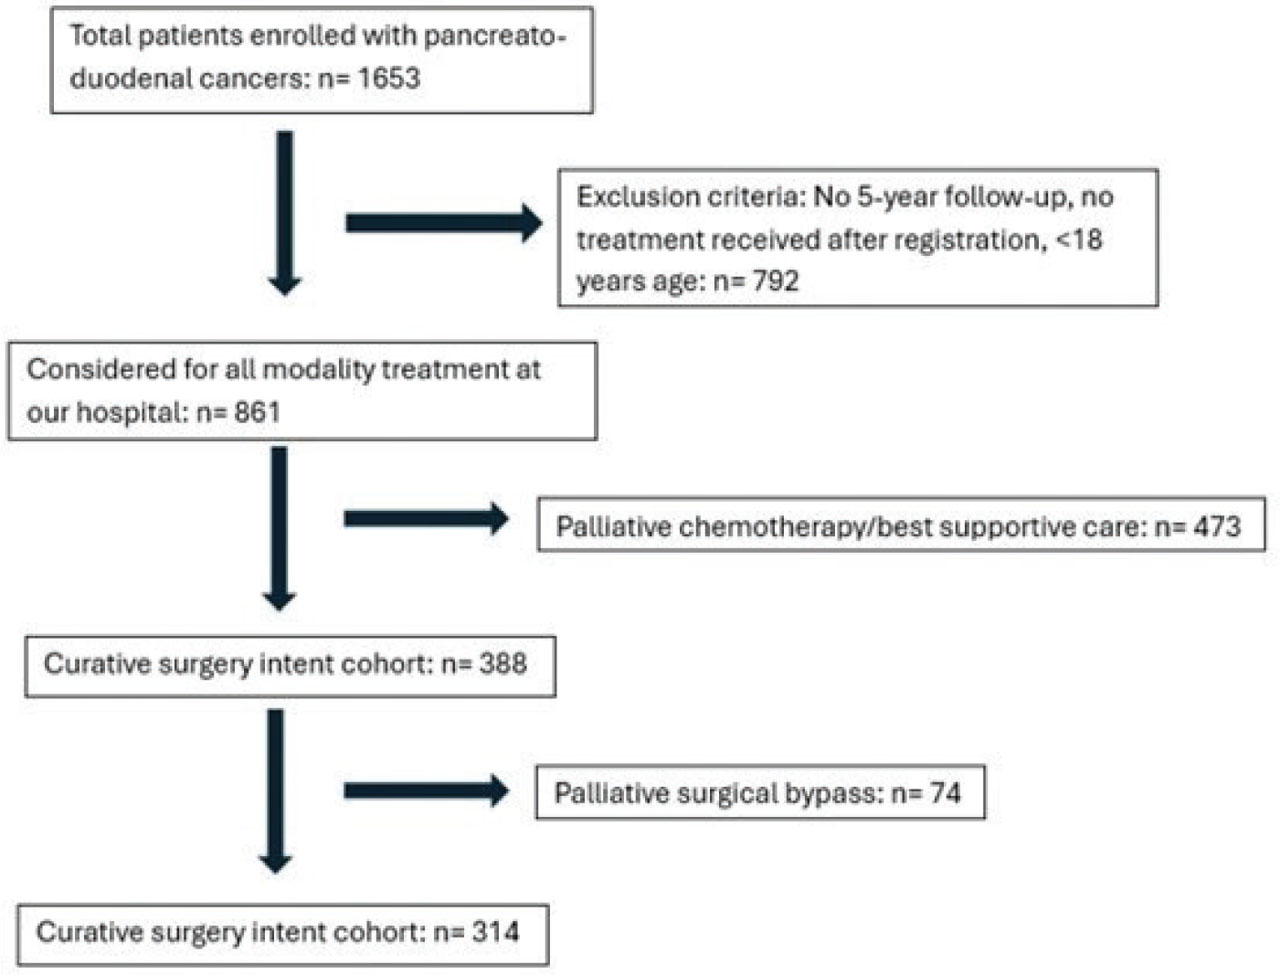
Figure 2.
Selection of study population.
Table 1.
Patient Characteristics.
| VARIABLES | VALUES | |
|---|---|---|
| Age – Mean | 53 ±/− 13.62 | |
| Age – Category | Below 60 years | 629 (73%) |
| Above 60 years | 232 (27%) | |
| Gender | Male | 585 (68%) |
| Female | 276 (32%) | |
| ECOG | ECOG 0 | 338 (39.3%) |
| ECOG 1 | 470 (54.6%) | |
| Co-morbidities | Smoking | 160 (18.6%) |
| Hypertension | 149 (17.4%) | |
| Diabetes mellitus | 139 (16.1%) | |
| IHD | 32 (3.7%) | |
| Presenting symptoms | Jaundice | 556 (64.6%) |
| Abdominal pain | 230 (26.7%) | |
| Weight loss | 49 (5.7%) | |
| Vomiting | 26 (3%) |
Table 2.
Peri-operative Characteristics.
| VARIABLES | VALUES | |
|---|---|---|
| Pre-operative ERCP | Yes | 706 (82%) |
| No | 155 (18%) | |
| EUS | Yes | 528 (61.4%) |
| No | 333 (38.6%) | |
| Histological Diagnosis | Duodenal | 265 (30.8%) |
| Peri-ampullary | 398 (46.2%) | |
| Pancreatic | 154 (17.9%) | |
| Distal bile duct | 44 (5.1%) | |
| TNM-stage | Stage 1 | 106 (12.4%) |
| Stage 2 | 128 (14.9%) | |
| Stage 3 | 155 (18%) | |
| ASA grade | ASA II | 279 (72%) |
| ASA III | 77 (20%) | |
| ASA IV | 31 (8%) | |
| Surgical procedure | Pancreatico-duodenectomy | 254 (65.4%) |
| Distal pancreatectomy | 56 (14.4%) | |
| Total pancreatectomy | 4 (1%) | |
| Palliative Bypass | 74 (19%) | |
| Complications | SSI | 90 (26.6%) |
| POPF (grade b) | 33 (9.8%) | |
| CD >3 | 72 (21.1%) | |
| Re-look laparotomy | 17 (4.7%) | |
| Margin status | R0 | 317 (93%) |
| R1 | 17 (5%) | |
| R2 | 7 (2%) | |
| Mortality | 30 days | 7 (2.1%) |
| 90 days | 18 (4.6%) | |
| Adjuvant chemotherapy | Yes | 222 (65%) |
| No | 119 (35%) | |
| Recurrence | Stage I | 12.5% |
| Stage II | 27.11% | |
| Stage III | 30.1% |
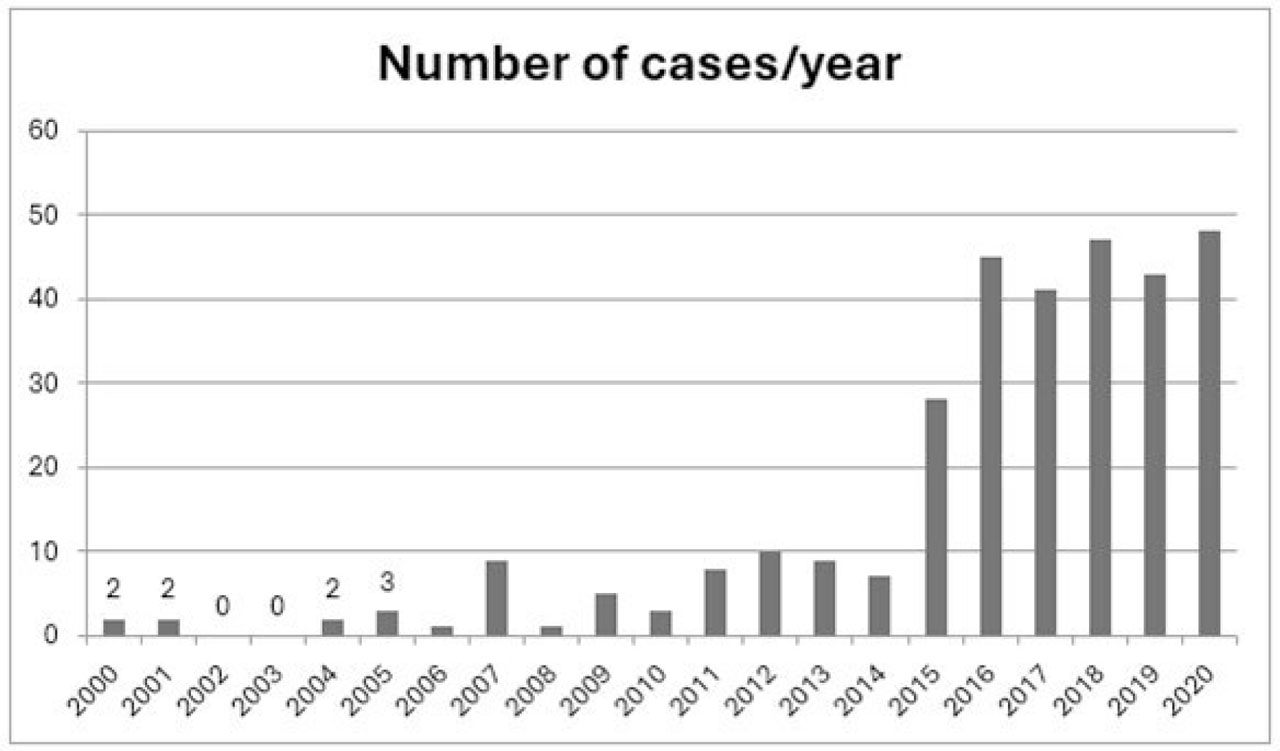
Figure 3.
Surgical volume per year – This graph shows significant increase in number since 2015 onwards.
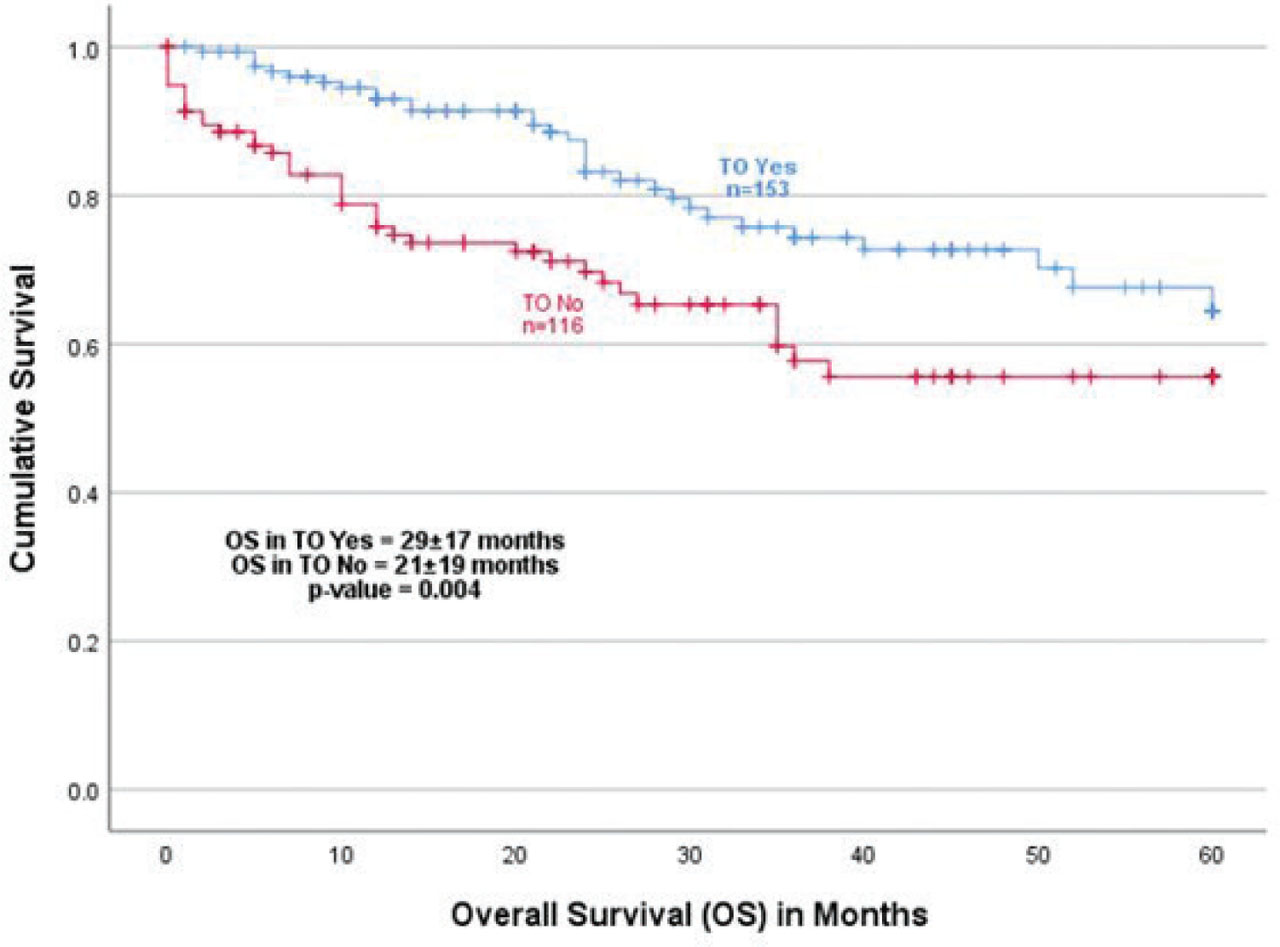
Figure 4.
Kaplan-Meier Overall Survival (OS) curves-based on achievement of Textbook Outcomes (TO). Those patients that achieved TO showed better DFS compared to those patients who did not achieve TO.
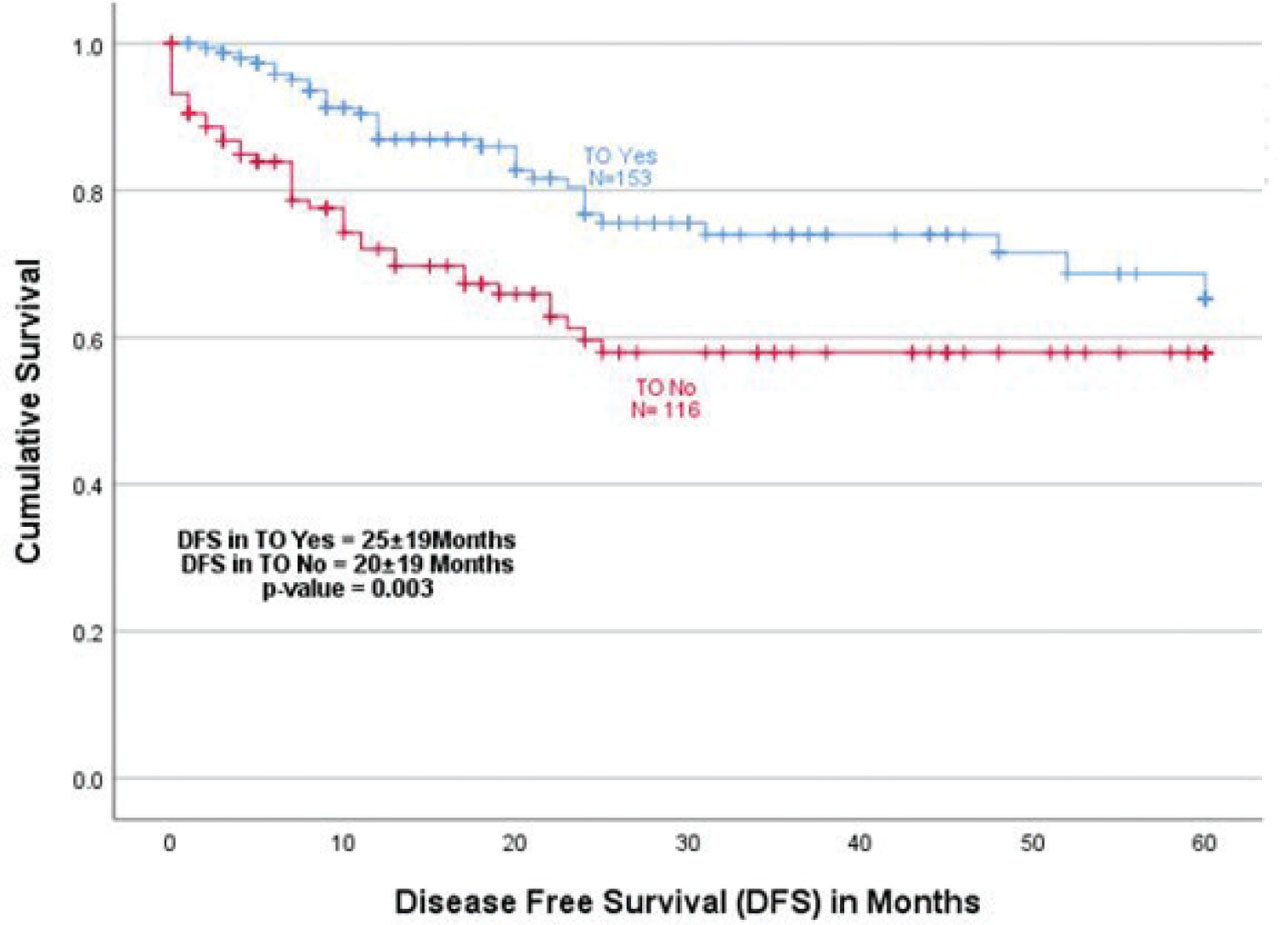
Figure 5.
Kaplan-Meier Disease Free Survival (DFS) curves-based on achievement of Textbook Outcomes (TO). Those patients that achieved TO showed better DFS compared to those patients who did not achieve TO.
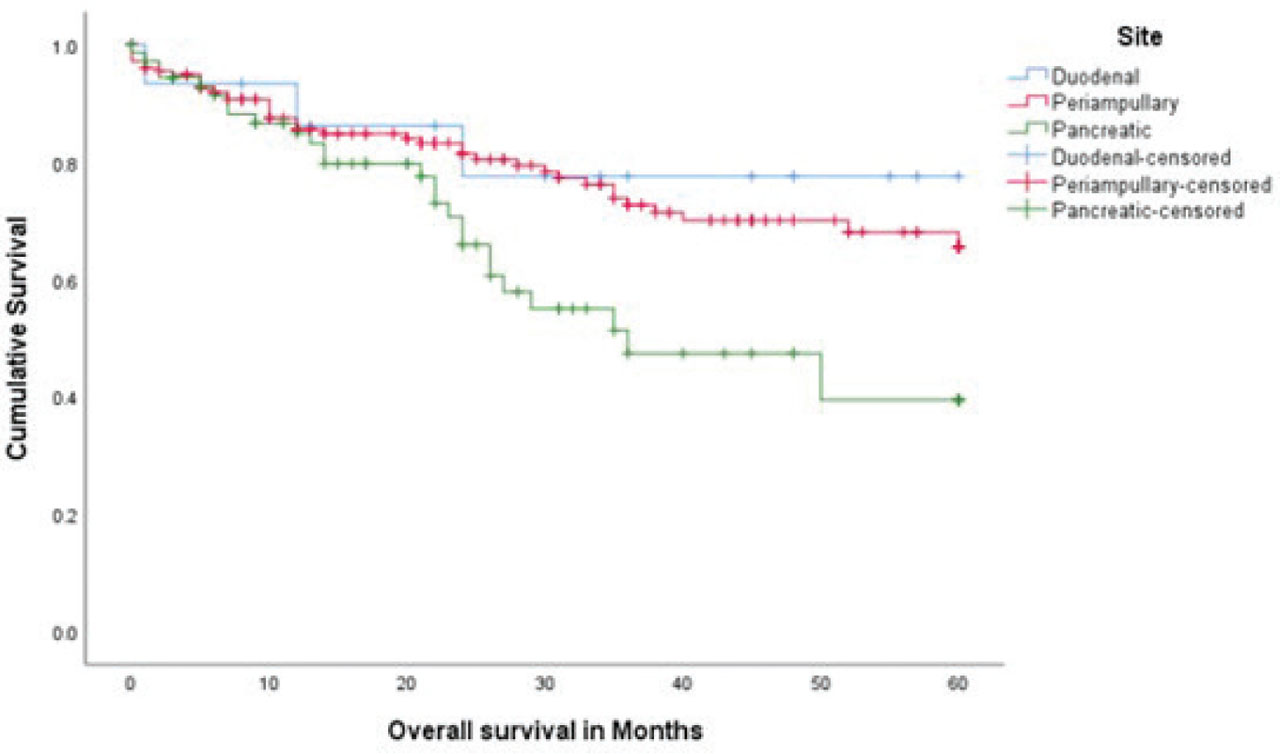
Figure 6.
Kaplan–Meier overall survival (OS) curves comparing patients according to primary tumor site, including duodenal, periampullary, and pancreatic tumors. Patients with duodenal tumors demonstrated the most favorable overall survival, with survival probabilities remaining relatively stable throughout the follow-up period. Patients with periampullary tumors showed intermediate survival outcomes, with a gradual decline in survival over time. In contrast, patients with pancreatic tumors exhibited the poorest prognosis, with a marked reduction in overall survival during the early and intermediate follow-up periods.
Table 3.
Cox regression analysis for OS in pancreato-duodenal cancers.
| Variable | Univariate HR (95% CI) | p-value | Multivariate HR (95% CI) | p-value |
|---|---|---|---|---|
| Pancreatic Fistula: | ||||
| No Fistula | 0.77 | 0.037 | ||
| Grade A | 0.450 (0.141–1.443) | 0.179 | 0.272 (0.079–0.937) | 0.039 |
| Grade B | 0.213 (0.056–0.804) | 0.22 | 0.133 (0.033–0.536) | 0.004 |
| Grade C | 0.302 (0.076–1.210) | 0.091 | 0.234 (0.05–0.972) | 0.046 |
| Margin Status | 0.466 (0.168–1.295) | 0.143 | 0.306 (0.138–0.677) | 0.003 |
| Lymph Nodes (LN) | 0.699 (0.437–1.117) | 0.133 | 0.846 (0.575–1.244) | 0.395 |
| Co-morbidities | 0.630 (0.393–1.010) | 0.055 | 0.695 (0.469–1.030) | 0.070 |
| Tumour Site: | 0.028 | 0.598 | ||
| Duodenal | ||||
| Periampullary | 0.398 (0.120–1.317) | 0.131 | 0.648 (0.244–1.722) | 0.384 |
| Pancreatic | 0.530 (0.323–0.869) | 0.012 | 0.840 (0.540–1.306) | 0.438 |
| Biliary Stent | 0.799 (0.419–1.523) | 0.495 | 1.195 (0.545–2.621) | 0.657 |
| Jaundice | 0.779 (0.372–1.630) | 0.507 | 0.713 (0.279–1.822) | 0.479 |
Table 4.
Cox regression analysis for DFS in pancreato-duodenal cancers.
| Variable | Univariate HR (95% CI) | p-value | Multivariate HR (95% CI) | p-value |
|---|---|---|---|---|
| Pancreatic Fistula: | ||||
| No Fistula | 0.281 | 0.486 | ||
| Grade A | 1.863 (0.259–13.397) | 0.537 | 1.473 (0.201–10.820) | 0.703 |
| Grade B | 1.469 (0.197–10.930) | 0.707 | 1.094 (0.144–8.321) | 0.931 |
| Grade C | 0.982 (0.123–7.856) | 0.986 | 0.947 (0.11–7.665) | 0.959 |
| Margin Status | 0.252 (0.120–0.528) | <0.001 | 0.306 (0.137–0.684) | 0.004 |
| Lymph Nodes (LN) | 0.793 (0.546–1.152) | 0.223 | 0.828 (0.561–1.223) | 0.343 |
| Co-morbidities | 0.672 (0.461–0.979) | 0.038 | 0.719 (0.484–1.069) | 0.103 |
| Tumour Site: | ||||
| Duodenal | 0.110 | 0.726 | ||
| Periampullary | 0.496 (0.194–1.272) | 0.145 | 0.681 (0.255–1.819) | 0.444 |
| Pancreatic | 0.673 (0.445–1.018) | 0.061 | 0.899 (0.574–1.406) | 0.640 |
| Biliary Stent | 0.895 (0.518–1.544) | 0.689 | 1.215 (0.548–2.697) | 0.632 |
| Jaundice | 0.696 (0.381–1.271) | 0.238 | 0.681 (0.261–1.776) | 0.432 |
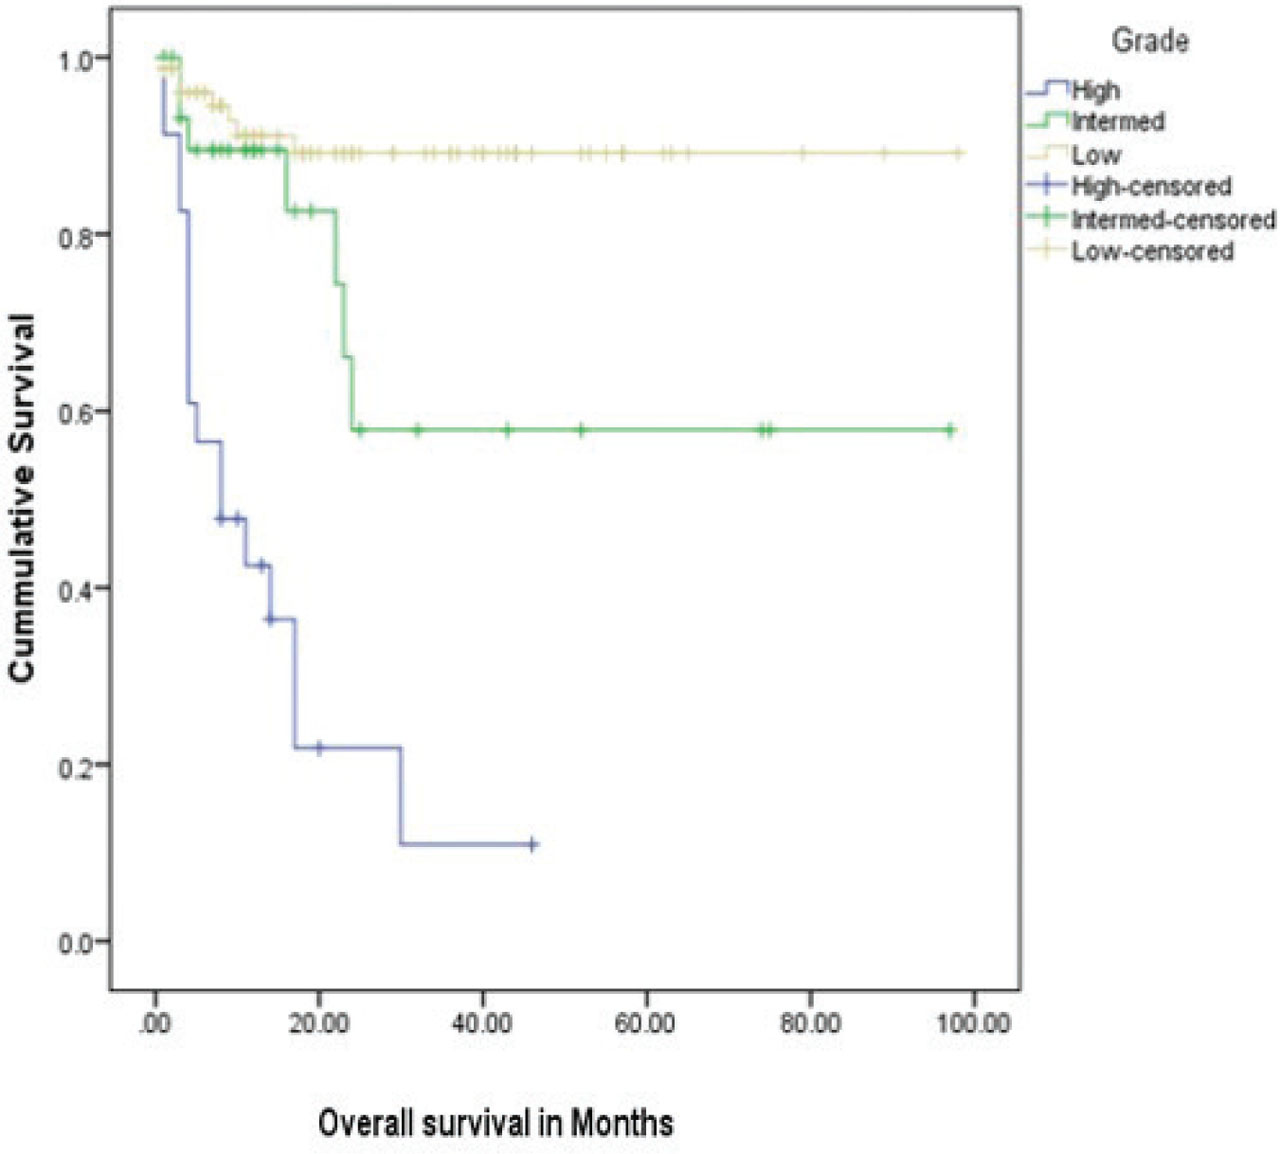
Figure 7.
Kaplan–Meier overall survival (OS) curves stratified according to tumor grade (high, intermediate, and low grade). Patients with low-grade tumors demonstrated the best overall survival outcomes, maintaining high survival probabilities throughout the duration of follow-up.
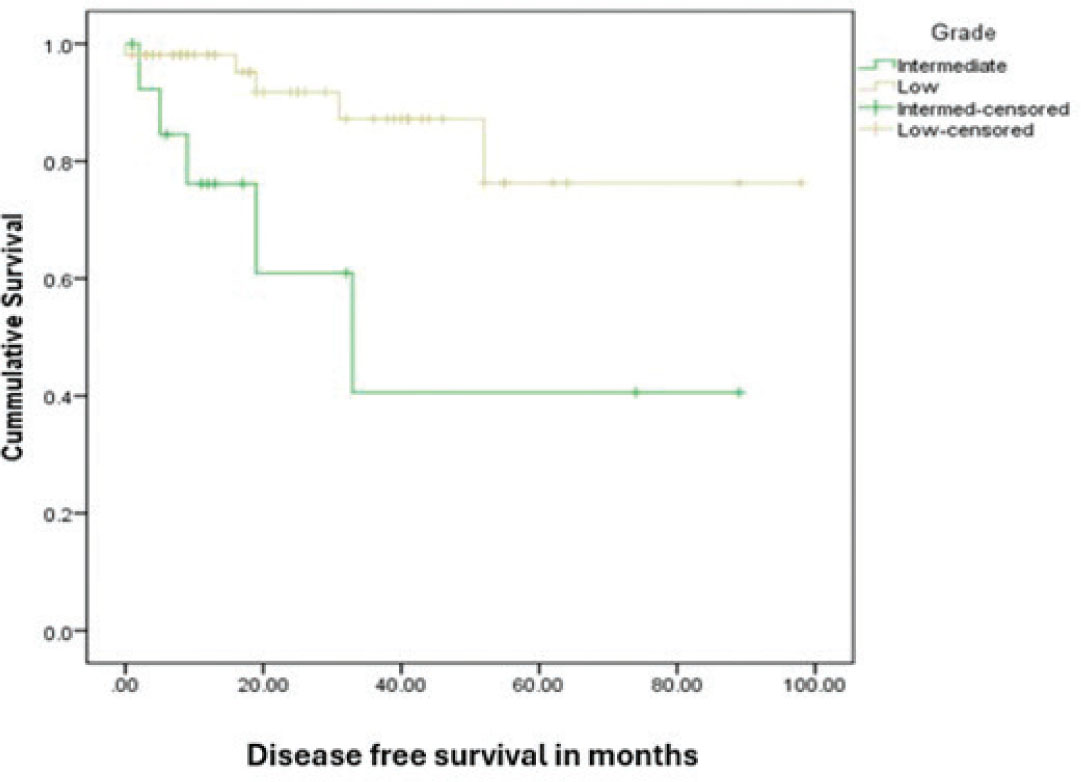
Figure 8.
Kaplan-Meier Disease Free Survival (DFS) curves based on grade of NET. Patients with low-grade tumors demonstrated superior disease-free survival.