
Table 1.
Patients demographics and treatment characteristics.
| Characteristics | Number (n) | Percentage (%) |
|---|---|---|
| Total number of patients | 246 | |
| Median Age (years) | 35 (18–77) | |
| Male | 153 | 62.2% |
| Female | 93 | 37.8% |
| ESR (≥50 mm/h) | 92 | 37.4% |
| Age at diagnosis (Years) | ||
| ≤45 | 145 | 58.9% |
| 46–64 | 81 | 32.9% |
| >64 | 20 | 8.1% |
| Ann Arbor stage | ||
| I | 23 | 9.3 % |
| II | 57 | 23.2% |
| III | 68 | 27.6% |
| IV | 100 | 40.7% |
| Bulky Disease | 22 | 8.9% |
| Extranodal Disease | 46 | 18.7% |
| Bone Marrow Involvement | 51 | 20.7% |
| Combined Modality (Chemo-radiotherapy) | ||
| Early favourable | 4 | 1.6% |
| Early unfavourable | 17 | 6.9% |
| Advanced stage (III/IV) | 9 | 3.7% |
| Interim PET/CT Response | ||
| Deauville 1–3 | 174 | 70.7% |
| Deauville 4 | 63 | 25.6% |
| Deauville 5 | 9 | 3.7% |
| End of Treatment PET/CT Response | ||
| Deauville 1–3 | 176 | 71.5% |
| Deauville 4 | 4 | 1.6% |
| Deauville 5 | 39 | 15.9% |
| Relapse/Refractory | ||
| Primary refractory | 16 | 6.5% |
| Relapse after 3 months | 20 | 8.1% |
| Salvage therapy | ||
| Brentuximab-Bendamustine | 16 | 6.5% |
| DHAP | 9 | 3.7% |
| ICE | 6 | 2.4% |
| IGEV | 5 | 2.0% |
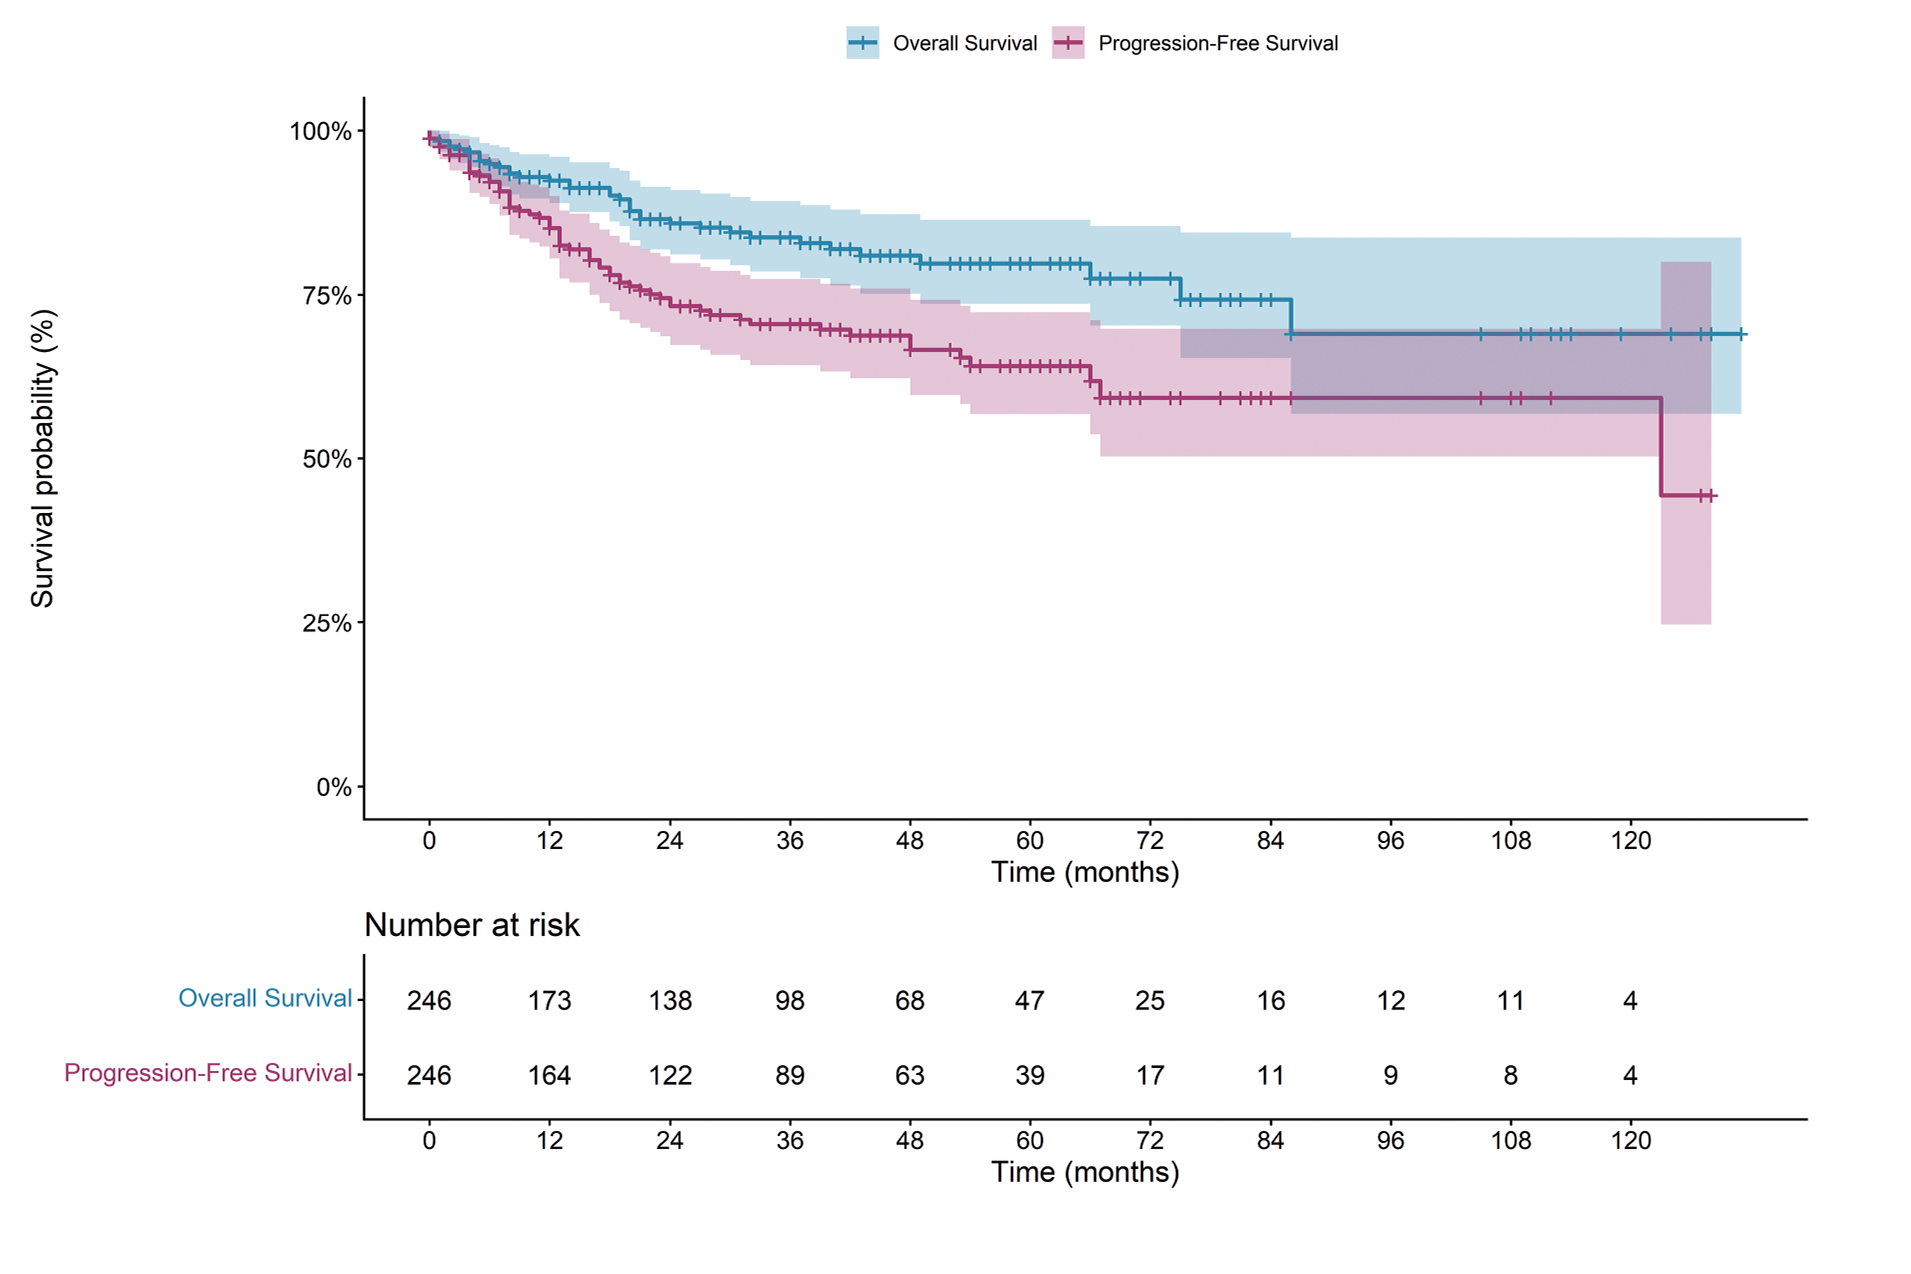
Figure 1.
Kaplan–Meier estimates of two-year and five-year overall survival and progression-free survival.
Table 2.
Log-rank analysis for overall-survival (OS) and progression-free survival (PFS) predictors
| Variable | OS Log-rank | p-value | PFS Log-rank | p-value |
|---|---|---|---|---|
| Age | 22.00 | <0.001*** | 6.04 | 0.049* |
| B symptoms | 1.89 | 0.169 | 2.06 | 0.152 |
| Bulky disease | 3.35 | 0.067 | 1.11 | 0.292 |
| Extra-nodal disease | 0.91 | 0.340 | 2.92 | 0.088 |
| Bone marrow involvement | 4.41 | 0.036* | 5.28 | 0.022* |
| IPS | 25.19 | <0.001*** | 25.12 | <0.001*** |
| Stage (Advance vs early) | 12.00 | 0.003** | 10.47 | 0.005** |
| Comorbidity (>1 vs ≤1) | 0.01 | 0.937 | 0.23 | 0.635 |
| WBC (≥15 vs <15 × 109/L) | 3.67 | 0.056 | 8.99 | 0.003** |
| ALC (<0.6 vs ≥0.6 × 10⁹/L) | 3.63 | 0.057 | 0.42 | 0.515 |
| Hemoglobin (<105 vs ≥105 g/L) | 17.53 | <0.001*** | 7.01 | 0.008** |
| Albumin (<40 vs ≥40 g/L) | 25.26 | <0.001*** | 19.49 | <0.001*** |
| ECOG (≥2 vs <2) | 32.57 | <0.001*** | 24.81 | <0.001*** |
| Histology | 1.86 | 0.603 | 5.78 | 0.123 |
| LMR (≤ 2.1 vs > 2.1) | 3.11 | 0.078 | 1.78 | 0.182 |
| AMC (> 750 vs ≤ 750 cells/mm3) | 1.11 | 0.293 | 0.52 | 0.471 |
| NLR (> 6 vs ≤ 6) | 5.51 | 0.019* | 12.50 | <0.001*** |
Table 3.
Results of univariate analysis for overall survival and progression-free survival predictors
| Variable | OS HR (95% CI) | p-value | PFS HR (95% CI) | p-value |
|---|---|---|---|---|
| Age | 2.26 (1.48 - 3.45) | <0.001*** | 1.42 (0.99 - 2.03) | 0.054 |
| B symptoms | 1.30 (0.46 - 3.66) | 0.616 | 1.67 (0.67 – 4.18) | 0.269 |
| Bulky disease | 1.87 (0.82 - 4.26) | 0.139 | 1.41 (0.67 - 2.96) | 0.367 |
| Extra-nodal disease | 1.38 (0.68 - 2.83) | 0.373 | 1.81 (1.06 - 3.10) | 0.031* |
| Bone marrow involvement | 2.29 (1.21 - 4.32) | 0.011** | 1.85 (1.09 - 3.13) | 0.023* |
| IPS | 1.18 (0.88 - 1.58) | 0.276 | 1.21 (0.96 - 1.53) | 0.109 |
| Stage (Advance vs early) | 7.23 (1.84 - 28.39) | 0.005** | 4.05 (1.85 - 8.85) | 0.001** |
| Comorbidity (>1 vs ≤1) | 1.01 (0.36 - 2.86) | 0.978 | 1.33 (0.53 - 3.32) | 0.543 |
| WBC (≥15 vs <15 × 109/L) | 1.85 (0.91 - 3.77) | 0.091 | 2.70 (1.56 - 4.66) | <0.001*** |
| ALC (<0.6 vs ≥0.6 × 10⁹/L) | 2.03 (0.85 – 4.84) | 0.113 | 1.21 (0.52 - 2.80) | 0.663 |
| Hemoglobin (<105 vs ≥105 g/L) | 2.65 (1.43 - 4.91) | 0.002** | 2.22 (1.36 - 3.63) | 0.001** |
| Albumin (<40 vs ≥40 g/L) | 2.69 (1.60 - 4.53) | <0.001*** | 2.28 (1.54 - 3.38) | <0.001*** |
| ECOG (≥2 vs <2) | 7.64 (3.29 - 17.75) | <0.001*** | 5.23 (2.47 - 11.11) | <0.001*** |
| Histology | 1.15 (0.96 - 1.38) | 0.126 | 1.19 (1.03 - 1.38) | 0.021* |
| LMR (≤ 2.1 vs > 2.1) | 1.44 (0.77 - 2.70) | 0.254 | 1.48 (0.89 - 2.45) | 0.128 |
| AMC (> 750 vs ≤ 750 cells/mm3) | 1.26 (0.68 - 2.33) | 0.459 | 1.10 (0.67 - 1.80) | 0.697 |
| NLR (> 6 vs ≤ 6) | 1.80 (0.97 - 3.37) | 0.064 | 2.48 (1.51 - 4.06) | <0.001*** |
Table 4.
Multivariable Cox proportional hazards regression analysis for overall survival and progression-free survival predictors
| Variable | OS HR (95% CI) | p-value | PFS HR (95% CI) | p-value |
|---|---|---|---|---|
| Age | 2.00 (1.15 - 3.47) | 0.014* | 1.24 (0.77 - 1.97) | 0.374 |
| B symptoms | 1.49 (0.40 - 5.53) | 0.548 | 1.59 (0.58 – 4.38) | 0.367 |
| Bulky disease | 2.94 (1.09 – 7.94) | 0.034* | 1.68 (0.75 – 3.79) | 0.211 |
| Extra-nodal disease | 1.26 (0.55 - 2.89) | 0.586 | 1.04 (0.56 - 1.95) | 0.894 |
| Bone marrow involvement | 1.15 (0.55 – 2.40) | 0.715 | 1.01 (0.56 – 1.83) | 0.973 |
| IPS | 1.41 (0.73 – 2.74) | 0.305 | 1.23 (0.74 - 2.05) | 0.432 |
| Stage (Advance vs early) | 6.80 (1.07 - 43.28) | 0.043* | 3.24 (0.93 - 11.35) | 0.066 |
| WBC (≥15 vs <15 × 109/L) | 1.42 (0.54 - 3.74) | 0.475 | 1.77 (0.89 – 3.55) | 0.107 |
| ALC (<0.6 vs ≥0.6 × 10⁹/L) | 1.67 (0.55 – 5.02) | 0.363 | 1.04 (0.39 - 2.77) | 0.946 |
| Hemoglobin (<105 vs ≥105 g/L) | 1.50 (0.66 – 3.39) | 0.331 | 1.38 (0.72 – 2.64) | 0.332 |
| Albumin (<40 vs ≥40 g/L) | 1.62 (0.81 – 3.25) | 0.175 | 1.44 (0.84 - 2.45) | 0.185 |
| ECOG (≥2 vs <2) | 3.81 (1.22 - 11.97) | 0.022* | 3.99 (1.47 - 10.86) | 0.007** |
| Histology | 1.22 (0.99 - 1.50) | 0.059 | 1.17 (1.00 - 1.38) | 0.051 |
| LMR (≤ 2.1 vs > 2.1) | 1.46 (0.65 - 3.27) | 0.361 | 1.44 (0.75 - 2.76) | 0.273 |
| NLR (> 6 vs ≤ 6) | 1.08 (0.49 - 2.44) | 0.828 | 1.72 (0.91 – 3.28) | 0.097 |