
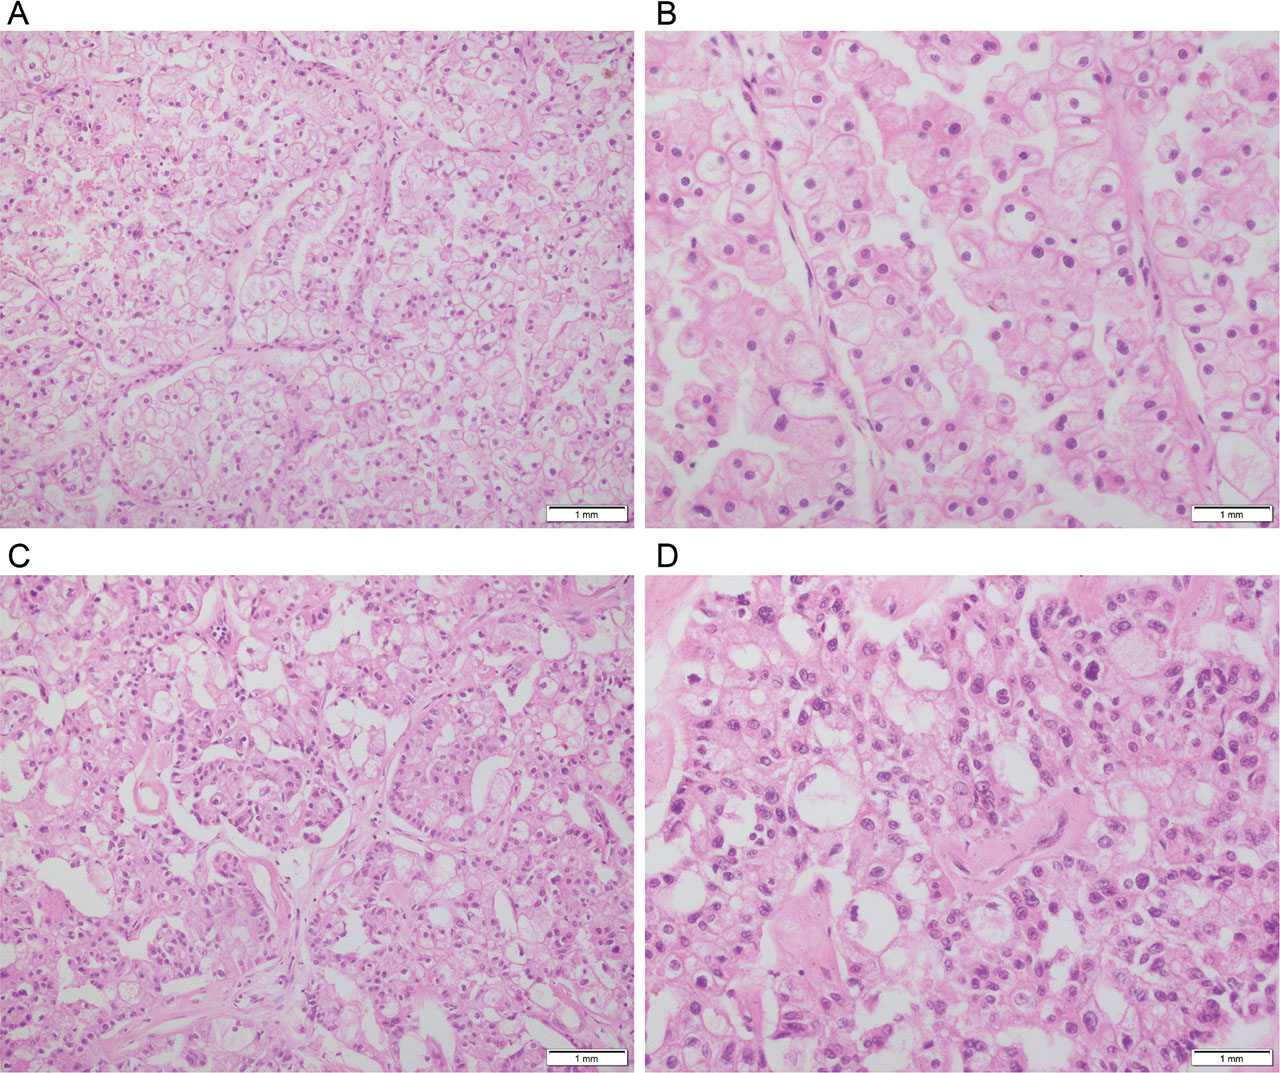
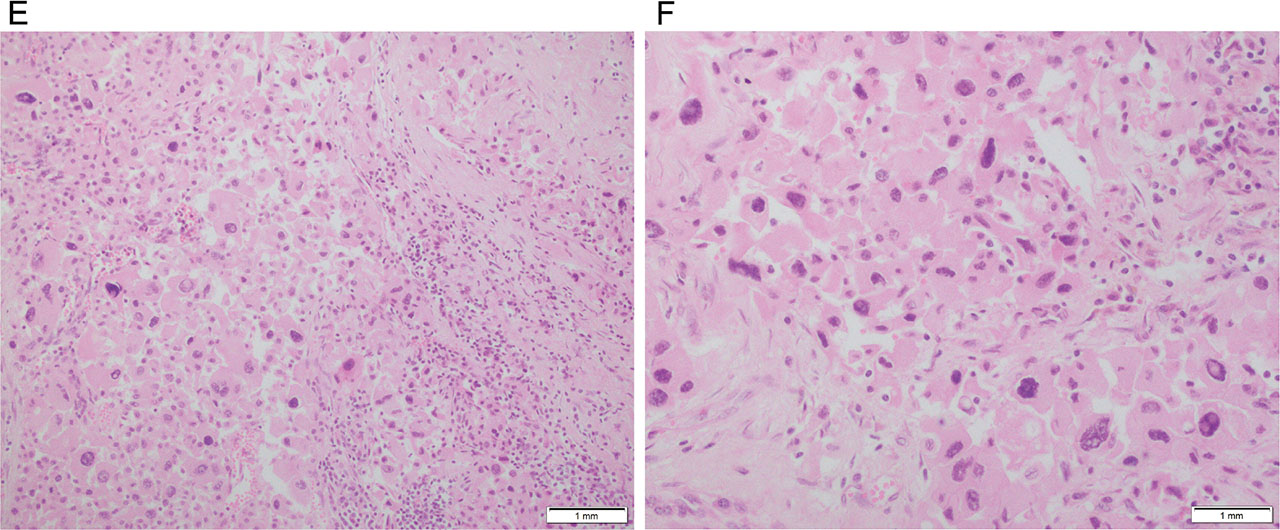
Figure 1.
Chromophobe tumor grades. A, Chromophobe tumor grade 1 (H&E 20X). B, Chromophobe tumor grade 1 (H&E 40X). C, Chromophobe tumor grade 2 (H&E 20X). D, Chromophobe tumor grade 2 (H&E 40X). E, Chromophobe tumor grade 3 (H&E 20X). F, Chromophobe tumor grade 3 (H&E 40X).
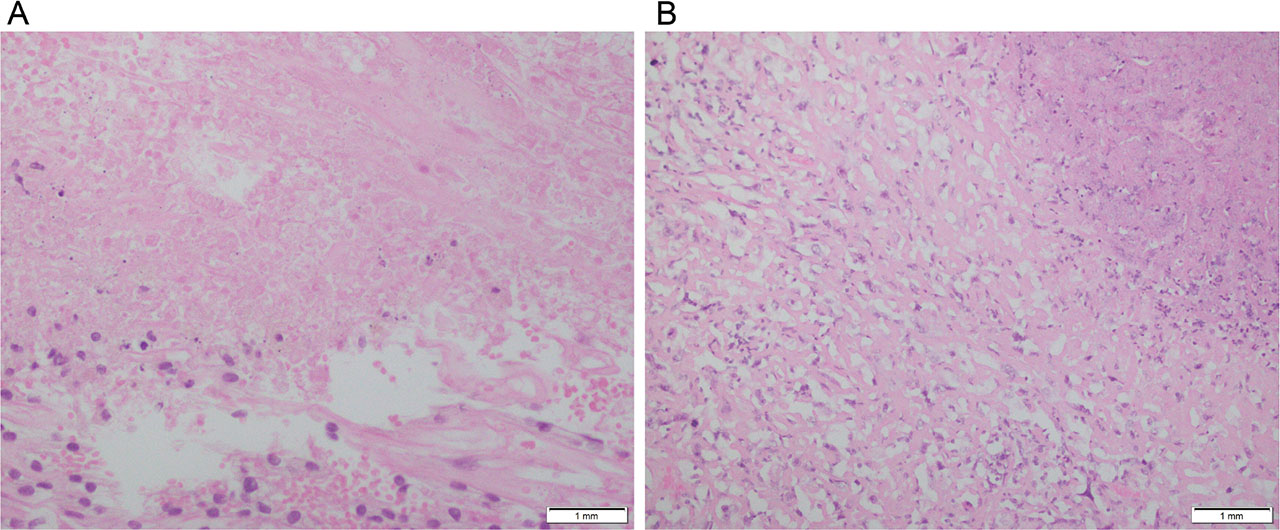
Figure 2.
A, Sarcomatoid differentiation with area of necrosis (H&E 40X). B, Necrosis (H&E 40X).
Table 1.
Summary of Clinical and Pathological Features for 51 Patients with Chromophobe RCC.
| Feature | Sub-category | Mean (Median; Range) |
|---|---|---|
| Age at surgery (years) | 46 (47; 25–70) | |
| Maximum tumor size (cm) | 9.6 (8.5; 4–17.5) | |
| Gender | Female | 31 (60.8%) |
| N (%) | Male | 20 (39.2%) |
| 2017 Primary tumor classification N (%) | pT1a | 2 (2%) |
| pT1b | 16 (31%) | |
| pT2a | 10 (19%) | |
| pT2b | 12 (23%) | |
| pT3a | 11 (21%) | |
| pT3b | 0 | |
| pT3c | 0 | |
| pT4 | 0 | |
| 2017 regional lymph node involvement N (%) | pNX and pN0 | 51 (100%) |
| pN1 | 0 | |
| Distant Metastasis N (%) | pMX | 51 (100%) |
| pM1 | 0 | |
| 2017 TNM stage groupings N (%) | I | 18 (35%) |
| II | 22 (43%) | |
| III | 11 (21%) | |
| IV | 0 | |
| Sarcomatoid Differentiation N (%) | Yes | 2 (4%) |
| No | 49 (96%) | |
| Coagulative tumor necrosis N (%) | 0% | 43 (84%) |
| 1% to 10% | 6 (11%) | |
| >10% | 2 (4%) | |
| Chromophobe RCC grade N (%) | 1 | 4 (7.8%) |
| 2 | 31 (60.8%) | |
| 3 | 16 (31.4%) | |
| Fuhrman Nucleolar Grade N (%) | 1 | 26 (51%) |
| 2 | 20 (39.2%) | |
| 3 | 2 (3.9%) | |
| 4 | 3 (5.9%) |
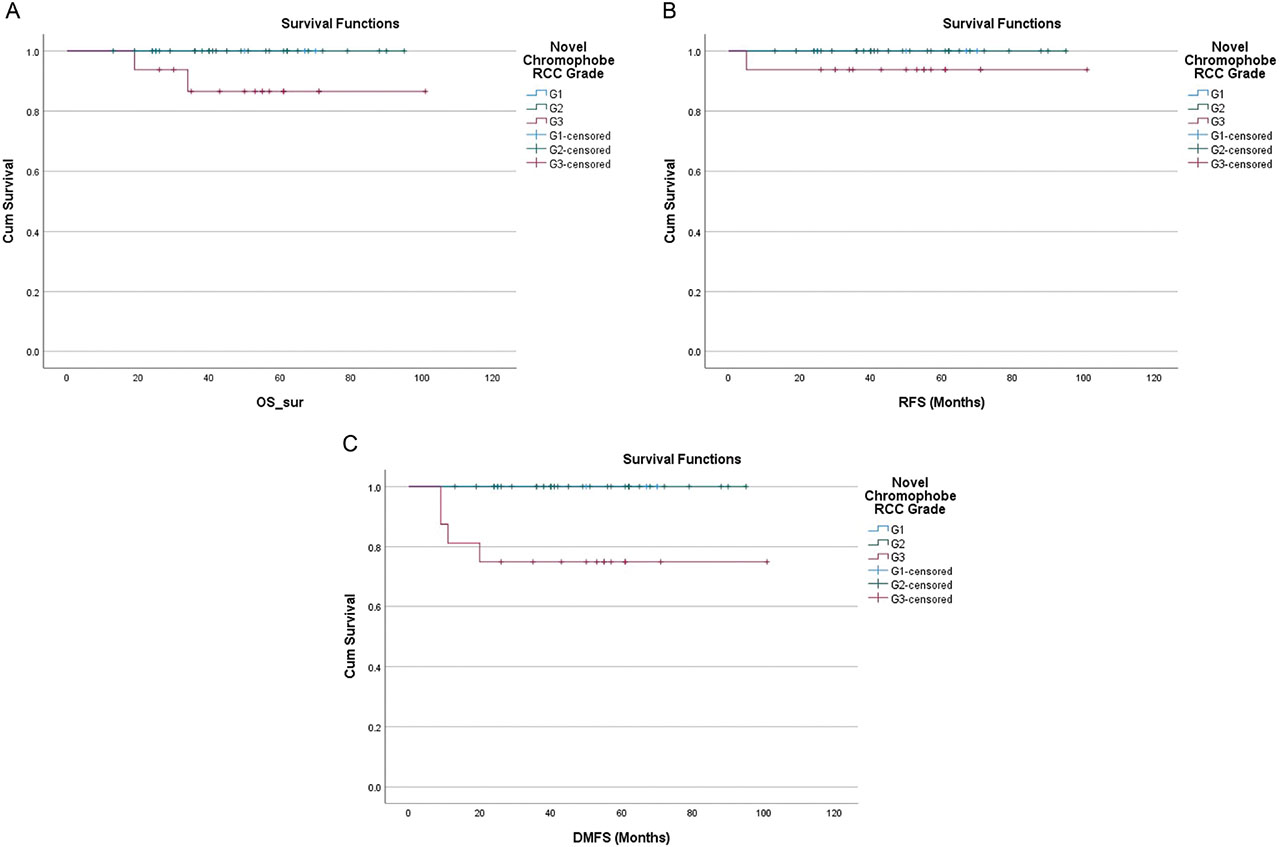
Figure 3.
Chromophobe tumor grade. A, Overall survival (months). B, Recurrence-free survival (months). C, Distant metastasis-free survival (months).
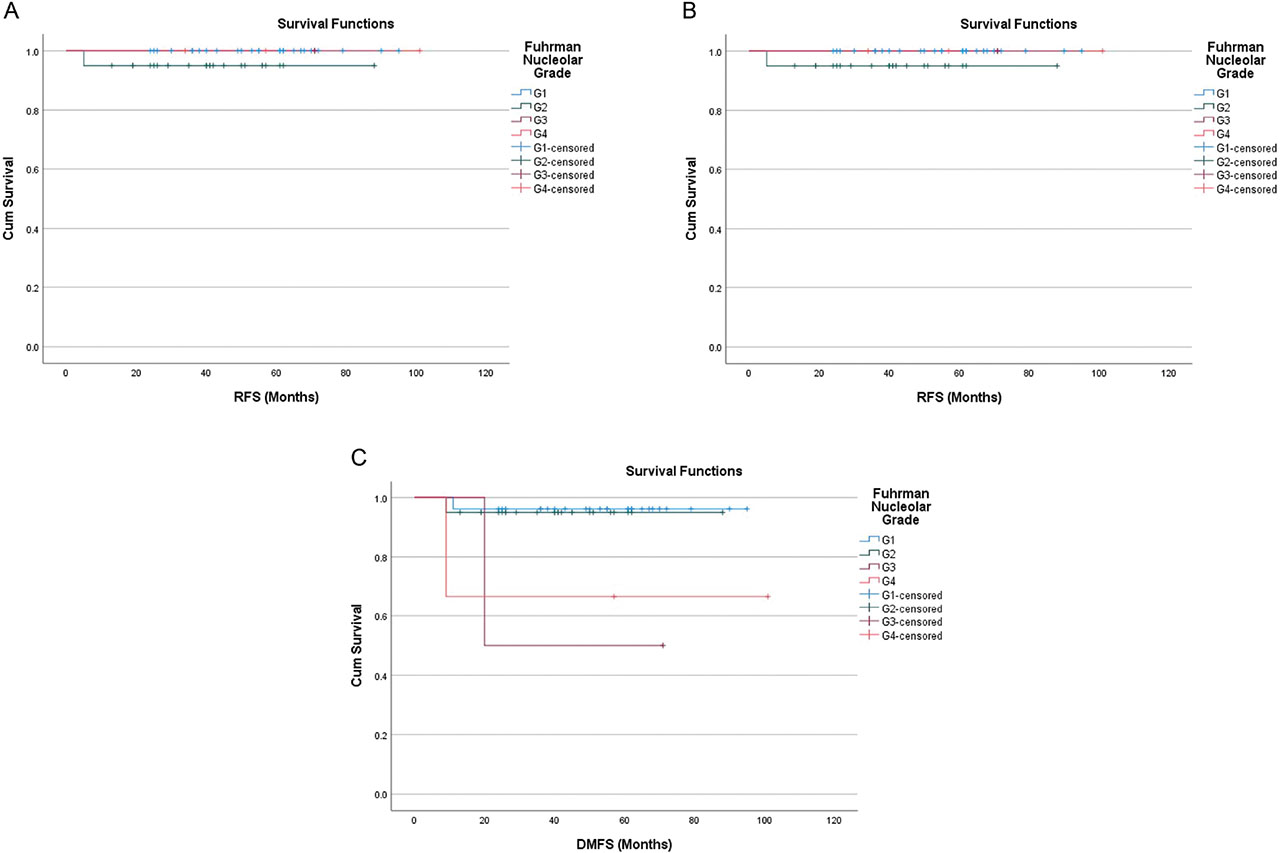
Figure 4.
Fuhrman nucleolar grade. A, Overall survival (months). B, Recurrence-free survival (months). C, Distant metastasis-free survival (months).
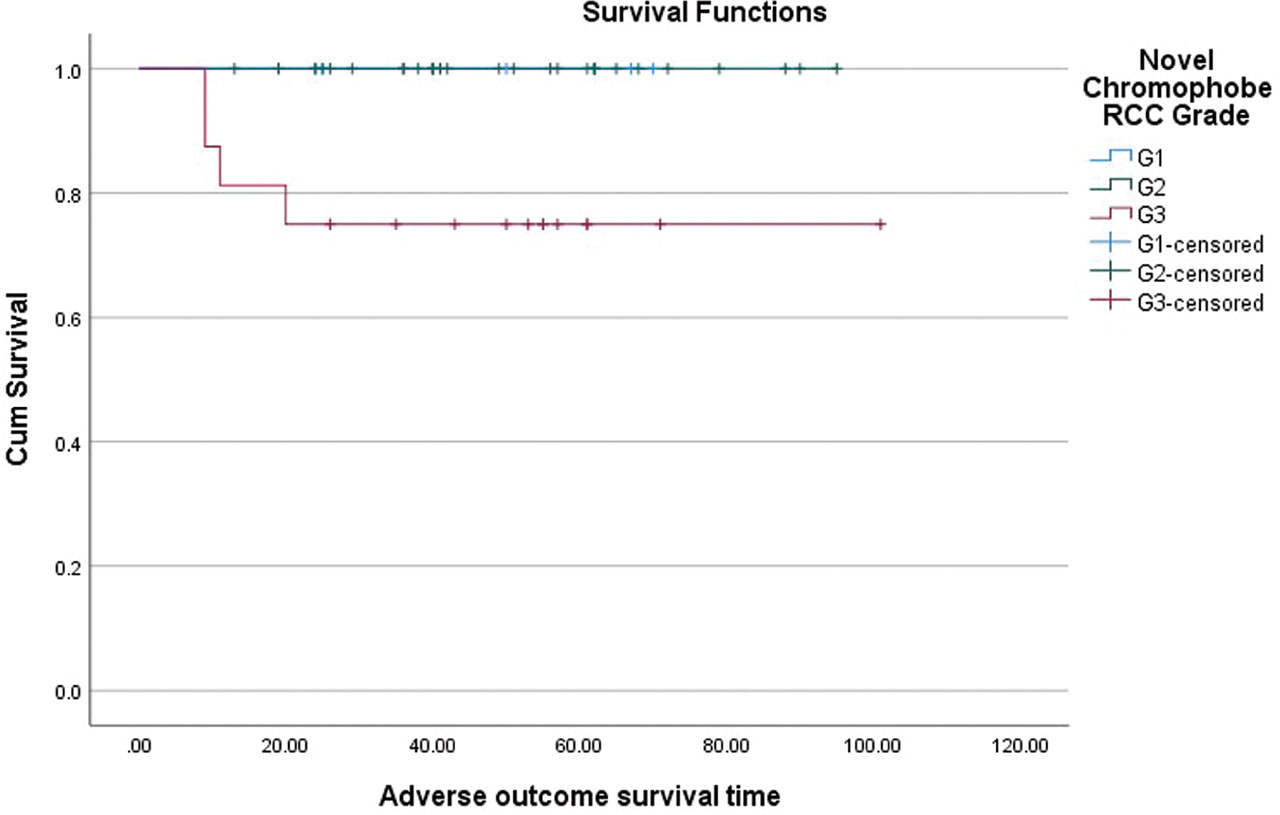
Figure 5.
Overall survival of adverse outcome with regard to Chromophobe tumor grade.
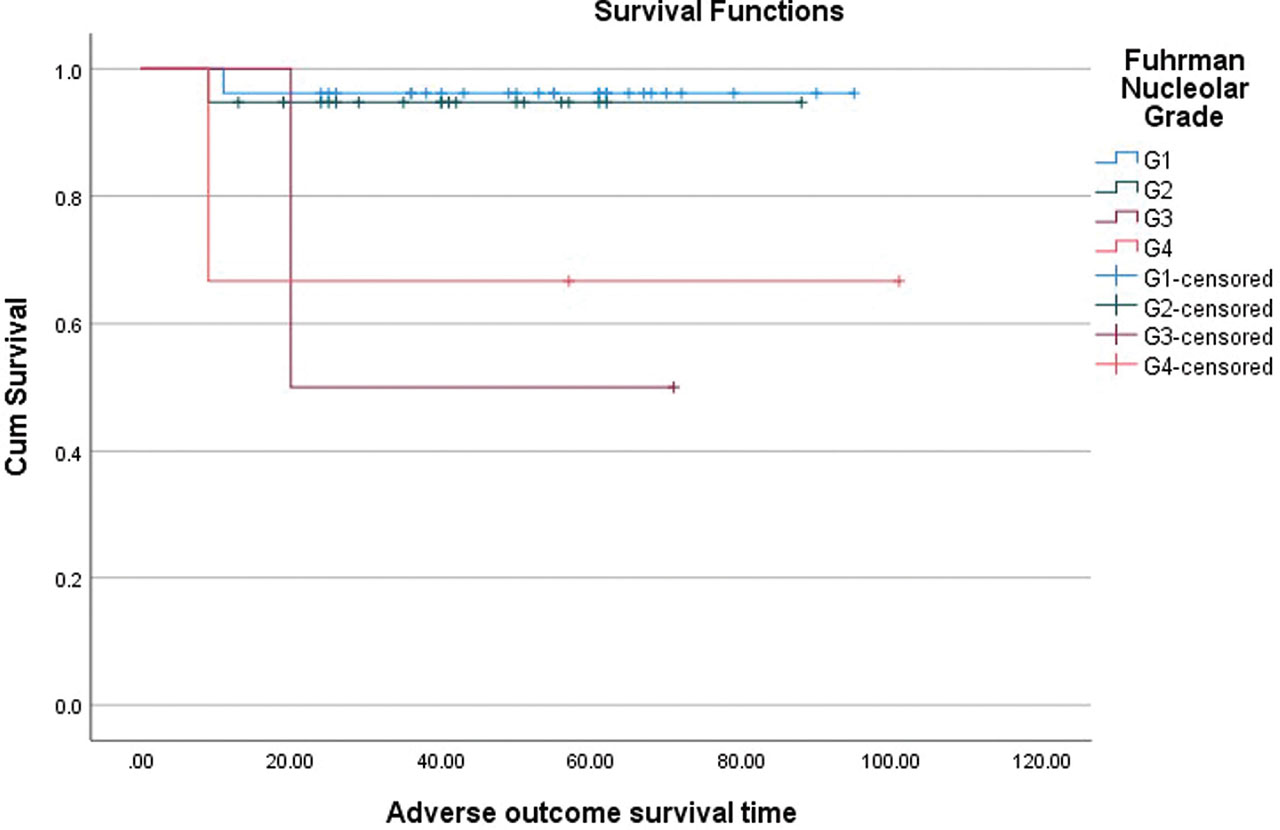
Figure 6.
Overall survival in relation to adverse outcomes concerning Fuhrman nucleolar grade.
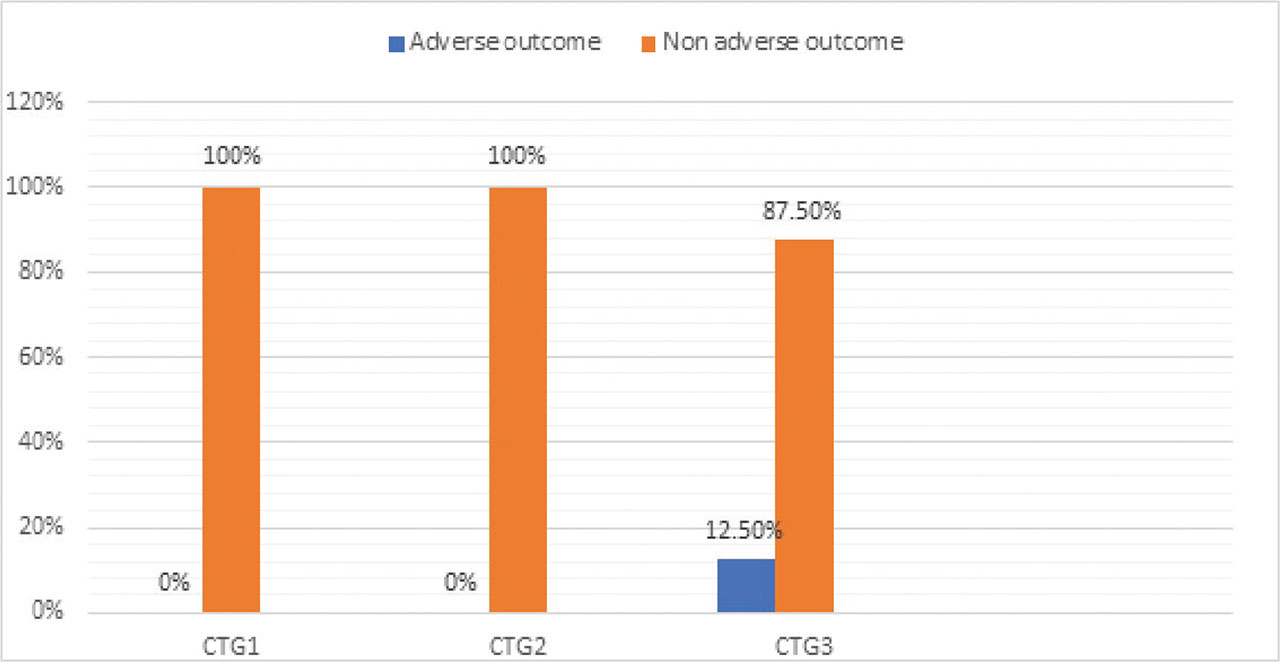
Figure 7.
Association of the novel chromophobe tumor grade (CTG) with chromophobe renal cell carcinoma with adverse outcome (local recurrence, metastasis, and/or death owing to disease).
Table 2.
Correlation of Chromophobe grading system with coagulative tumor necrosis, sarcomatoid differentiation and TNM stage.
| Novel ChRCC Grade | TNM stage groupings | Sarcomatoid Differentiation | Tumor necrosis (%age) | |||||
|---|---|---|---|---|---|---|---|---|
| N (%) | Stage I N (%) | Stage II N (%) | Stage III N (%) | Present N (%) | Absent N (%) | Group 1 (0%) | Group 2 (1%–10%) | Group 3 (>10%) |
| Grade 1 4 (7.8%) | 1 (25%) | 2 (50%) | 1 (25%) | 0 (0%) | 4 (100%) | 4 (100%) | 0 (0%) | 0 (0%) |
| Grade 2 31 (60.8%) | 11 (33%) | 15 (45%) | 5 (15%) | 0 (0%) | 31 (100%) | 27 (87%) | 2 (6%) | 2 (6%) |
| Grade 3 16 (31.4%) | 6 (37%) | 5 (31%) | 5 (31%) | 2 (12%) | 14 (88%) | 0 (0%) | 14 (87.5%) | 2 (12.5%) |
Table 3.
Correlation of the Fuhrman nucleolar grading system with coagulative tumor necrosis, sarcomatoid differentiation and TNM stage.
| Fuhrman Nucleolar Grade | TNM stage groupings | Sarcomatoid Differentiation | Tumor necrosis (%age) | |||||
|---|---|---|---|---|---|---|---|---|
| N (%) | Stage I N (%) | Stage II N (%) | Stage III N (%) | Present N (%) | Absent N (%) | Group 1 (0%) | Group 2 (1%–10%) | Group 3 (>10%) |
| Grade 1 26 (51%) | 9 (34%) | 13 (50%) | 4 (15%) | 0 (0%) | 26 (100%) | 22 (77%) | 2 (8%) | 4 (15%) |
| Grade 2 20 (39.2%) | 7 (35%) | 8 (40%) | 5 (25%) | 0 (0%) | 20 (100%) | 17 (85%) | 0 (0%) | 3 (15%) |
| Grade 3 2 (3.9%) | 1 (50%) | 0 (0%) | 1 (50%) | 1 (50%) | 1 (50%) | 2 (100%) | 0 (0%) | 0 (0%) |
| Grade 4 3 (5.9%) | 1 (33%) | 1 (33%) | 1 (33%) | 1 (33%) | 2 (67%) | 2 (67%) | 0 (0%) | 1 (33%) |