
Figure 1.
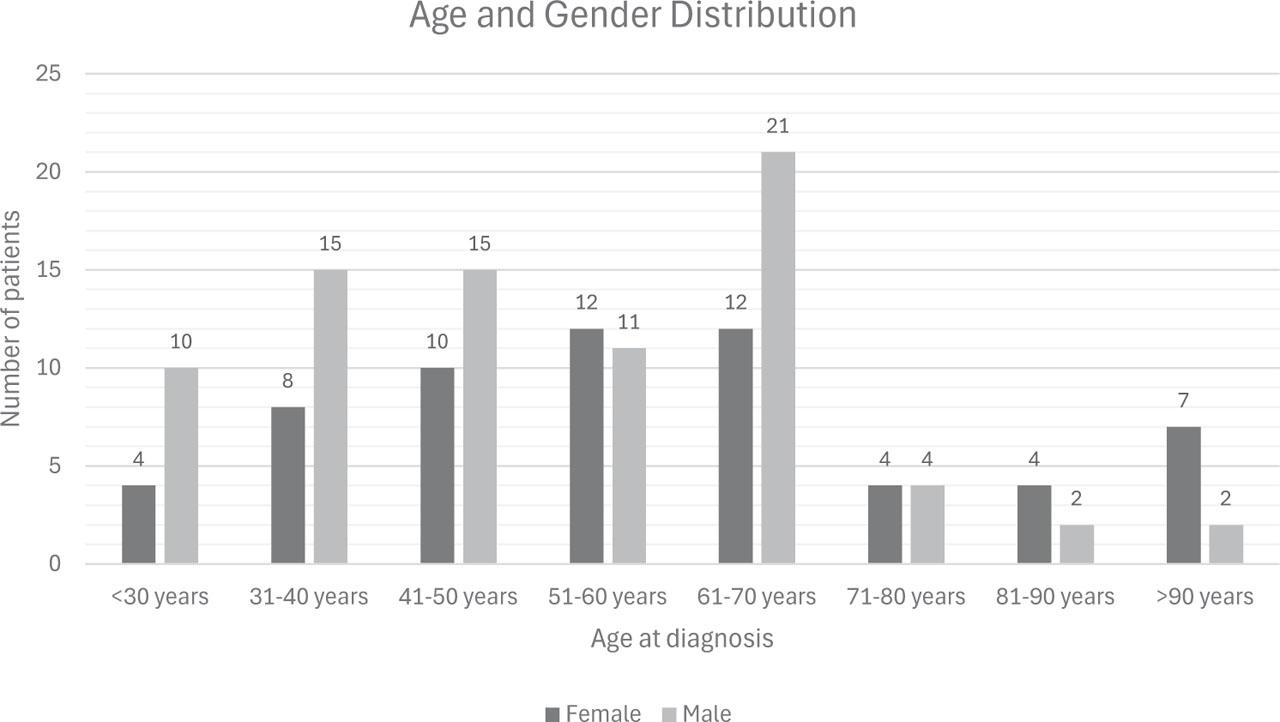
Figure 2.
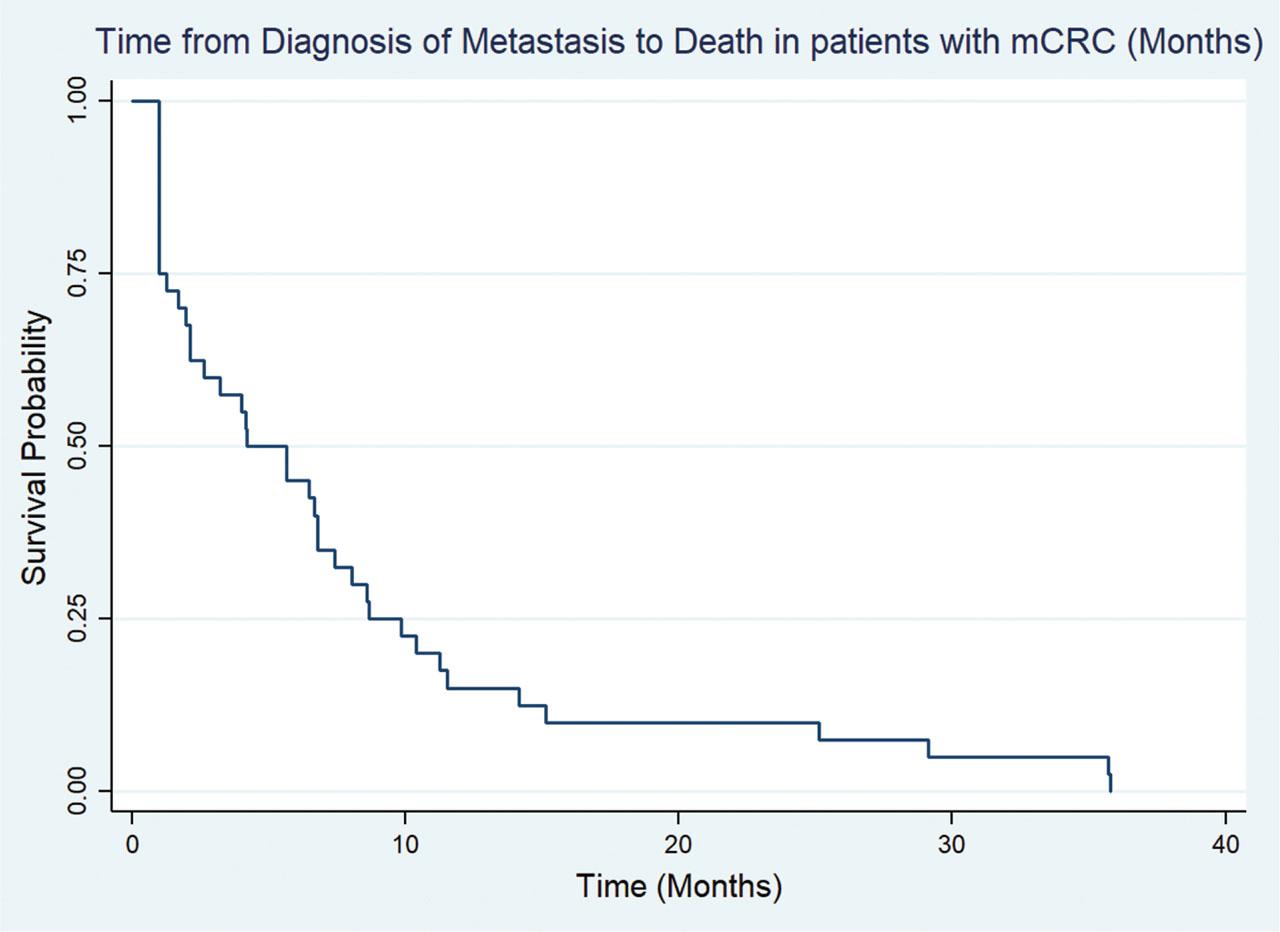
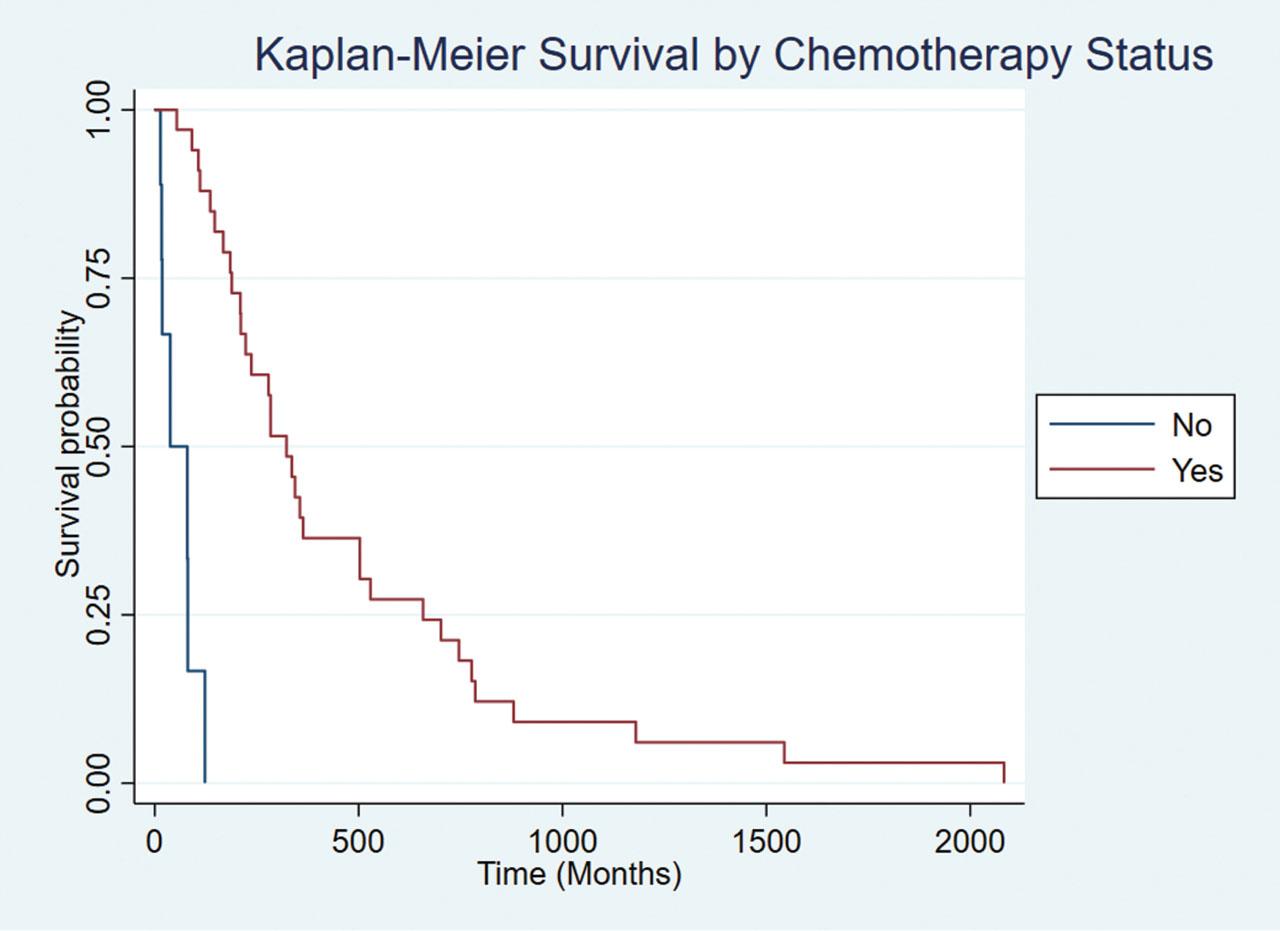
Figure 3.
STROBE Statement—checklist of items that should be included in reports of observational studies
| Item No | Recommendation | Page No. | |
|---|---|---|---|
| Title and abstract | 1 | (a) Indicate the study's design with a commonly used term in the title or the abstract | 1 |
| (b) Provide in the abstract an informative and balanced summary of what was done and what was found | 1 | ||
| Introduction | |||
| Background/rationale | 2 | Explain the scientific background and rationale for the investigation being reported | 3 |
| Objectives | 3 | State specific objectives, including any prespecified hypotheses | 3 |
| Methods | |||
| Study design | 4 | Present key elements of study design early in the paper | 4 |
| Setting | 5 | Describe the setting, locations, and relevant dates, including periods of recruitment, exposure, follow-up, and data collection | 4 |
| Participants | 6 | Cross-sectional study—Give the eligibility criteria, and the sources and methods of selection of participants | 4 |
| Variables | 7 | Clearly define all outcomes, exposures, predictors, potential confounders, and effect modifiers. Give diagnostic criteria, if applicable | 5 |
| Data sources/measurement | 8* | For each variable of interest, give sources of data and details of methods of assessment (measurement). Describe comparability of assessment methods if there is more than one group | 5 |
| Bias | 9 | Describe any efforts to address potential sources of bias | 5 |
| Study size | 10 | Explain how the study size was arrived at | 5 |
| Quantitative variables | 11 | Explain how quantitative variables were handled in the analyses. If applicable, describe which groupings were chosen and why | 5 |
| Statistical methods | 12 | (a) Describe all statistical methods, including those used to control for confounding | 5 |
| (b) Describe any methods used to examine subgroups and interactions | 5 | ||
| (c) Explain how missing data were addressed | 5 | ||
| (d) Cross-sectional study—If applicable, describe analytical methods taking account of sampling strategy | 5 | ||
| (e) Describe any sensitivity analyses | - | ||
| Results | |||
| Participants | 13* | (a) Report numbers of individuals at each stage of study—eg numbers potentially eligible, examined for eligibility, confirmed eligible, included in the study, completing follow-up, and analysed | 6 |
| (b) Give reasons for non-participation at each stage | 6 | ||
| (c) Consider use of a flow diagram | 6 | ||
| Descriptive data Outcome data | 14* | (a) Give characteristics of study participants (eg demographic, clinical, social) and information on exposures and potential confounders | 6–7 |
| (b) Indicate number of participants with missing data for each variable of interest | 6–7 | ||
| 15* | Cross-sectional study—Report numbers of outcome events or summary measures | 6–7 | |
| Main results | 16 | (a) Give unadjusted estimates and, if applicable, confounder-adjusted estimates and their precision (eg, 95% confidence interval). Make clear which confounders were adjusted for and why they were included | - |
| (b) Report category boundaries when continuous variables were categorized | |||
| (c) If relevant, consider translating estimates of relative risk into absolute risk for a meaningful time period | 6–7 | ||
| Other analyses | 17 | Report other analyses done—eg analyses of subgroups and interactions, and sensitivity analyses | - |
| Discussion | |||
| Key results | 18 | Summarise key results with reference to study objectives | 7 |
| Limitations | 19 | Discuss limitations of the study, taking into account sources of potential bias or imprecision. Discuss both direction and magnitude of any potential bias | 7–11 |
| Interpretation | 20 | Give a cautious overall interpretation of results considering objectives, limitations, multiplicity of analyses, results from similar studies, and other relevant evidence | 7–11 |
| Generalisability | 21 | Discuss the generalisability (external validity) of the study results | 7–11 |
| Other information | |||
| Funding | 22 | Give the source of funding and the role of the funders for the present study and, if applicable, for the original study on which the present article is based | - |
Tumor and Metastatic Characteristics of Patients with Metastatic Colorectal Cancer_
| Tumor Characteristics | Frequency (n) | Percentage (%) |
|---|---|---|
| Tumour Location | ||
| Ascending Colon | 10 | 7.0 |
| Descending Colon | 6 | 4.2 |
| Transverse Colon | 10 | 7.0 |
| Sigmoid Colon | 29 | 20.4 |
| Rectosigmoid junction | 24 | 16.9 |
| Rectum | 39 | 27.5 |
| Others | 11 | 7.7 |
| Multisite CRC Involvement | 8 | 5.6 |
| Missing | 4 | 2.8 |
| Histological Type | ||
| Adenocarcinoma | 128 | 90.1 |
| Lymphoma | 2 | 1.4 |
| Squamous Cell Carcinoma | 2 | 1.4 |
| Others | 4 | 2.8 |
| Missing | 5 | 3.5 |
| Subtype Classification (based on histopathologic features) | ||
| Glandular | 4 | 2.8 |
| Mucinous | 21 | 14.8 |
| Signet Ring | 23 | 16.2 |
| Mixed | 11 | 7.7 |
| Not Reported/Missing | 82 | 57.8 |
| Level of Differentiation | ||
| Well-differentiated | 19 | 13.4 |
| Moderately differentiated | 58 | 45.1 |
| Poorly differentiated | 41 | 40.8 |
| Undifferentiated | 1 | 0.7 |
| Unknown/Missing | 22 | 15.3 |
| Pathological T stage | ||
| T1 | 0 | 0 |
| T2 | 4 | 2.8 |
| T3 | 40 | 28.2 |
| T4a | 22 | 15.5 |
| T4b | 6 | 4.2 |
| Not reported/Missing | 69 | 48.7 |
| Pathological N stage | ||
| N0 | 10 | 7 |
| N1 | 23 | 16.2 |
| N2 | 35 | 24.6 |
| NX | 65 | 45.8 |
| Not reported/Missing | 8 | 5.7 |
| Stage at Presentation | ||
| I–III | 101 | 71.6 |
| IV | 40 | 28.4 |
| Location of Metastasis | ||
| Liver-only | 39 | 27.5 |
| Lung-only | 7 | 4.9 |
| Peritoneum-only | 20 | 14.1 |
| Bone-only | 3 | 2.1 |
| Multisite (≥2 organs) | 68 | 48.2 |
| Other – single site metastasis | 4 | 3.2 |
| Total Involvement Across All Metastatic Sites** | ||
| Liver | 70 | 49.6 |
| Lung | 22 | 15.6 |
| Bone | 16 | 11.3 |
| Brain/Spinal cord | 1 | 0.7 |
| Peritoneum | 50 | 35.5 |
| Lymphovascular Invasion | ||
| No | 36 | 25.4 |
| Yes | 58 | 40.8 |
| Missing | 43 | 30.3 |
Treatment Modalities, Complications, and Outcomes in Metastatic Colorectal Cancer Patients_
| Treatment Details | Frequency (n) | Percentage (%) |
|---|---|---|
| Chemotherapy | ||
| Yes | 106 | 74.6 |
| No | 33 | 23.2 |
| Missing | 2 | 1.4 |
| Chemotherapy Timing | ||
| Both preoperative and postoperative | 11 | 10.4 |
| Preoperative only | 56 | 52.8 |
| Postoperative only | 7 | 6.6 |
| Chemotherapy without surgery | 31 | 29.2 |
| Missing | 36 | 25.5 |
| Chemotherapy Regimen* | ||
| CAPEOX | 28 | 19.9 |
| FOLFIRI | 4 | 2.8 |
| FOLFOX | 54 | 38.3 |
| Others | 26 | 18.4 |
| Radiotherapy | ||
| Yes | 31 | 21.8 |
| No | 104 | 73.2 |
| Missing | 6 | 4.3 |
| Radiotherapy Timing | ||
| Preoperative only | 11 | 7.7 |
| Postoperative only | 10 | 7.0 |
| Radiotherapy without surgery | 10 | 7.0 |
| Primary Tumor Resection | ||
| Yes | 69 | 43.7 |
| No | 72 | 56.3 |
| Type of Primary Tumor Resection | ||
| Abdominoperineal resection | 6 | 4.2 |
| High anterior resection | 8 | 5.6 |
| Left hemicolectomy. | 16 | 11.3 |
| Low anterior resection | 16 | 11.3 |
| Right hemicolectomy | 17 | 12.0 |
| Sigmoid colectomy | 6 | 4.2 |
| Surgery performed for metastatic Lesions | ||
| Liver resection | 11 | 7.8 |
| Lung resection | 1 | 0.7 |
| Others** | 3 | 2.1 |
Strategic Solutions to Address Gaps in Metastatic Colorectal Cancer Care in LMICs_
| Challenge | Strategic Solution |
|---|---|
| No screening programs | Pilot regular screening in high-risk districts; scale up via primary care |
| Delayed diagnosis | Train frontline providers on CRC symptoms and referral pathways |
| Limited diagnostics | Establish regional diagnostic hubs with public-private partnerships |
| Limited access to chemotherapy | Expand essential medicine list and implement pooled drug procurement |
| High out-of-pocket costs | Launch targeted subsidy programs through national insurance or NGO support |
| Fragmented care | Standardize treatment via tumor boards and national care pathways |
| Poor data systems | Develop hospital-based CRC registries with digital tools (e.g., REDCap) |
Demographic and Clinical Characteristics of Patients with Metastatic Colorectal Cancer_
| Demographic Characteristics | Frequency (n) | Percentage (%) |
|---|---|---|
| Age (mean and STD) | 51 | 17.4 |
| Age at the time of diagnosis | ||
| ≤30 years | 14 | 9.9 |
| 31–40 years | 23 | 16.3 |
| 41–50 years | 25 | 17.7 |
| 51–60 years | 23 | 16.3 |
| 61–70 years | 33 | 23.4 |
| 71–80 years | 8 | 5.7 |
| 81–90 years | 6 | 4.3 |
| >90 years | 1 | 5.7 |
| Missing | 8 | 1.2 |
| Gender | ||
| Male | 80 | 56.7 |
| Female | 61 | 43.3 |
| Province of origin | ||
| Sindh | 101 | 71.1 |
| Punjab | 6 | 4.2 |
| Balochistan | 5 | 3.5 |
| Gilgit/Baltistan | 2 | 1.4 |
| Outside Pakistan | 12 | 8.5 |
| Missing | 15 | 10.6 |
| Clinical Characteristics | Frequency (n) | Percentage (%) |
| BMI (mean and STD) | 25 | 5.6 |
| BMI | ||
| Underweight | 16 | 11.3 |
| Normal | 30 | 21.3 |
| Overweight | 15 | 10.6 |
| Obese | 51 | 36.2 |
| Missing | 29 | 20.6 |
| Smoking | 24 | 17 |
| Hypertension | 49 | 34.8 |
| Diabetes Mellitus | 40 | 28.4 |
| Cardiovascular Disease | 16 | 11.3 |
| Cerebrovascular Disease | 0 | 0 |
| Chronic Kidney Disease | 7 | 5 |
| Hyperlipidaemia | 4 | 2.8 |
| Thyroid Disease | 6 | 4.3 |
| Pulmonary Disease | 8 | 5.7 |
| Weight Loss (>=5%) in last 6 months | 86 | 61 |
| Positive Family History of CRC/FAP/HNPCC | 24 | 17 |
| Personal History of Cancer excluding CRC | 5 | 3.5 |
| Charlson Comorbidity Index | ||
| ≤8 | 94 | 66.7 |
| 9–10 | 19 | 13.5 |
| ≥11 | 12 | 8.5 |
| ECOG Classification | ||
| 0 | 7 | 5 |
| 1 | 44 | 31.2 |
| 2 | 12 | 8.5 |
| 3 | 7 | 5.0 |
| 4 | 7 | 5.0 |
| Missing | 49 | 34.9 |
| Demographic Characteristics | Frequency (n) | Percentage (%) |
| Bowel Obstruction | ||
| Yes | 50 | 35.2 |
| No | 79 | 55.6 |
| Missing | 12 | 8.6 |
| Bowel Perforation | ||
| Yes | 9 | 6.3 |
| No | 116 | 81.7 |
| Missing | 16 | 11.4 |