
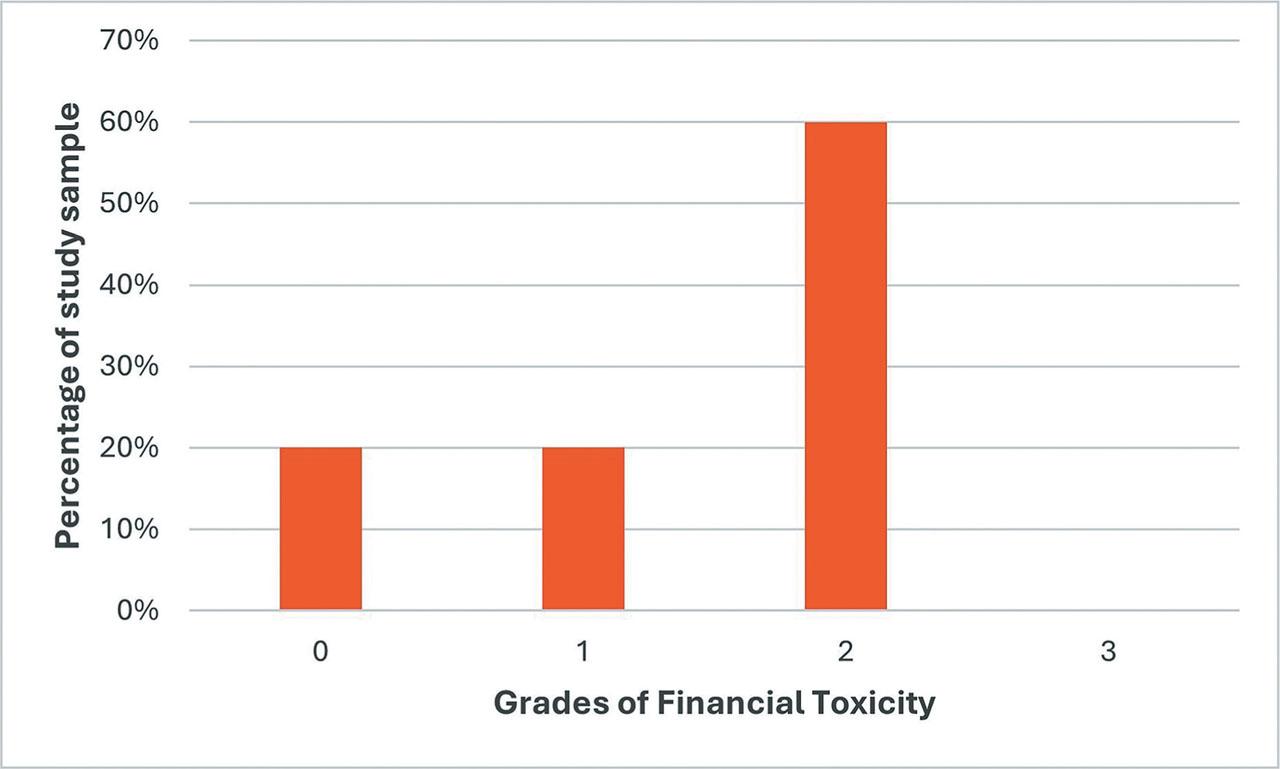
Figure 1.
Inter-Item Correlations Matrix for FACIT COST Tool
| FT1 | FT2 | FT3 | FT4 | FT5 | FT6 | FT7 | FT8 | FT9 | FT10 | FT11 | total_~e | |
|---|---|---|---|---|---|---|---|---|---|---|---|---|
| FT1 | 1 | |||||||||||
| FT2 | 0.447 | 1 | ||||||||||
| FT3 | 0.403 | 0.772 | 1 | |||||||||
| FT4 | −0.696 | −0.283 | 0.128 | 1 | ||||||||
| FT5 | 0.255 | 0.547 | 0.904 | 0.381 | 1 | |||||||
| FT6 | 0.514 | 0.328 | 0.756 | 0.045 | 0.682 | 1 | ||||||
| FT7 | 0.297 | 0.530 | 0.855 | 0.220 | 0.709 | 0.836 | 1 | |||||
| FT8 | 0.164 | 0.196 | 0.548 | 0.343 | 0.593 | 0.527 | 0.467 | 1 | ||||
| FT9 | 0.169 | 0.202 | 0.374 | 0.092 | 0.202 | 0.570 | 0.643 | 0.603 | 1 | |||
| FT10 | 0.255 | 0.365 | 0.657 | 0.258 | 0.79 | 0.599 | 0.565 | 0.536 | 0.323 | 1 | ||
| FT11 | 0.570 | 0.623 | 0.711 | −0.218 | 0.485 | 0.639 | 0.621 | 0.731 | 0.663 | 0.310 | 1 | |
| Total score | 0.429 | 0.623 | 0.931 | 0.177 | 0.862 | 0.84 | 0.880 | 0.743 | 0.626 | 0.750 | 0.792 | 1 |
Descriptive and Internal Consistency for FACIT COST Tool Items
| COST item | Mean | STD | Cronbach’s alpha if item deleted |
|---|---|---|---|
| FT1 | 1 | 1.33 | 0.902 |
| FT2 | 1 | 1.49 | 0.892 |
| FT3 | 1.1 | 1.45 | 0.869 |
| FT4 | 1.8 | 1.32 | 0.914 |
| FT5 | 1.7 | 1.64 | 0.874 |
| FT6 | 1.8 | 1.14 | 0.879 |
| FT7 | 1.2 | 1.69 | 0.872 |
| FT8 | 2.1 | 1.52 | 0.883 |
| FT9 | 1.8 | 1.48 | 0.891 |
| FT10 | 2 | 1.63 | 0.883 |
| FT11 | 0.8 | 1.32 | 0.880 |
Content Validity Indices for FACIT COST Tool Items
| COST item | Content Validity Index (CVI) for relevance – expert responses | Content Validity Index (CVI) for clarity – expert responses | Content Validity Index (CVI) for relevance – patient responses | Content Validity Index (CVI) for clarity – patient responses |
|---|---|---|---|---|
| FT1 | 0.82 | 1.00 | 1.00 | 1.00 |
| FT2 | 0.91 | 0.90 | 1.00 | 1.00 |
| FT3 | 0.91 | 1.00 | 1.00 | 1.00 |
| FT4 | 0.73 | 0.70 | 1.00 | 1.00 |
| FT5 | 0.64 | 0.90 | 1.00 | 1.00 |
| FT6 | 0.82 | 1.0 | 1.00 | 0.90 |
| FT7 | 0.82 | 1.0 | 1.00 | 1.00 |
| FT8 | 0.91 | 0.9 | 1.00 | 1.00 |
| FT9 | 0.73 | 0.8 | 1.00 | 1.00 |
| FT10 | 0.82 | 0.8 | 1.00 | 1.00 |
| FT11 | 0.82 | 0.8 | 1.00 | 1.00 |
Patient characteristics
| Characteristics | N (%) |
|---|---|
| Institution | |
| Aga Khan University Hospital | 3 (30%) |
| Cancer Foundation Hospital | 2 (20%) |
| Jinnah Postgraduate Medical Center | 3 (30%) |
| Patel Hospital | 2 (20%) |
| Sex | |
| Male | 4 (40%) |
| Female | 6 (60%) |
| Age | |
| Less than 40 years | 3 (30%) |
| 40–60 years | 4 (40%) |
| Above 60 years | 3 (30%) |
| Education | |
| Not educated | 3 (30%) |
| Primary | 1 (10%) |
| Secondary | 3 (30%) |
| Graduate and above | 3 (30%) |
| Marital status | |
| Married | 9 (90%) |
| Unmarried | 1 (10%) |
| Occupation | |
| Employed (excluding self employed) | 1 (10%) |
| Unemployed | 1 (10%) |
| Labour work | 1 (10%) |
| Home maker | 5 (50%) |
| Self employed | 1 (10%) |
| Retired | 1 (10%) |
| Monthly household income (in Pak Rupees) | |
| <50,000 | 4 (40%) |
| 50,000–100,000 | 4 (40%) |
| >100,000 | 3 (30%) |
| Site of cancer | |
| Colon | 3 (30%) |
| Esophagus | 4 (40%) |
| Pancreas | 2 (20%) |
| Rectum | 1 (10%) |