
Table 1.
Patient characteristics.
| Variable | n (%) or mean ± SD |
|---|---|
| Gender | |
| Male | 45 (77.6) |
| Female | 13 (22.4) |
| Age | 61.5 [55.0 – 67.0] |
| Number of cycles | 4 [2 – 6] |
| White cell counts at presentation | 5.8 [2.4 – 16.1] |
| Outcome | |
| Death | 44 (75.9) |
| Under treatment | 9 (15.5) |
| Palliative care | 1 (1.7) |
| Lost to follow up | 4 (6.9) |
| Secondary leukemia | |
| MDS transformation | 7 (12.1) |
| CMML transformation | 2 (3.4) |
| MF transformation | 2 (3.4) |
| Remission achieved | |
| Yes | 22 (37.9) |
| No | 33 (56.9) |
| Not known | 3 (5.2) |
| Cause of death | |
| Refractory disease | 30 (63.8) |
| Relapsed disease | 10 (21.3) |
| Secondary Cause* | 4 (8.5) |
| Not Known | 3 (6.4) |
| Comorbid conditions | |
| Hypertension | 17 (29.3) |
| Diabetes Mellitus | 20 (34.5) |
| Coronary Artery Disease | 4 (6.9) |
Table 2.
Cytogenetic abnormalities identified in our cohort
| Cytogenetic abnormalities | n (%) |
|---|---|
| Normal | 20 (34) |
| Complex karyotypic abnormalities* | 5 (9) |
| Deletion 7q | 4 (7) |
| Translocation 8:21 | 2 (3) |
| Trisomy 8 | 2 (3) |
| Monosomy X | 2 (3) |
| Deletion 11q | 1 (2) |
| Inversion 16 | 1 (2) |
| Translocation 1:22 | 1 (2) |
| Trisomy 11 | 1 (2) |
| Trisomy 19 | 1 (2) |
| Metaphysis not found | 18 (31) |
Table 3.
Molecular abnormalities identified in our cohort
| Molecular abnormalities | Count |
|---|---|
| FLT 3-ITD | 7 |
| NPM 1 | 4 |
| Others (CALR, U2AF1, KRAS, PHF6) | 4 |
| IDH-1/2 | 3 |
| TP53 | 2 |
| WT-1 | 2 |
| NRAS | 2 |
| TET-2 | 2 |
| RUNX-1 | 2 |
| JAK2 | 2 |
| ASXL-1 | 1 |
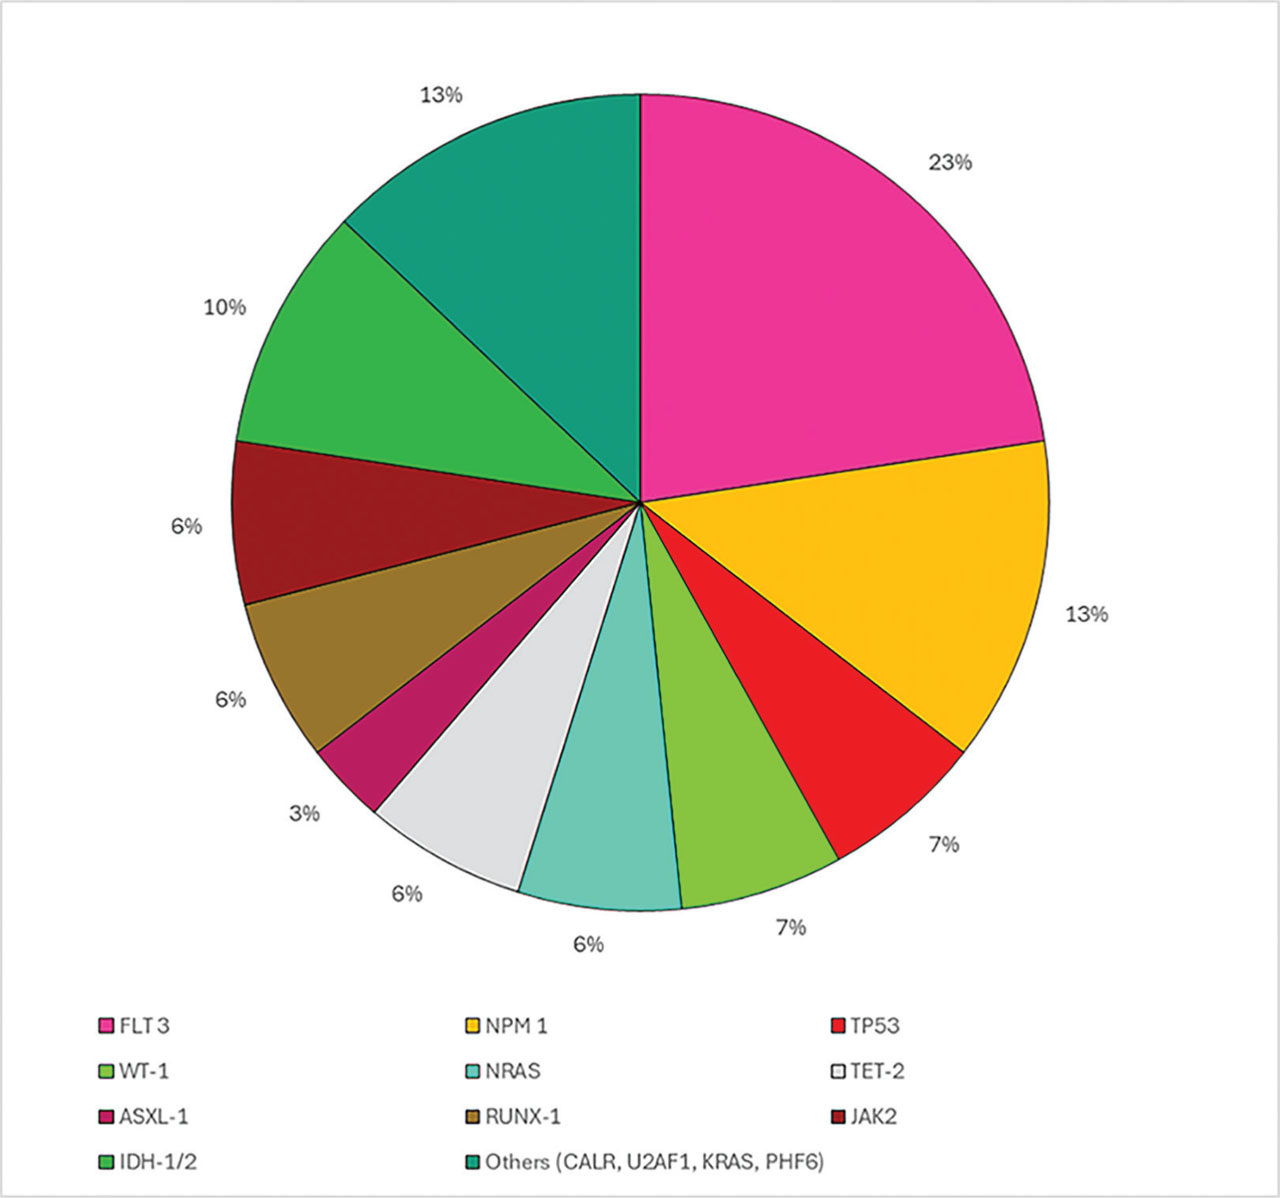
Figure 1.
The proportion of different types of mutations observed in the patients.
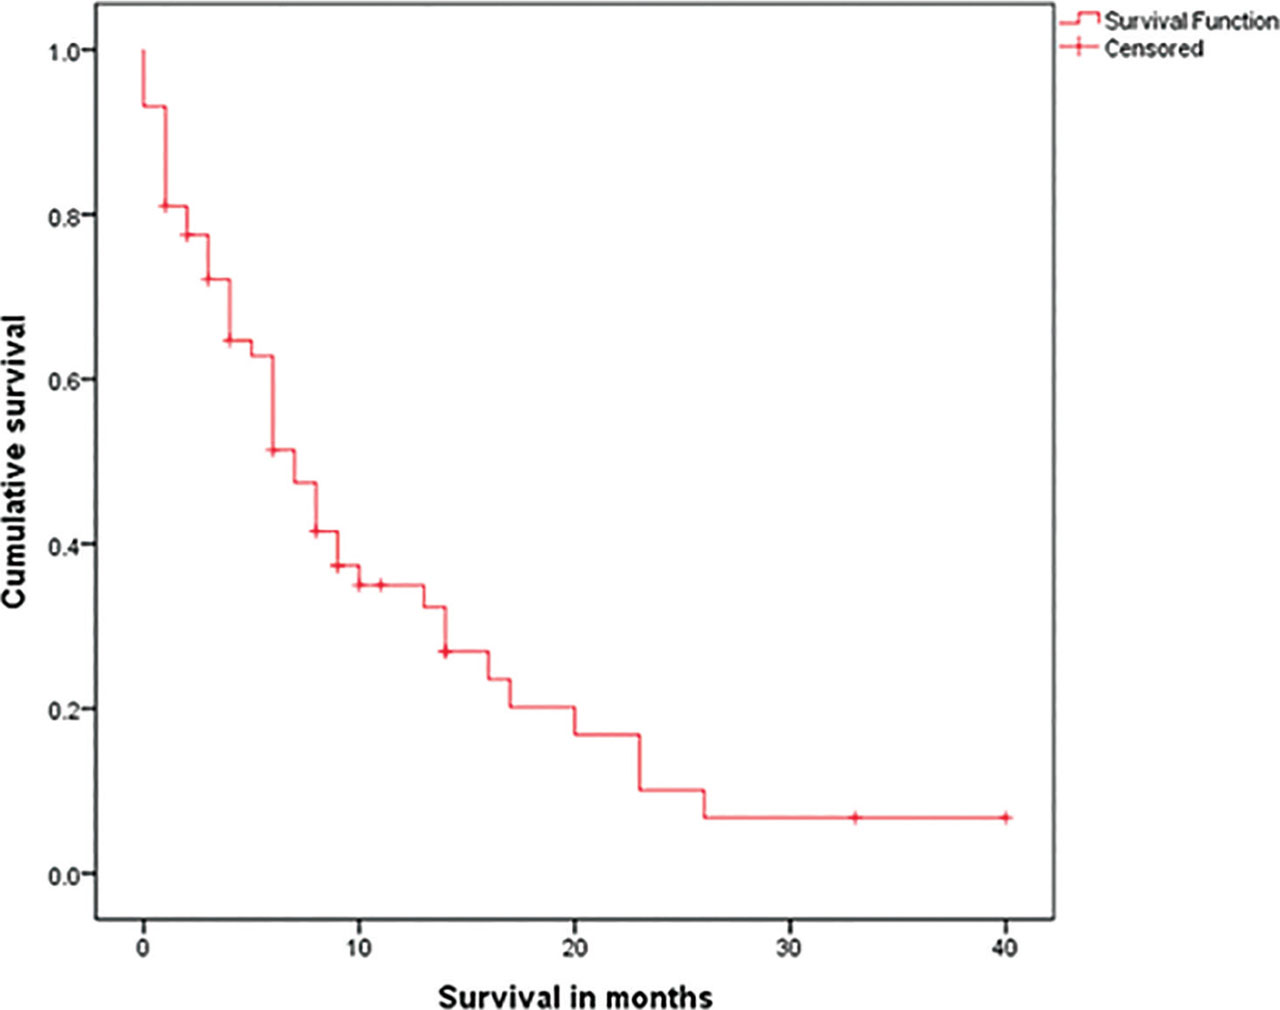
Figure 2.
Kaplan Meier Curve for overall survival among patients with Acute Myeloid Leukemia treated with Venetoclax and Azacitidine.
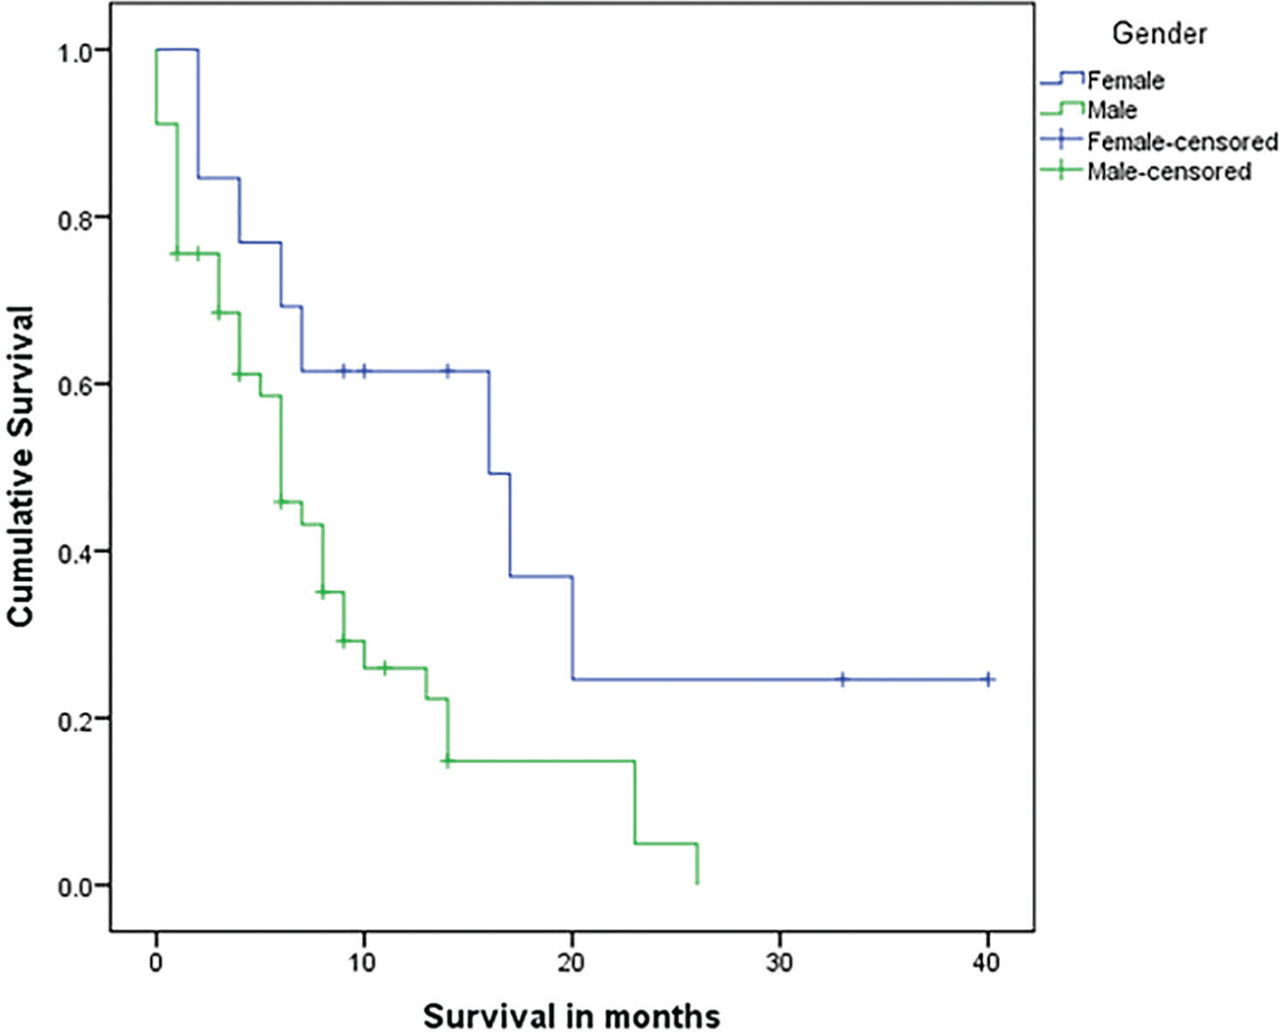
Figure 3.
Kaplan Meier curves for overall survival among patients with AML stratified by gender.
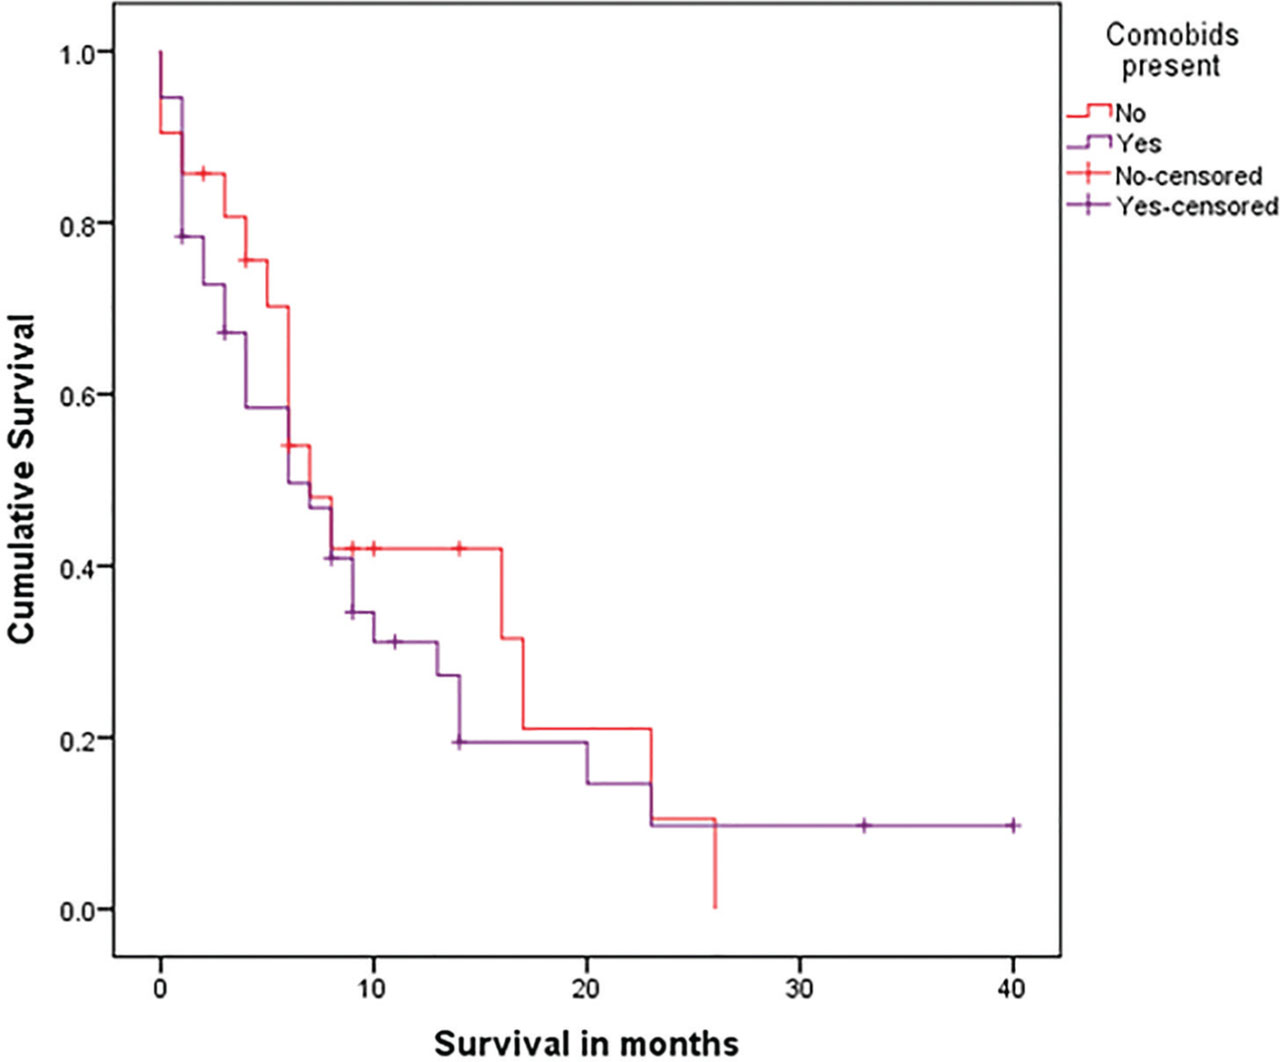
Figure 4.
Kaplan Meier curves for overall survival among patients with AML stratified by comorbid status.
Table 4.
Multivariable cox-regression model for predictors of survival in our cohort