
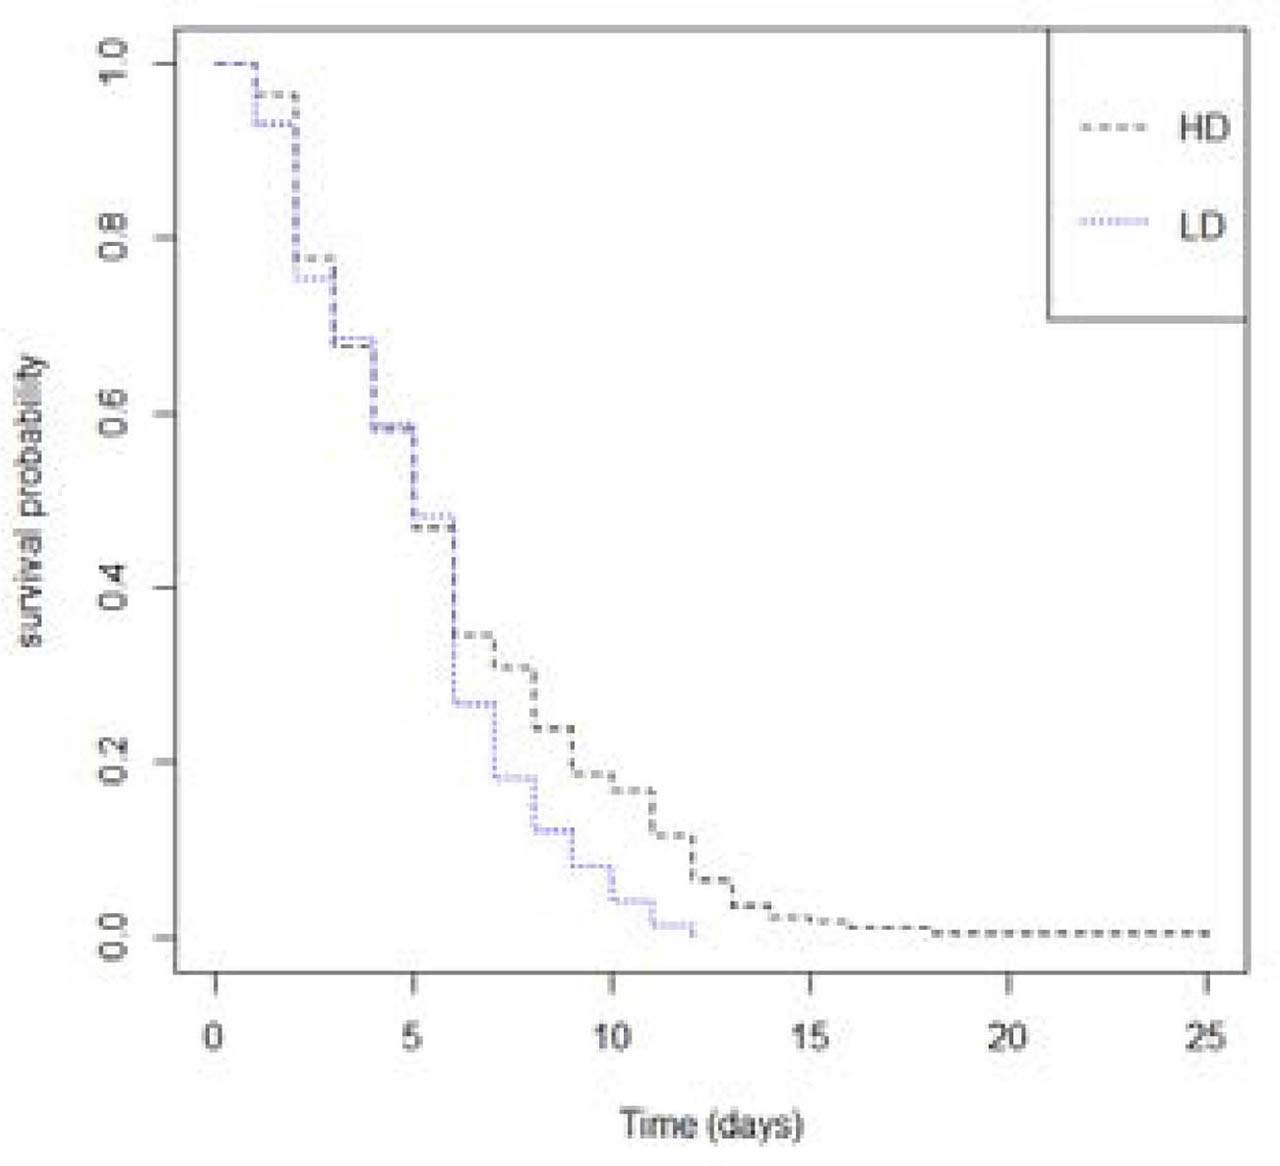
Fig. 1
Survival analysis for different feeding regimens.
Black dashed line - highly diverse (HD) pollen diet, blue dotted line - lowly diverse (LD) pollen diet.
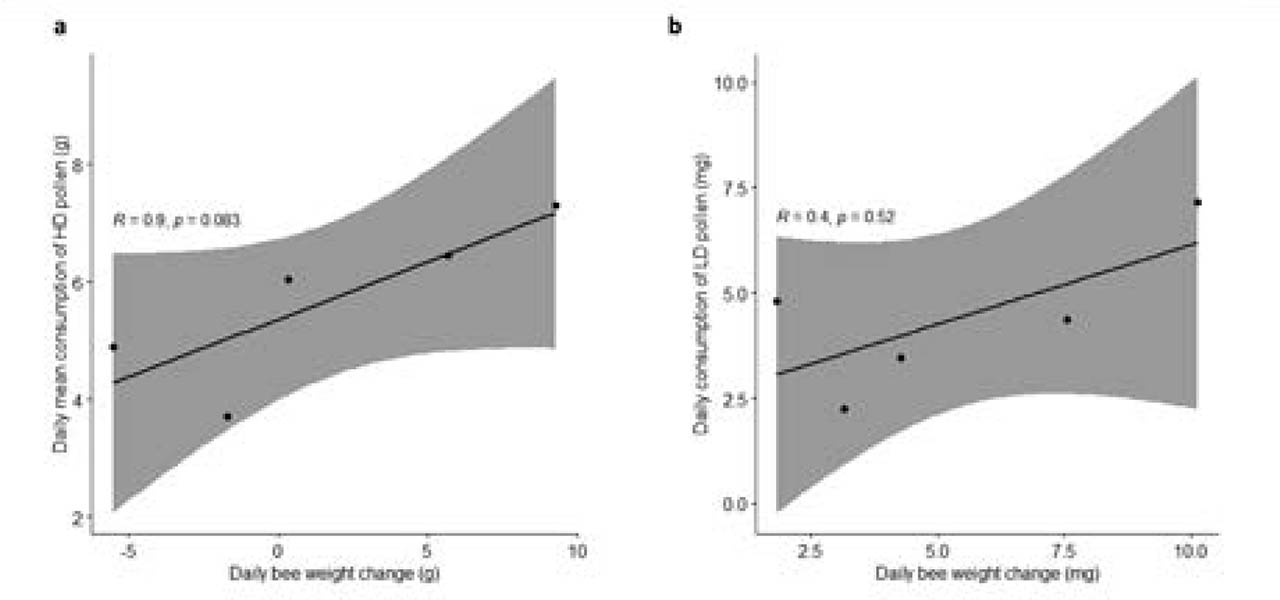
Fig. 2
Correlation of daily pollen consumption and daily weight change for (a) highly diverse (HD) pollen diet and (b) lowly diverse (LD) pollen diet).
Table S1
List of primers for TBP and Defensin-2.
| Gene ID | Primer | Amplicon size (bp) | Annealing temperature (°C) | Primer reference |
|---|---|---|---|---|
| Tata Binding Protein (TBP) | F: TTGGTTTCATTAGCTGCACAA R: ACTGCGGGAGTCAAATCTTC | 149 | 53.5 | Tesovnik et al., 2017 |
| defensin-2 | F: GCAACTACCGCCTTTACGTC R: GGGTAACGTGCGACGTTTTA | 159 | 55.0 | Tesovnik et al., 2017 |
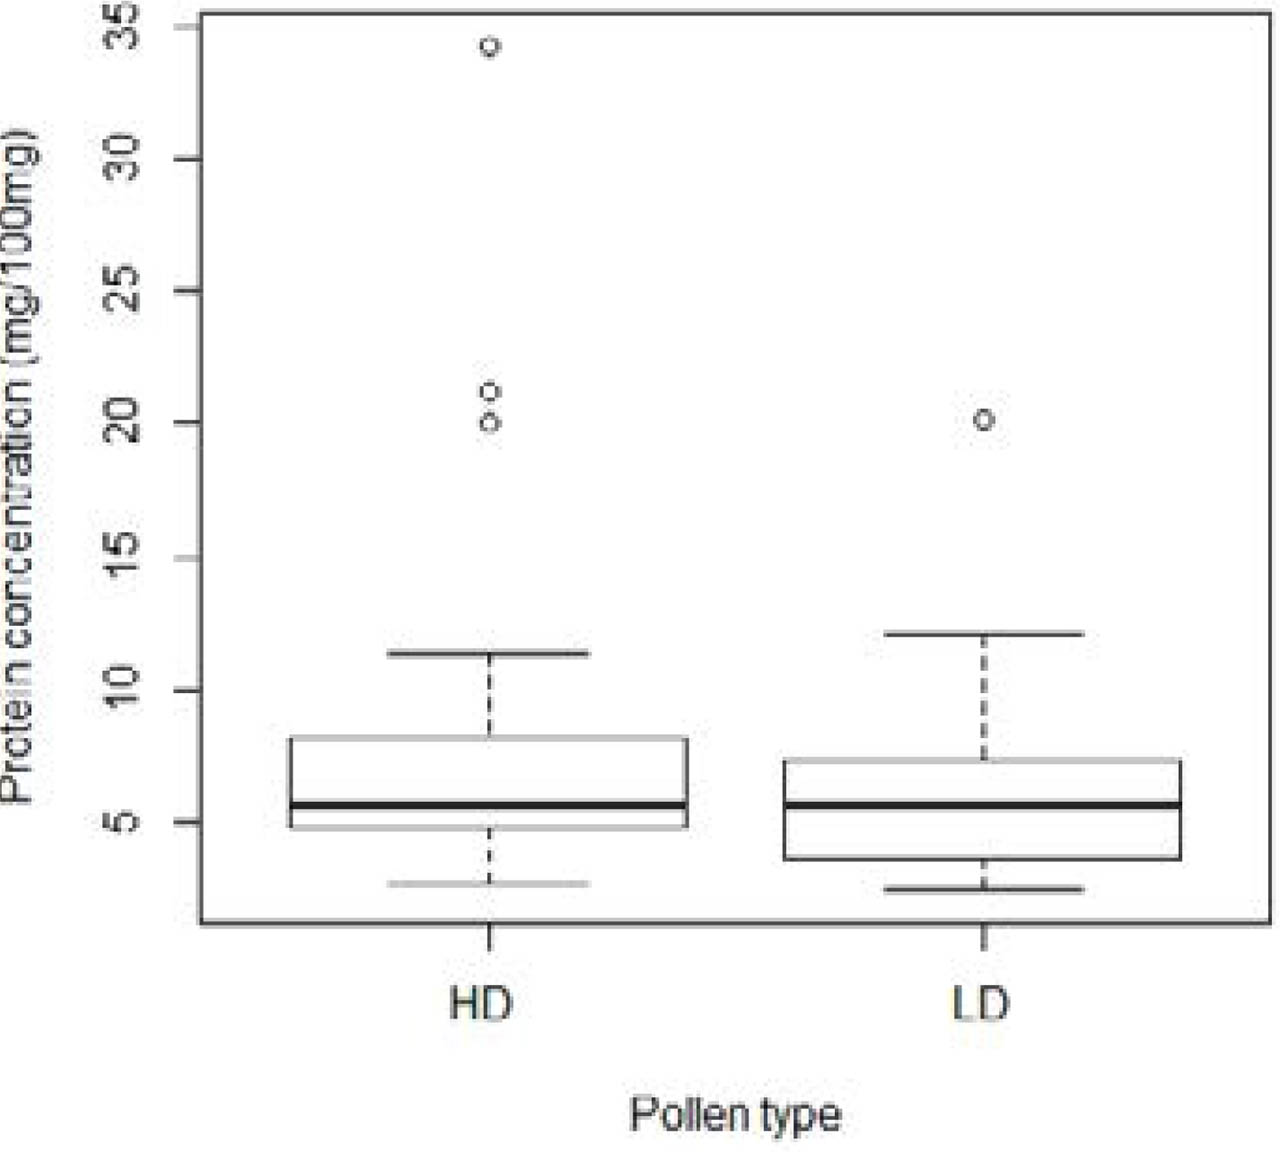
Fig. S1
Protein content of different pollen diets. HD – highly diverse pollen diet, LD – lowly diverse pollen diet.
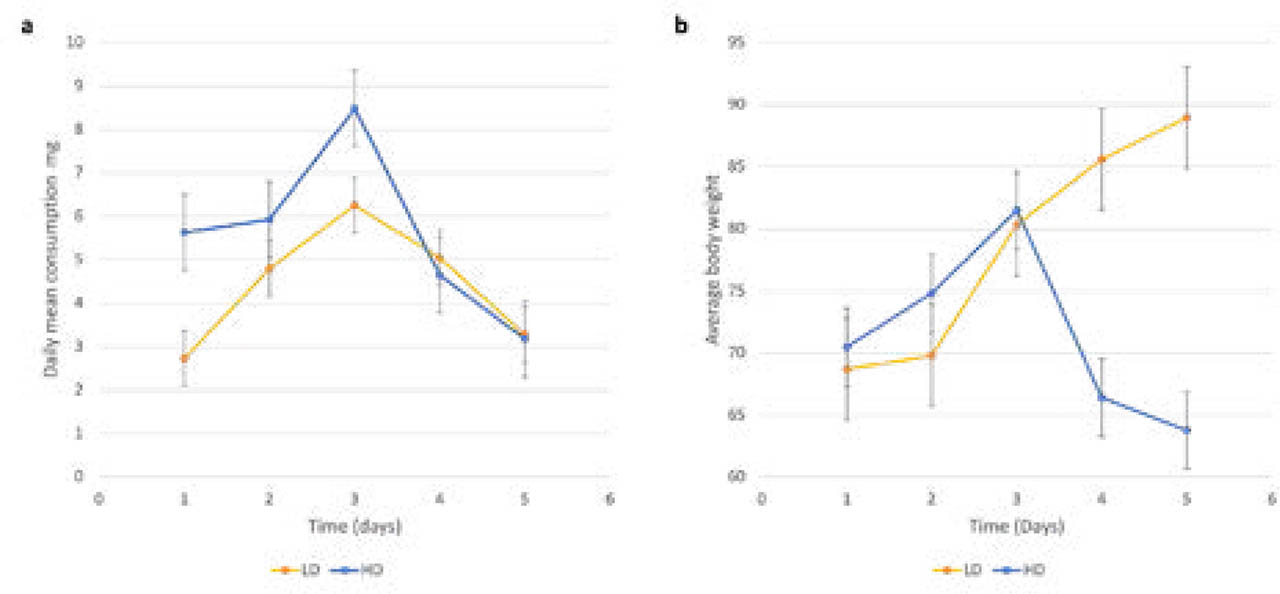
Fig. S2
Interaction plot for a) pollen consumption and b) daily bee body weight from day 1–5.
Blue line - highly diverse (HD) pollen diet, orange line - lowly diverse (LD) pollen diet.
