
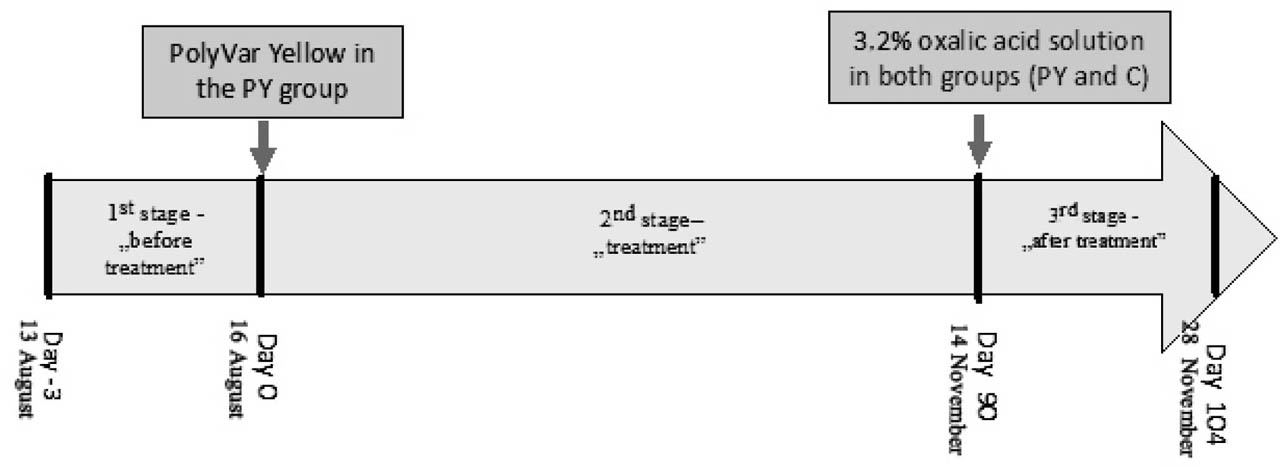
Fig. 1
Experimental design.
Table 1
The average daily fall of V. destructor on Varroa-sticky paper inserts and the average sum of fallen off parasites at various stages of the experiment in individual groups (with range and SD)
| Group | Stage I „before treatment” | Stage II „treatment” | Stage III „after treatment” | ||||||
|---|---|---|---|---|---|---|---|---|---|
| n | Average daily fall of V. destructor (range, SD) | Average no. of the parasite in the colony from the whole stage (range) | n | Average daily fall of V. destructor (range, SD) | Average no. of the parasite in the colony from the whole stage (range) | n | Average daily fall of V. destructor (range, SD) | Average no. of the parasite in the colony from the whole stage (range) | |
| PY | 10 | 14.50 (0.30–57.33) (24.38) | 43.50 (1–172) | 10 | 14.67 (0.30–88.86) (31.23) | 1320.90 (61–5098) | 10 | 1.44A (0.20–3.70) (1.00) | 20.10A (2–45) |
| C | 10 | 18.07 (0.30–23.66) (28.98) | 54.20 (1–177) | 9 | 15.76 (8.00–36.90) (29.14) | 1418.22 (260–3688) | 8 | 49.11B (14.20–157.30) (27.96) | 687,00B (426–1233) |
[i] Legend:
PY- a group of bee colonies treated for varroosis with PolyVar Yellow®
C- a group of bee colonies not-treated for varroosis
Capital letters indicate the significance of mean differences between the groups at p<0.01 in columns
Table 2
Average daily fall of V. destructor per one bee colony on Varroa-sticky board in subsequent months of the “treatment” stage in individual groups
| Group | Average daily fall per one bee colony of V. destructor at the “treatment” stage (range, SD) | ||
|---|---|---|---|
| 1st month | 2nd month | 3rd month | |
| PY n=10 | 41.59 (0.69–104.97) (56.08) | 2.38A (0.29–5.58) (1.95) | 1.56A (0.67–3.02) (0.92) |
| C n=10 | 28.36 (2.27–97.38) (35.77) | 21.92B (2.17–68.04) (19.27) | 11.23B (3.24–26.05) (8.42) |
[i] Legend:
PY- a group of bee colonies treated for varroosis with PolyVar Yellow®
C- a group of bee colonies not-treated for varroosis
Capital letters indicate the significance of mean differences between the groups at p<0.01 in columns
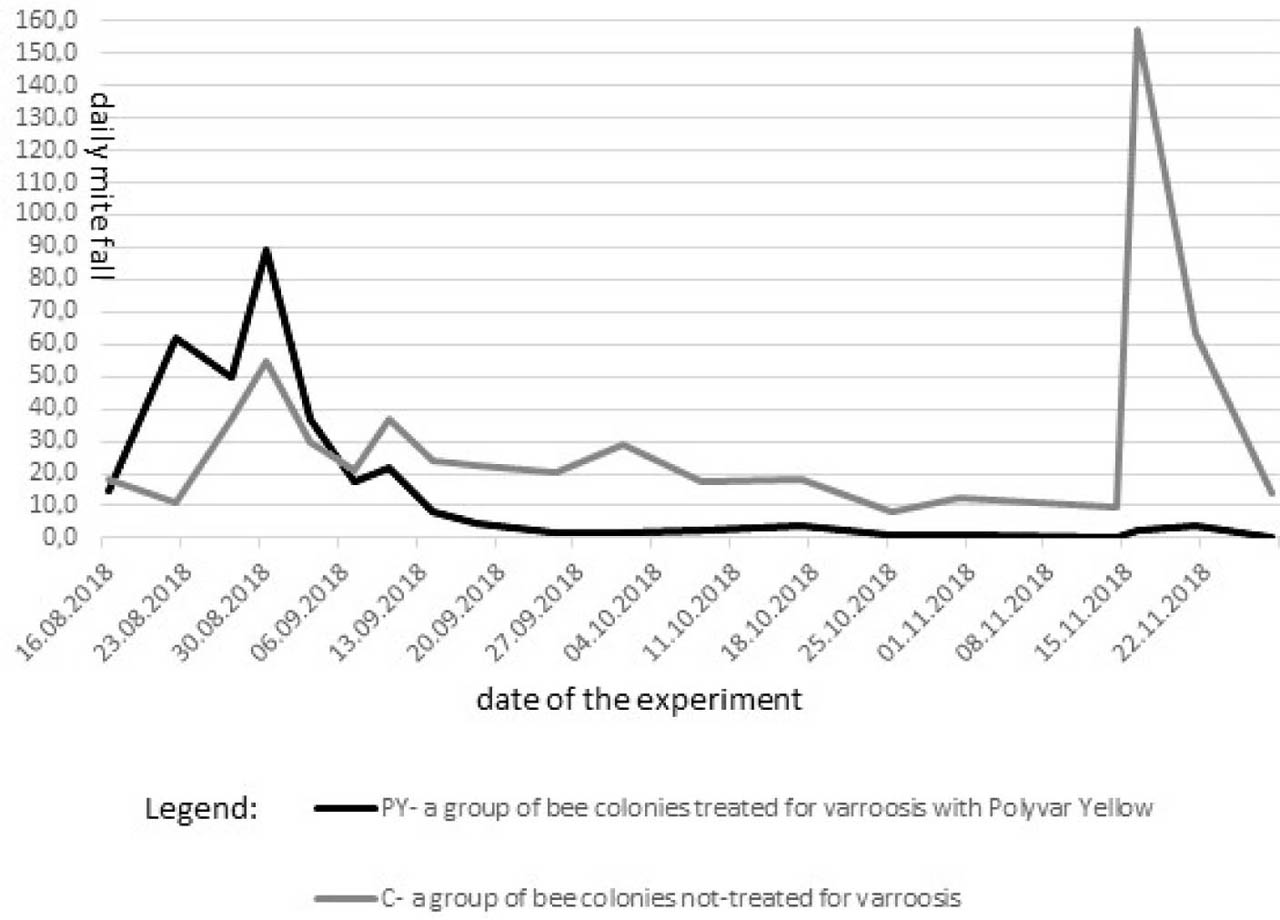
Fig. 2
Average daily mite fall of the bee colony in individual groups from subsequent collected Varroa-sticky inserts.
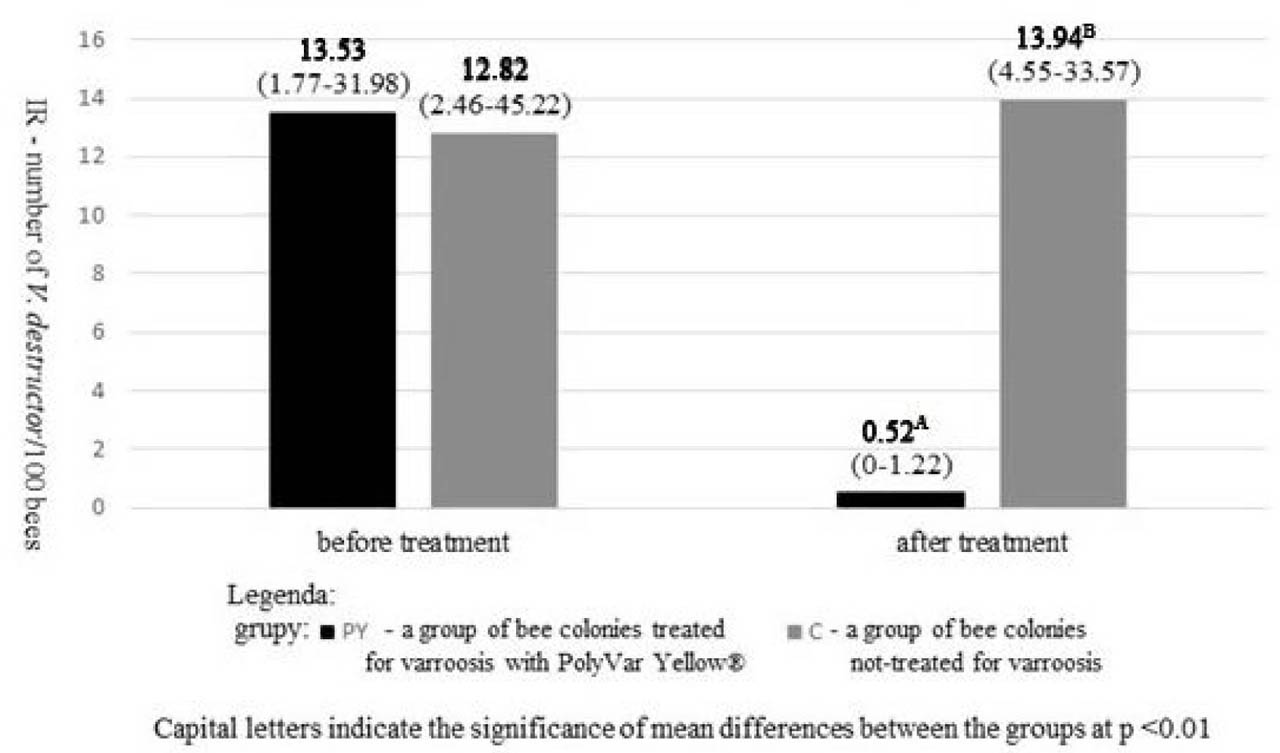
Fig. 3
Average infestation rate of bees with Varroa destructor (IR) [%] „before treatment” - IR0 and „after treatment” - IR1 with ranges
Table 3
Varroacide effectiveness of PolyVar Yellow® [%] in individual treated colonies
| group | the ID of bee colony (PY group) | Varroacide effectiveness of PolyVar Yellow® [%] | |
|---|---|---|---|
| based on the mite fall on the Varroa-sticky board during the treatment and after treatment | based on the infestation rate of bees with V. destructor before treatment and after treatment | ||
| PY | 30 | out* | 89.80 |
| 31 | out* | 95.62 | |
| 33 | 90.91 | 83.73 | |
| 36 | 99.42 | 90.69 | |
| 52 | 99.64 | 100.00 | |
| 53 | 98.85 | 100.00 | |
| 63 | 95.96 | 95.49 | |
| 66 | 89.96 | 97.43 | |
| 102 | 99.13 | 97.36 | |
| 111 | 99.50 | 98.14 | |
| mean | 97 | 95 | |
* results rejected due to less than 1/day parasite fall during “treatment” (Blacquičre et al., 2017)