
Table 1
Primer and Probe sequences of Acmvl and house gene 18S rRNA
| Name for gene and probe | Sequence |
|---|---|
| Acmvl | Forward: TGCATACGTTCCTGTCATTGTGG |
| Reverse: AGGTGGCATATTTCTCGGTTGTG | |
| 18S rRNA | Forward: CCCGTAATCGGAATGAGTACACTTT |
| Reverse: ACGCTATTGGAGCTGGAATTACC | |
| Acmvl anti-sense probe | CAAGAGTTACGAAGCCATCTCGACAAGTTT |
| CGCTGCCAATTGTCGAACAAGAGGGACAGA | |
| GATTGCCAGCTATGGGCCATCGACCGACAA |
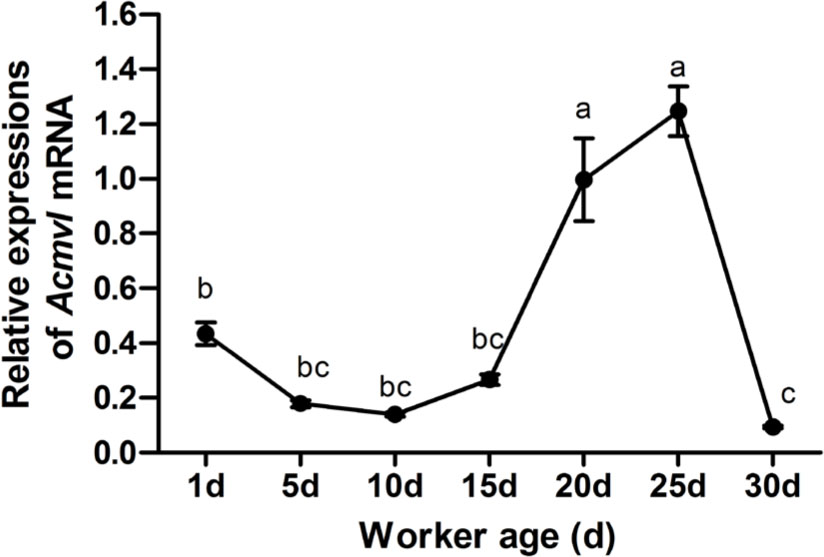
Fig. 1
Acmvl expression profile in age-marked worker bees. Bees were sampled at seven different time points separated by five-day intervals. Expression is relative to the value at day 30 (assigned the arbitrary value of one). Bars represent standard errors. Different letters indicate statistical differences.
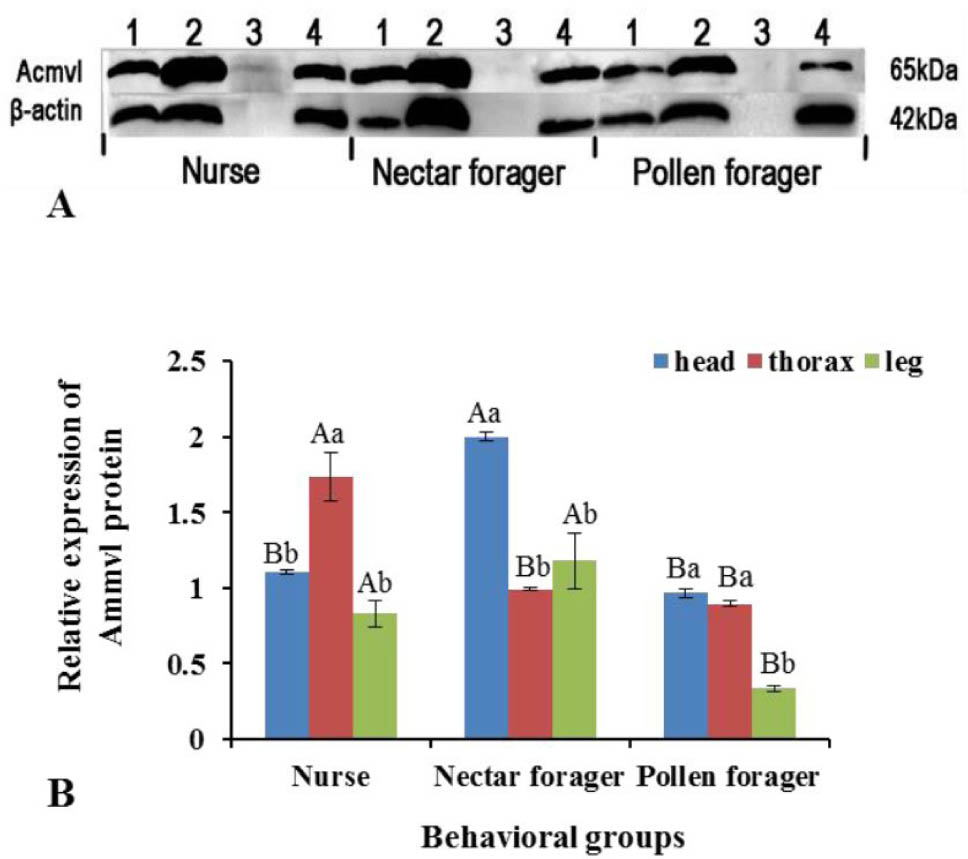
Fig. 2
Acmvl protein production in the tissues of nurse, nectar forager and pollen forager A. c. cerana bees.
A. The strip of Acmvl protein in four tissues. 1: Head (antennas included); 2: Thorax (wings included); 3: Abdomen; 4: Leg. β-actin was used as the internal control. B. The bar of Acmvl protein expression in three tissues. Image analysis was conducted using Image J. Bars represent the means of three independent experiments. Uppercase letters indicate differences between bee behavioral groups in protein production within the same tissue. Lowercase letters indicate differences between tissues within a behavioral group. Bars represent standard errors. Different letters represent statistical differences.
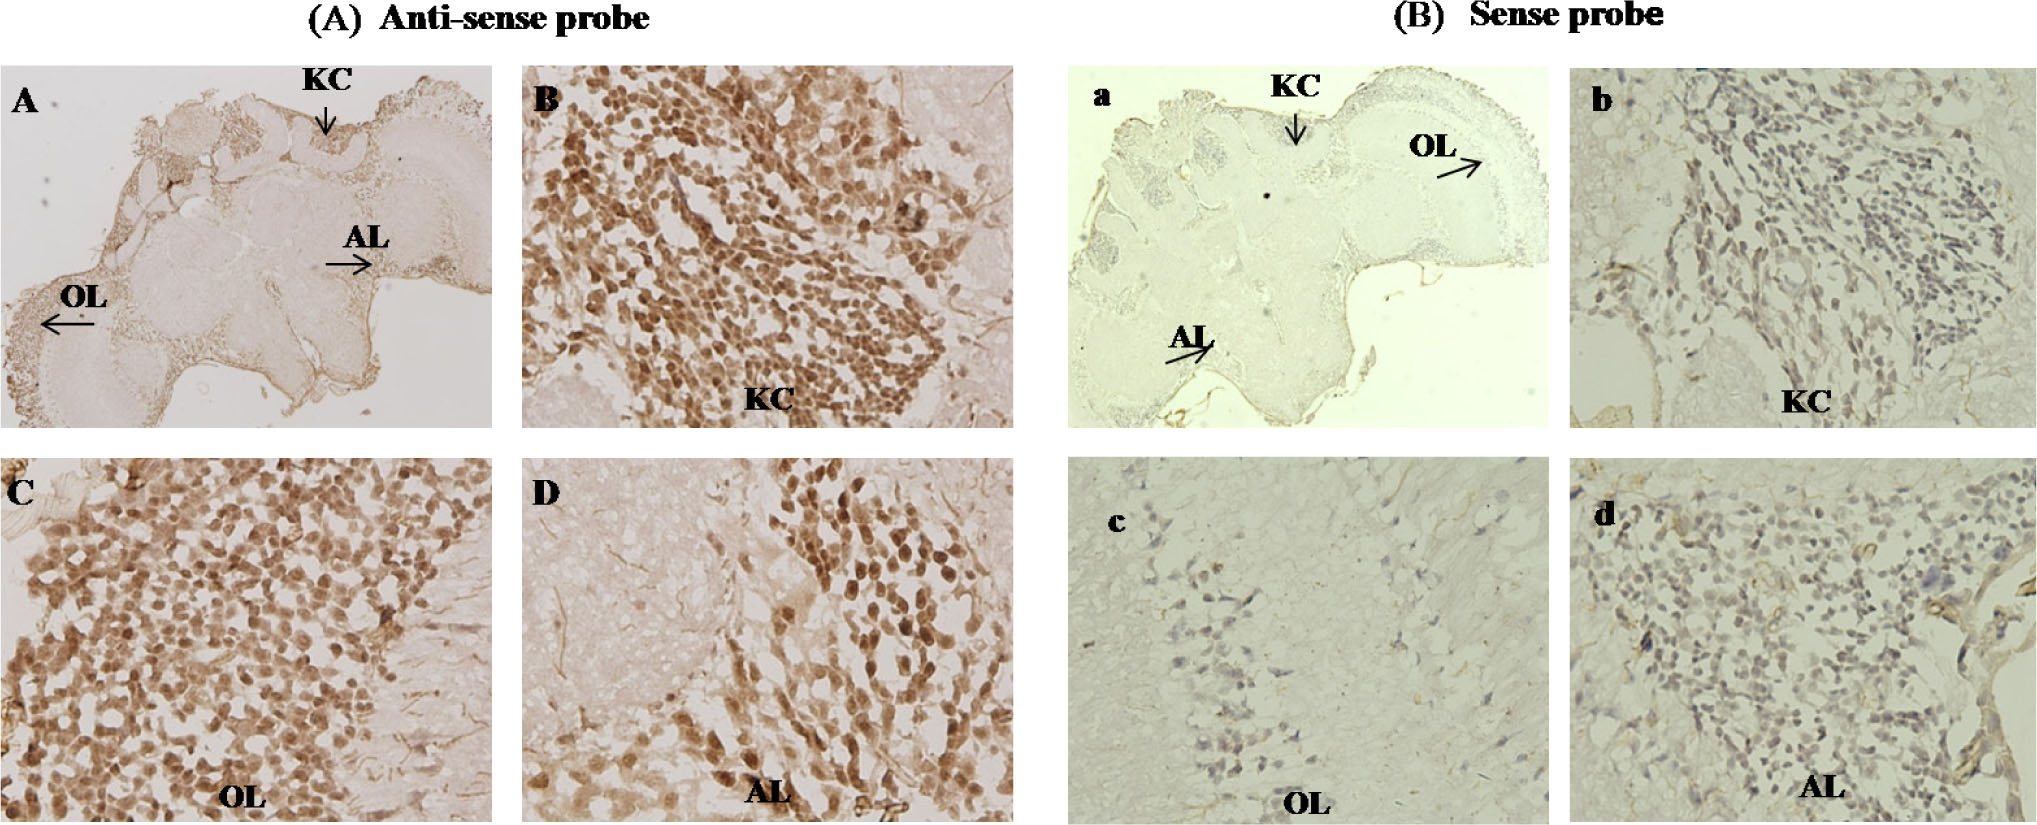
Fig. 3
Acmvl expression in pollen forager brains. Antennal lobes (AL); Kenyon cells (KC); Optic Lobes (OL).
(A) Treatment group hybridized with antisense probe; dark yellow particles are positive signals. (B) Control group hybridized with the sense probe. B, C, and D depict positive signals in Kenyon cells of the mushroom body, optic lobes, and antennal lobes, respectively, while b, c, and d depict negative controls for the corresponding regions.