
Table 1
Flowering period and abundance, lifespan of flowers and inflorescences in the studied species throughout the years of study
| Species | Year | Flowering period (days) | No. of flowers:* | Lifespan (days) of: * | ||
|---|---|---|---|---|---|---|
| inflorescence−1 | shrub−1 (thous.) | flower | inflorescence | |||
| Ribes aureum | 2014 | 17 April–9 May (23) | 7.6 ± 1.8 (20) | 8.7 ± 0.9 (4) | 7.2 ± 1.2 (20) | 15.7 ± 3.8 (15) |
| 2015 | 25 April–12 May (28) | 8.0 ± 1.7 (20) | 19.5 ± 2.3 (4) | 5.4 ± 0.7 (20) | 10.1 ± 1.3 (18) | |
| mean | (26) | 7.8C ± 1.8 (40) | 14.1AB ± 6.0 (8) | 6.3B ± 1.3 (40) | 12.6B ± 3.9 (33) | |
| Ribes sanguineum | 2014 | 25 March–14 April (20) | 19.1 ± 4.0 (20) | 5.2 ± 2.5 (4) | 8.6 ± 1.2 (20) | 19.3 ± 4.4 (18) |
| 2015 | 11 April–10 May (30) | 18.5 ± 4.0 (20) | 5.6 ± 1.7 (4) | 6.0 ± 0.7 (20) | 14.4 ± 1.8 (18) | |
| mean | (25) | 18.8B ± 4.4 (40) | 5.4B ± 1.9 (8) | 7.3A ± 1.6 (40) | 16.9A ± 4.1 (36) | |
| Staphylea pinnata | 2014 | 23 April–20 May (28) | 30.5 ± 8.0 (20) | 18.5 ± 9.7 (4) | 7.5 ± 1.5 (20) | - |
| 2015 | 28 April–26 May (29) | 40.0 ± 19.3 (20) | 92.9 ± 2.0 (4) | 6.8 ± 2.4 (20) | 19.0 ± 3.4 (20) | |
| mean | (29) | 35.2A ± 15.4 (40) | 55.7A ± 4.2 (8) | 7.1AB ± 2.1 (40) | 19.0A ± 3.4 (20) | |
| Mean for the year of study | 2014 | (24) | 19.1a ± 10.7 (60) | 10.8a ± 7.9 (24) | 7.7a ± 1.4 (60) | |
| 2015 | (29) | 22.2a ± 17.5 (60) | 39.3a ± 41.4 (24) | 6.0b ± 1.6 (60) | ||
* Data are means ± SD (numbers in brackets indicate number of flowers, inflorescences and shrubs, respectively). Means in columns with the same letter do not differ significantly among species (capital letters) (Kruskall-Wallis ANOVA, H - test) and between years of study (small letters) (Kolmogorov-Smirnov test); p > 0.05.
Table 2
Nectar and pollen production in flowers of the studied species throughout the years of study
| Species | Year | Nectar amount · flower−1 (mg) | Nectar sugar concentration (% w/w) | Nectar sugar amount · flower−1 (mg) | Pollen amount · flower−1 (mg) |
|---|---|---|---|---|---|
| Ribes aureum | 2014 | 5.3 ± 1.8 (22) | 28.3 ± 5.2 (22) | 1.5 ± 0.6 (22) | 0.4 ± 0.0 (6) |
| 2015 | 4.6 ± 2.1 (11) | 31.7 ± 9.1 (11) | 1.4 ± 0.6 (11) | 0.4 ± 0.1 (6) | |
| mean | 5.0A ± 1.9 (33) | 29.5A ± 6.8 (33) | 1.5A ± 0.6 (33) | 0.4B ± 0.1 (12) | |
| Ribes sanguineum | 2014 | 4.4 ± 1.5 (10) | 38.5 ± 4.5 (10) | 0.9 ± 0.3 (10) | 0.4 ± 0.1 (6) |
| 2015 | 2.3 ± 0.9 (11) | 30.1 ± 3.2 (11) | 0.7 ± 0.3 (11) | 0.4 ± 0.0 (6) | |
| mean | 3.2B ± 1.5 (21) | 34.1A ± 4.9 (21) | 0.8B ± 0.3 (21) | 0.4B ± 0.0 (12) | |
| Staphylea pinnata | 2014 | 4.6 ± 1.7 (21) | 35.4 ± 11.4 (21) | 1.5 ± 0.4 (21) | 0.8 ± 0.1 (6) |
| 2015 | 5.6 ± 2.5 (19) | 30.7 ± 7.4 (19) | 1.7 ± 0.8 (19) | 0.8 ± 0.1 (6) | |
| mean | 5.1A ± 2.2 (40) | 33.2A ± 28.6 (40) | 1.6A ± 0.6 (40) | 0.8A ± 0.1 (12) |
[i] Data are means ± SD (numbers in brackets indicate number of collected samples). Untransformed data are presented. Means in columns with the same letter do not differ significantly among species (HSD Tukey's test, p > 0.05)
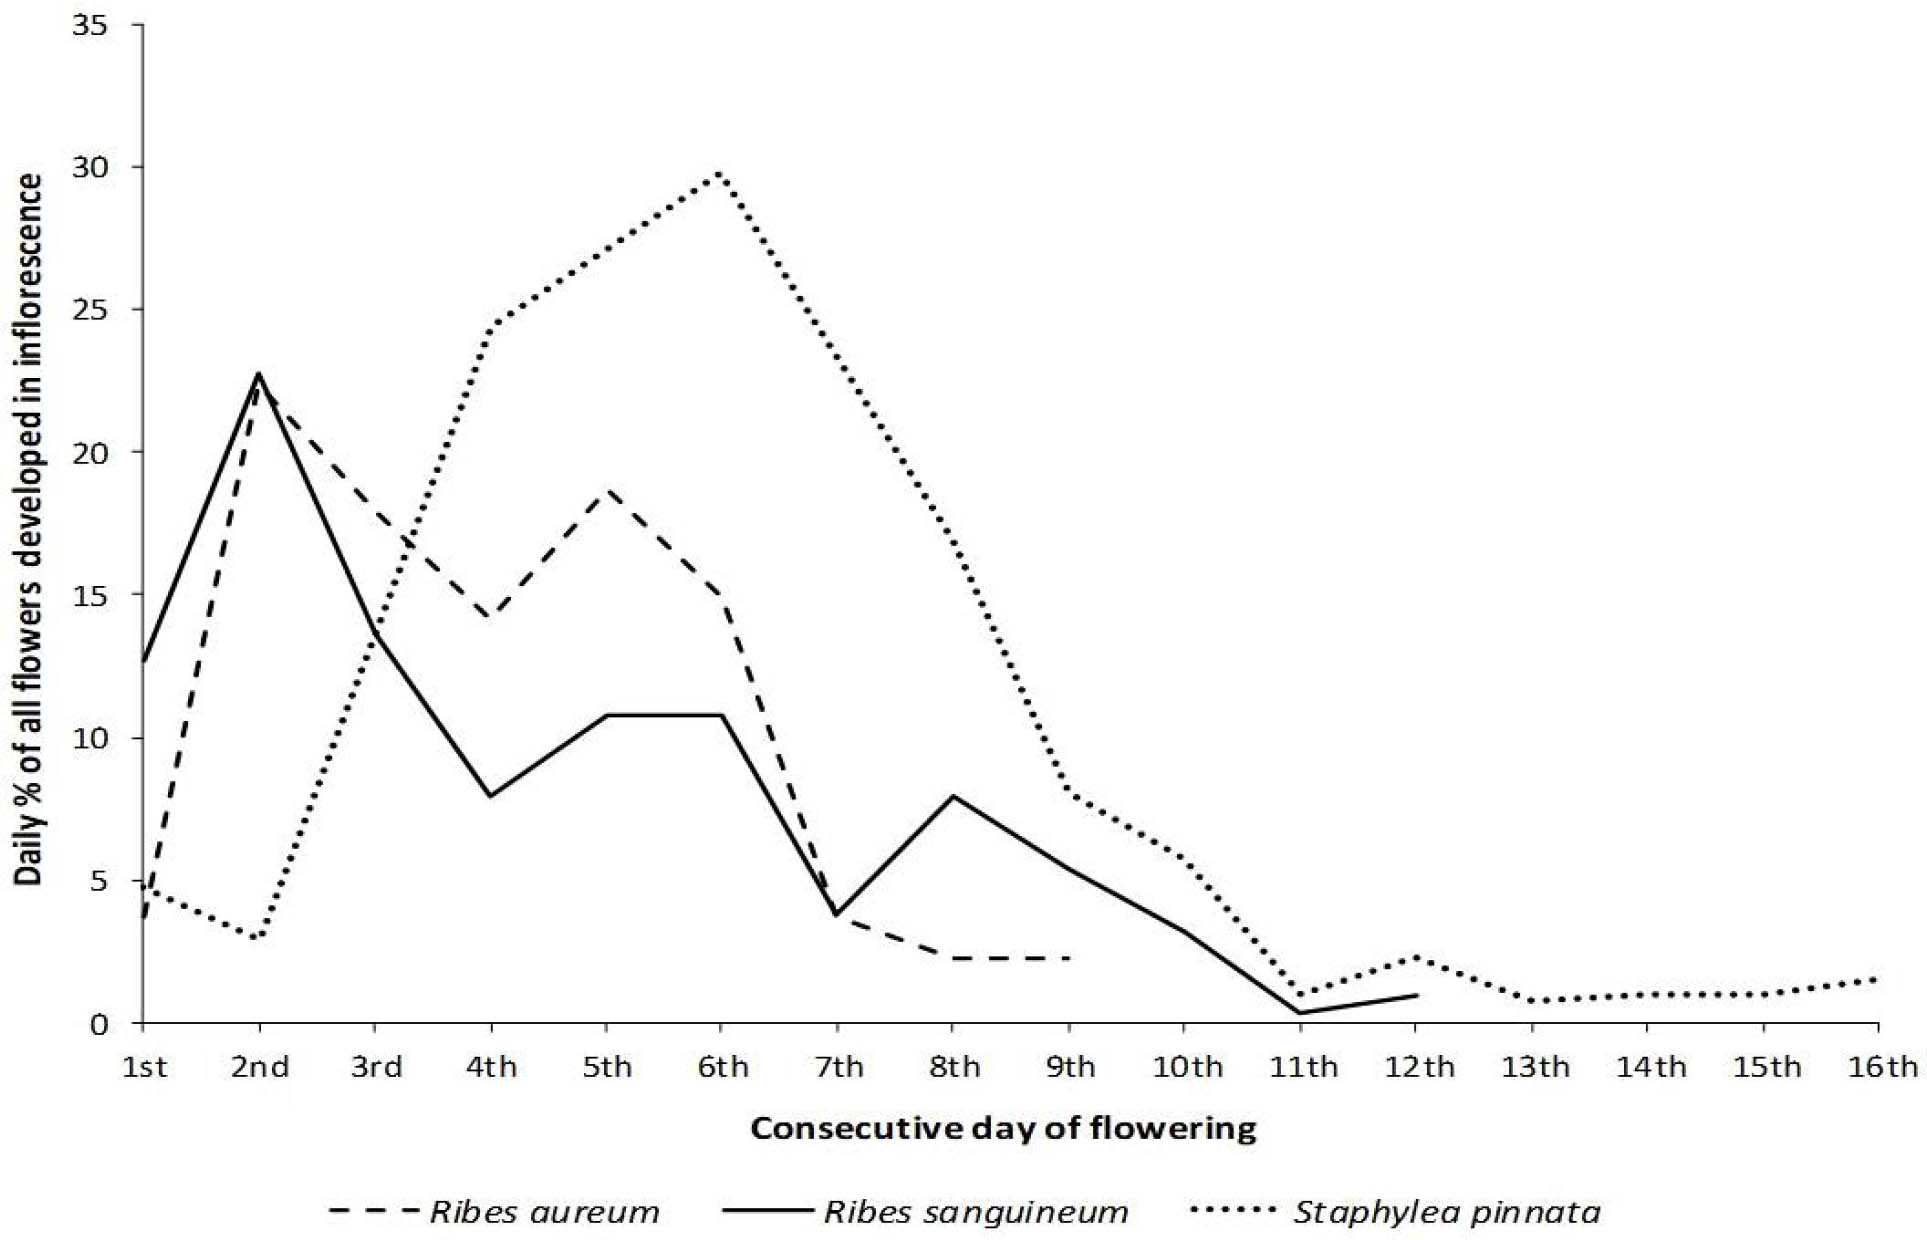
Fig. 1
Inflorescence flowering pattern in the studied species in 2015. Mean values are presented (n = 16; n - number of inflorescences).
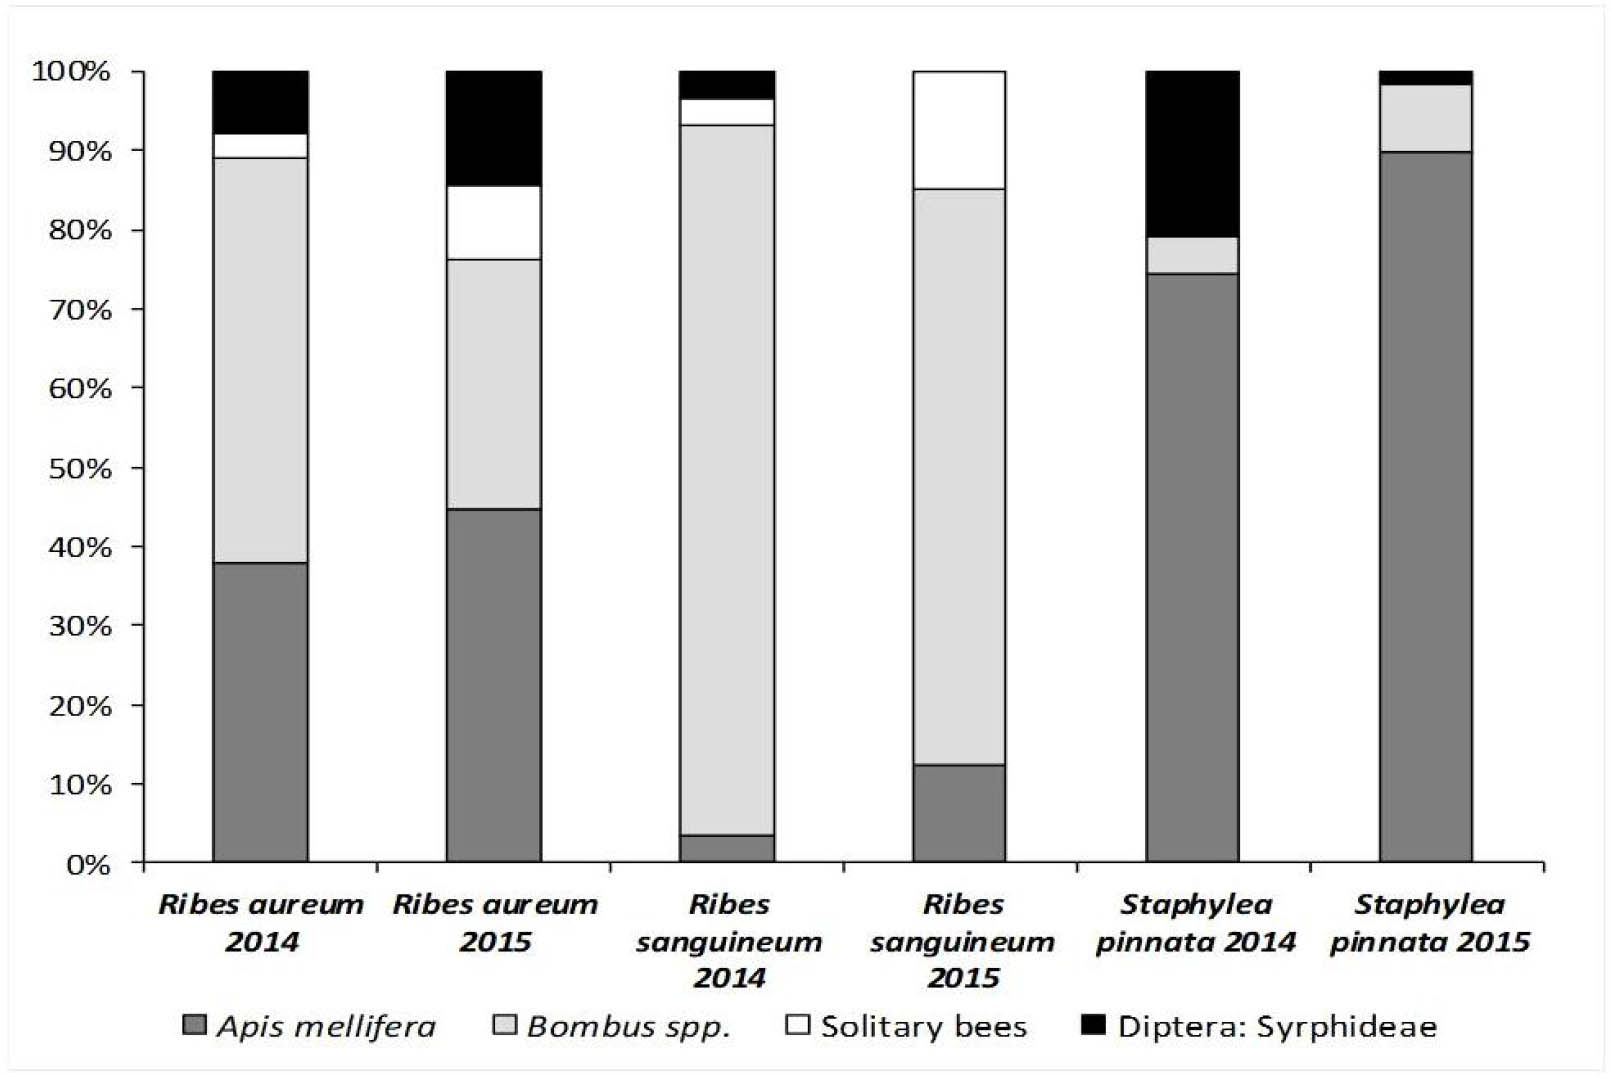
Fig. 2
Insect visits expressed as the percentage of total visits to the flowers of the studied species recorded in a particular study year and groups of flower visitors.
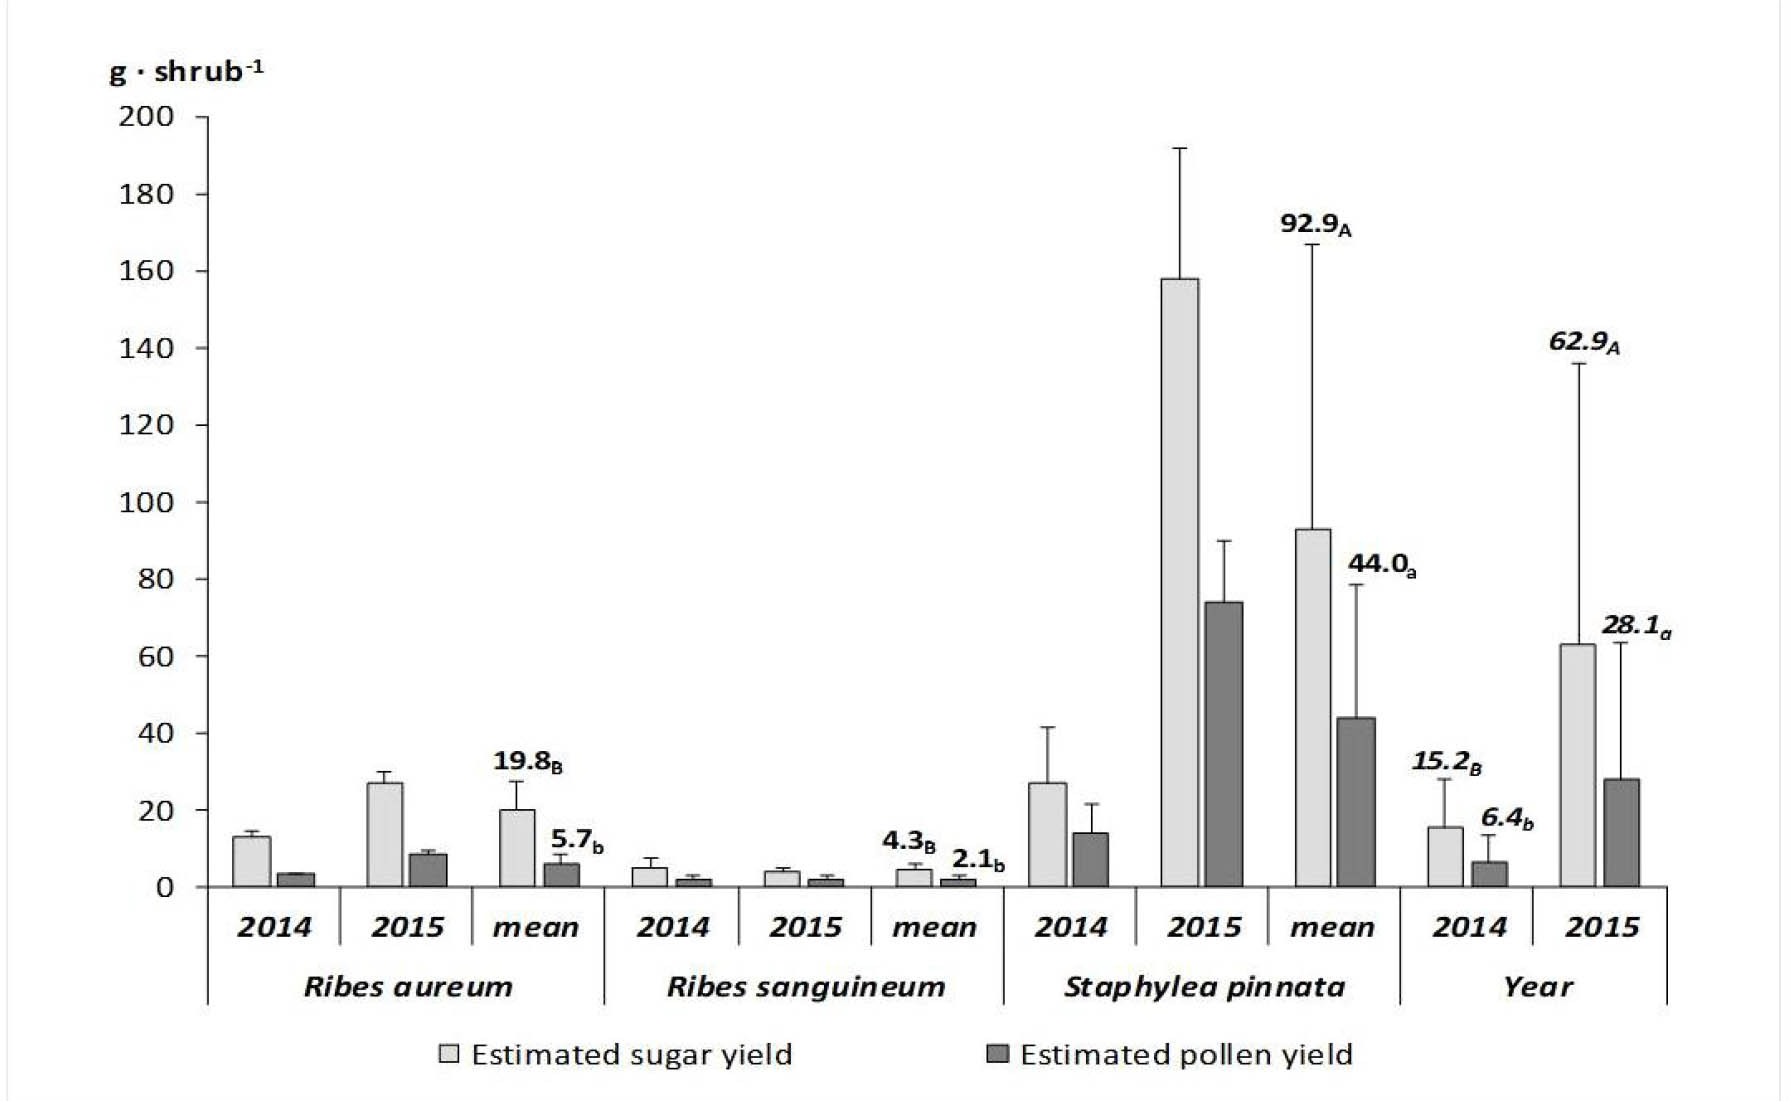
Fig. 3
Estimated nectar sugar yield and pollen yield (± SD) delivered per plant of the studied species. Mean values are presented for 2014 and 2015, and means from four plants of each species were calculated. Different letters indicate significant differences among the species and between the years of study (italics), separately for nectar sugar yield (capital letters) and pollen yield (small letters), (post-hoc HSD Tukey test, p < 0.05).