
Table 1
Characteristics of the diets used for the two assays and the corresponding number of treated colonies
| Diet | Raw material consistency | Final consistency | Sugar syrup (%) | N° of colonies |
|---|---|---|---|---|
| First assay | ||||
| Pollen paste | Pellets | Paste | 23 | 16 |
| Pollen pellets | Pellets | Pellets | 0 | 8 |
| Feedbee® powder | Powder | Paste | 33 | 17 |
| Feedbee® paste | Paste | Paste | 0 | 10 |
| Candipolline® | Paste | Paste | 0 | 9 |
| Bee Food® | Paste | Paste | 0 | 9 |
| Karya Ari Keki® | Paste | Paste | 0 | 9 |
| Chestnut flour | Powder | Paste | 45 | 7 |
| Brewer's yeast | Powder | Paste | 43 | 8 |
| Nutri-Bombus® A | Paste | Paste | 0 | 11 |
| Nutri-Bombus® B | Paste | Paste | 0 | 11 |
| Nutri-Bombus® C | Paste | Paste | 0 | 10 |
| Total | 125 | |||
| Second assay | ||||
| Pollen paste | Pellets | Paste | 18.5 | 10 |
| 25% Feedbee® + 75% Pollen paste | Paste | Paste | 13.9 | 9 |
| 50% Feedbee® + 50% Pollen paste | Paste | Paste | 9.3 | 9 |
| Total | 28 | |||
Table 2
Effects of different pollen substitutes on number of dead larvae within 24 days, number of dead adults within 24 days, colony duration, and number of emerged workers of artificially reared bumble bees
| Pollen substitute | Colony duration (days) | Dead adults (n) | Dead larvae (n) | Emerged workers (n) |
|---|---|---|---|---|
| Candipolline® | 80 ± 3 ab | 12 ± 2 ab | 18 ± 3 b | 2 ± 1 b |
| Bee Food® | 70 ± 1 bc | 23 ± 4 a | 32 ± 5 b | 13 ± 4 ab |
| Feedbee® powder | 89 ± 3 a | 8 ± 2 bcd | 30 ± 4 b | 11 ± 3 ab |
| Karya Ari Keky® | 70 ± 1 bc | 25 ± 4 a | 25 ± 4 b | 8 ± 3 ab |
| Brewers’ yeast | 81 ± 6 ab | 4 ± 1 cd | 23 ± 4 b | 7 ± 2 ab |
| Chestnut flour | 59 ± 2 c | 8 ± 2 bcd | 19 ± 4 b | 4 ± 1 ab |
| Feedbee® paste | 70 ± 2 bc | 10 ± 2 bc | 60 ± 4 a | 8 ± 3 ab |
| Nutri-Bombus® A | 75 ± 5 abc | 3 ± 1 d | 35 ± 7 ab | 12 ± 4 ab |
| Nutri-Bombus® B | 86 ± 4 ab | 3 ± 1 d | 34 ± 5 b | 17 ± 6 a |
| Nutri-Bombus® C | 79 ± 6 ab | 3 ± 1 d | 40 ± 8 ab | 7 ± 3 ab |
[i] Different letters indicate significant differences among treatments (p ≤ 0.05, GT2-method). Values are median ± SE.
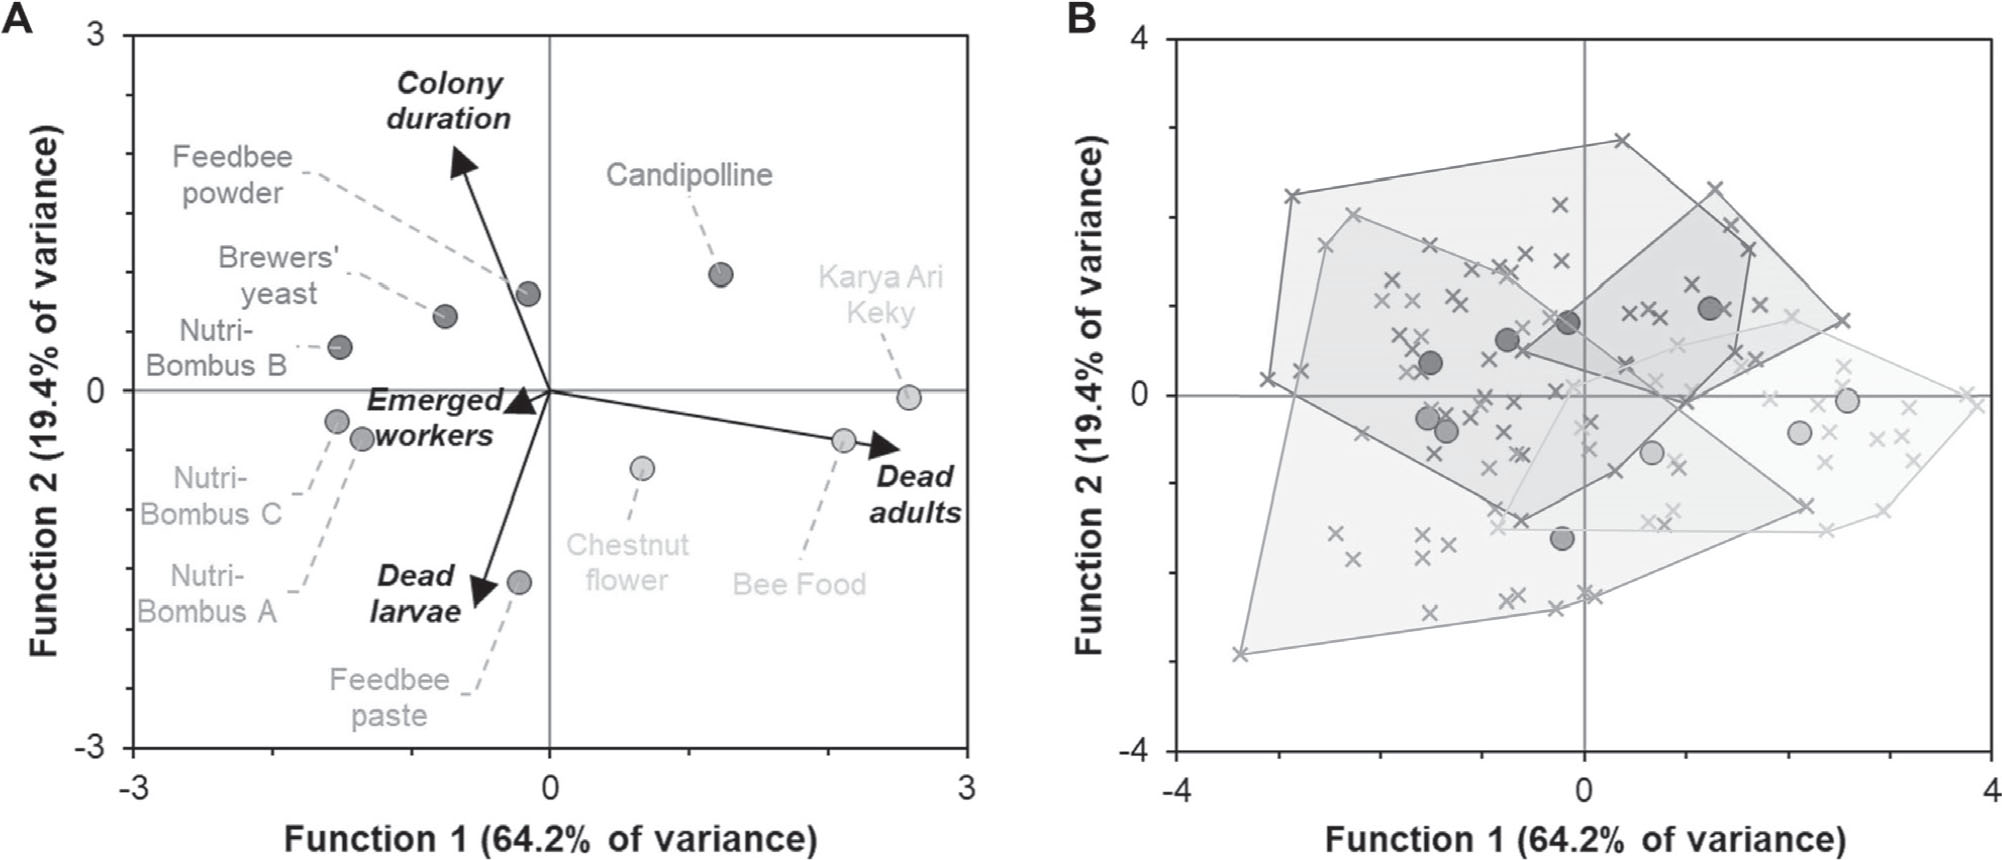
Fig. 1
Projection on the first two discriminant functions of different pollen substitutes for the feeding of artificially reared bumble bees. Circles represent treatment centroids of each pollen substitute. (A) Correlation biplot based on discriminant analysis (DA). Differently discriminated centroids of pollen substitutes are in different DA quadrants. Explanatory variables are shown as arrows magnified three times for graphical purposes. (B) Canonical scores of individual colonies (crosses) on first two discriminant functions. Different groups are shown with different grayscale crosses and enclosed by an envelope.
Table 3
Number of dead larvae, dead adults and produced gynes, and pre-switch and pre-gyne point period in colonies fed with pure pollen paste and pollen paste mixed with 25% and 50% Feedbee®
| Diet | Dead larvae | Dead adults | Number of produced gynes | Pre-gyne point period | Pre-switch point period |
|---|---|---|---|---|---|
| Pollen paste | 4 ± 1 | 1 ± 0.2 b | 134 ± 23 | 51 ± 3 | 56 ± 3 |
| 25% Feedbee® + 75% Pollen paste | 4 ± 2 | 2 ± 0.4 ab | 157 ± 17 | 52 ± 3 | 47 ± 4 |
| 50% Feedbee® + 50% Pollen paste | 5 ± 2 | 3 ± 1 a | 109 ± 18 | 51 ± 1 | 56 ± 3 |
[i] Different letters indicate significant differences among treatments (p ≤ 0.05, GT2-method). Values are median ± SE.
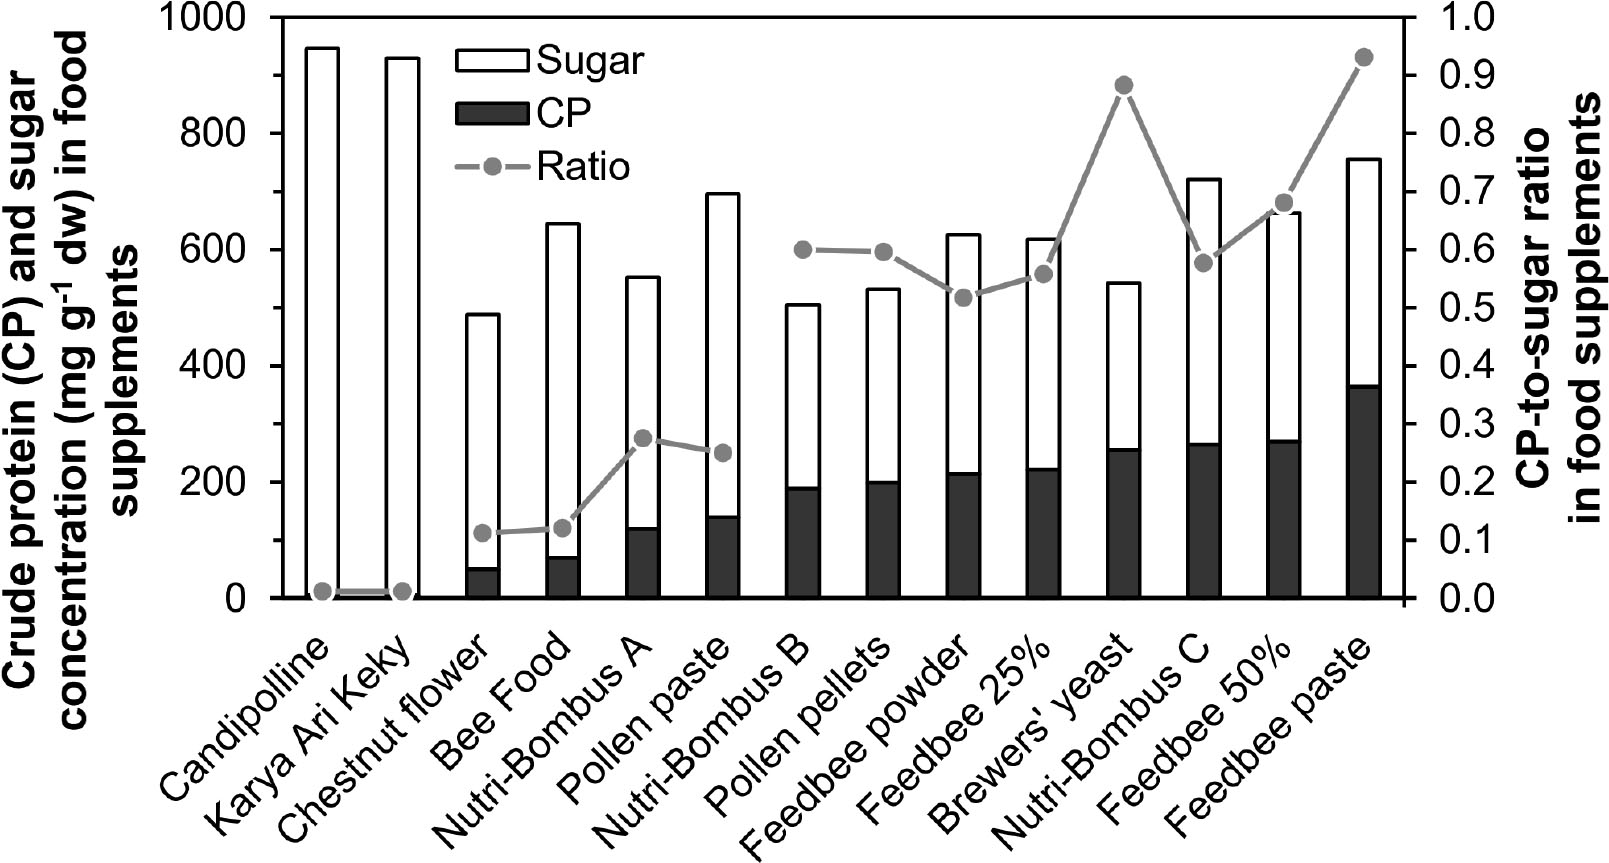
Fig. 2
Crude protein (CP) and sugar (summation of sucrose, glucose and fructose) concentration, and CP-to-sugar ratio of the tested diets. Diets were shown in ascending order of CP concentration. CP-to-sugar ratios connected by a line identified diets belonging to the same cluster after principal coordinates analysis (PCoA) on Goodall probabilistic similarity index.
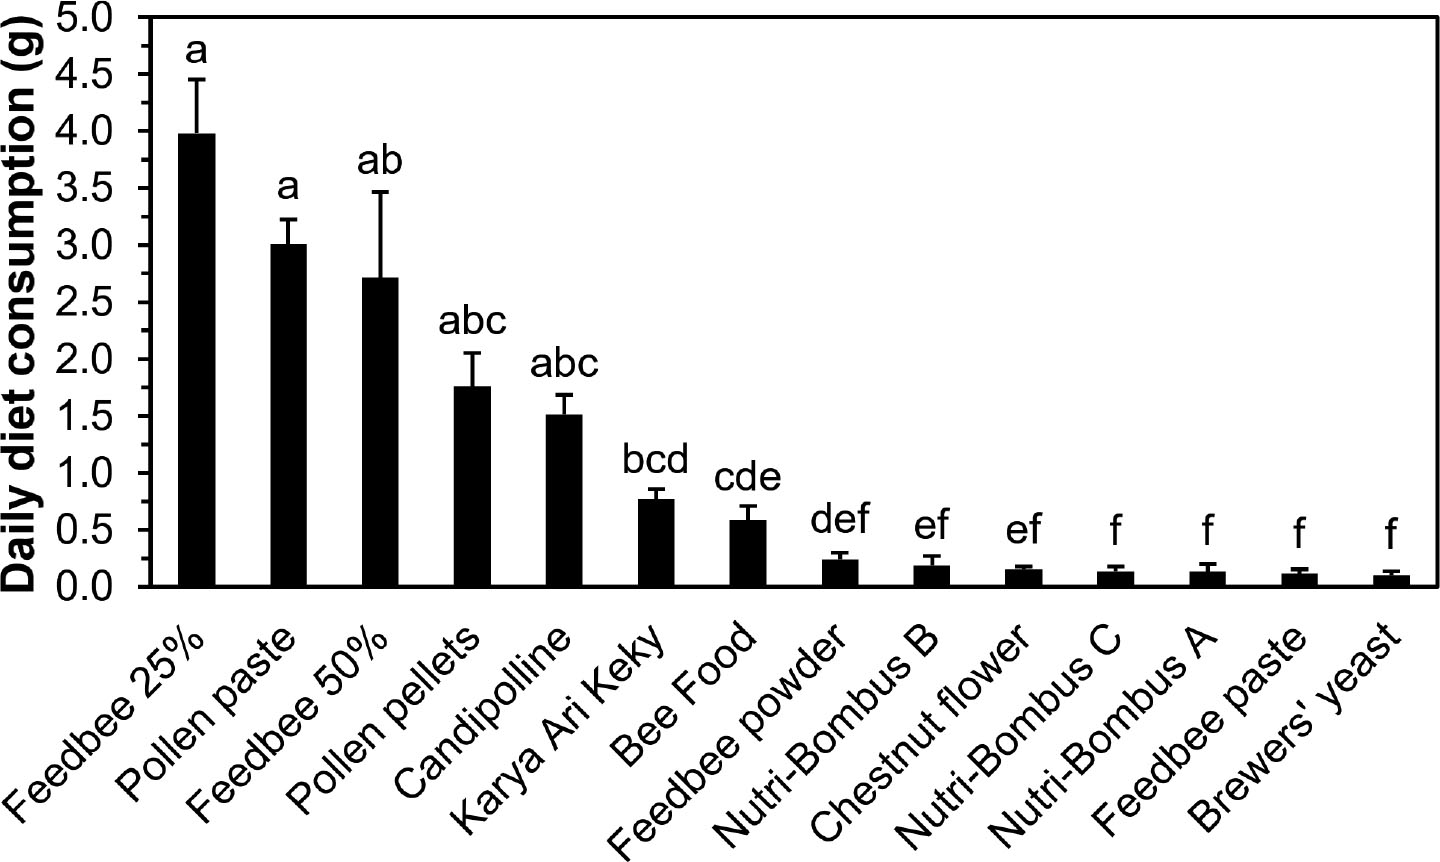
Fig. 3
Daily diet consumption of different test diets in descending order of consumption. Different letters indicate significant differences in concentration among test diets (p ≤ 0.05, GT2-method). Values are median + SE, n comprised between 7 and 26.
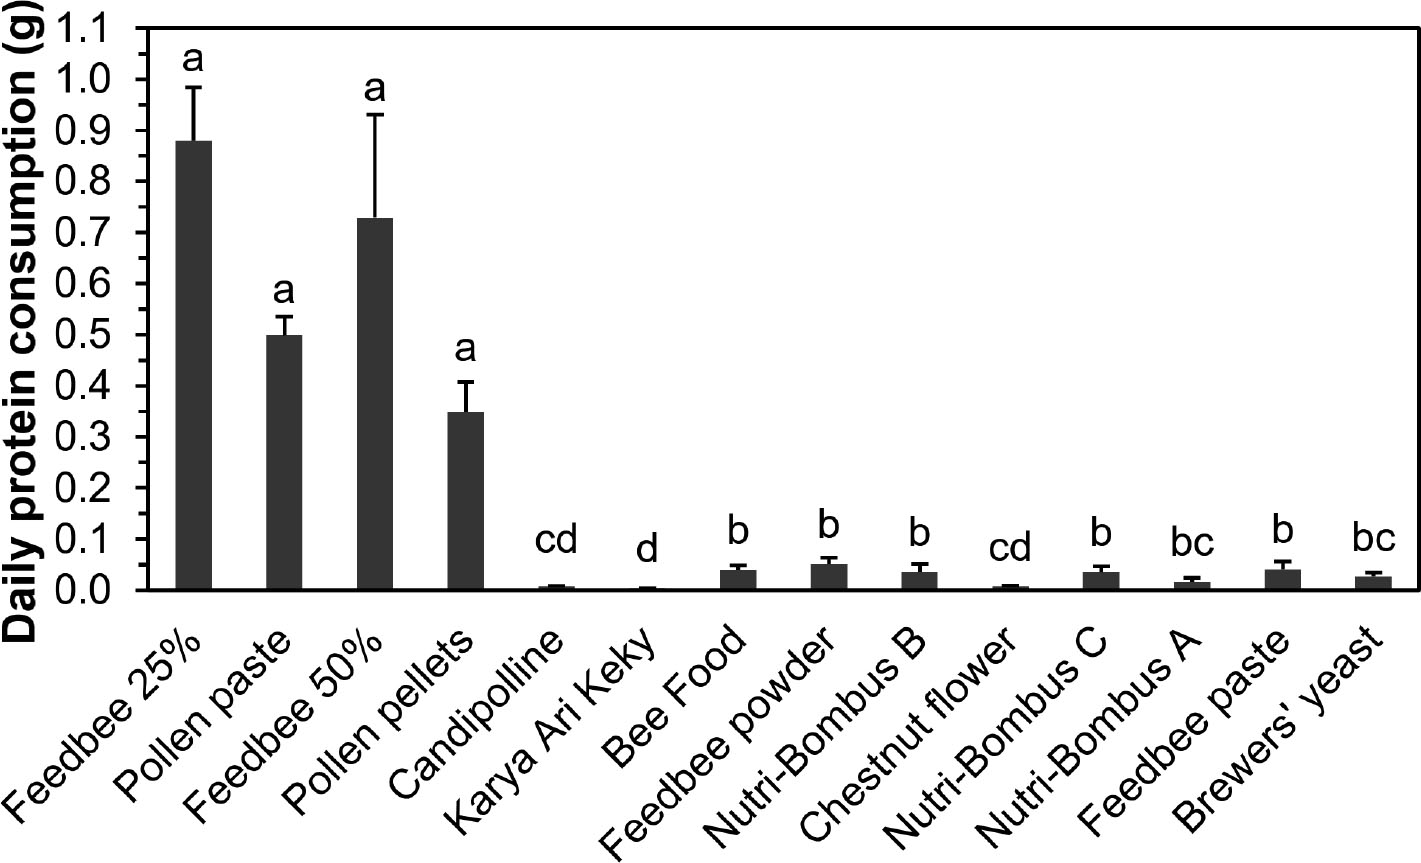
Fig. 4
Daily protein consumption of the different test diets. Different letters indicate significant differences in concentration among test diets (p ≤ 0.05, GT2-method). Values are median + SE, n comprised between 7 and 26. For comparisons purposes, diets were ordered according to descending order of daily total consumption as in Fig. 3.
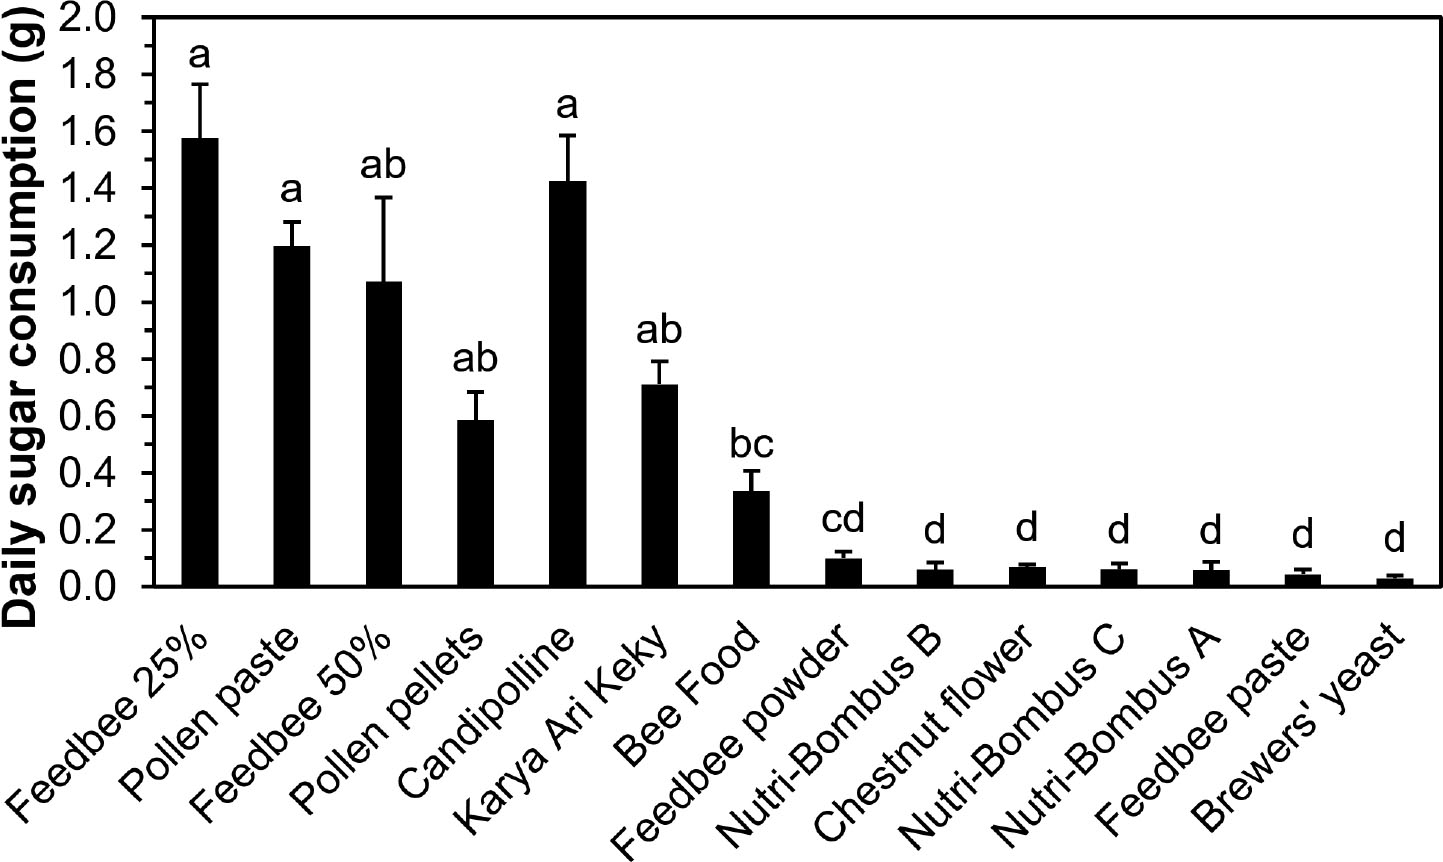
Fig. 5
Daily sugar consumption of the different test diets. Different letters indicate significant differences in concentration among test diets (p ≤ 0.05, GT2-method). Values are median + SE, n comprised between 7 and 26. For comparisons purposes, diets were ordered according to descending order of daily total consumption as in Fig. 3.