
Table 1
Recent studies on beekeeping suitability and criteria
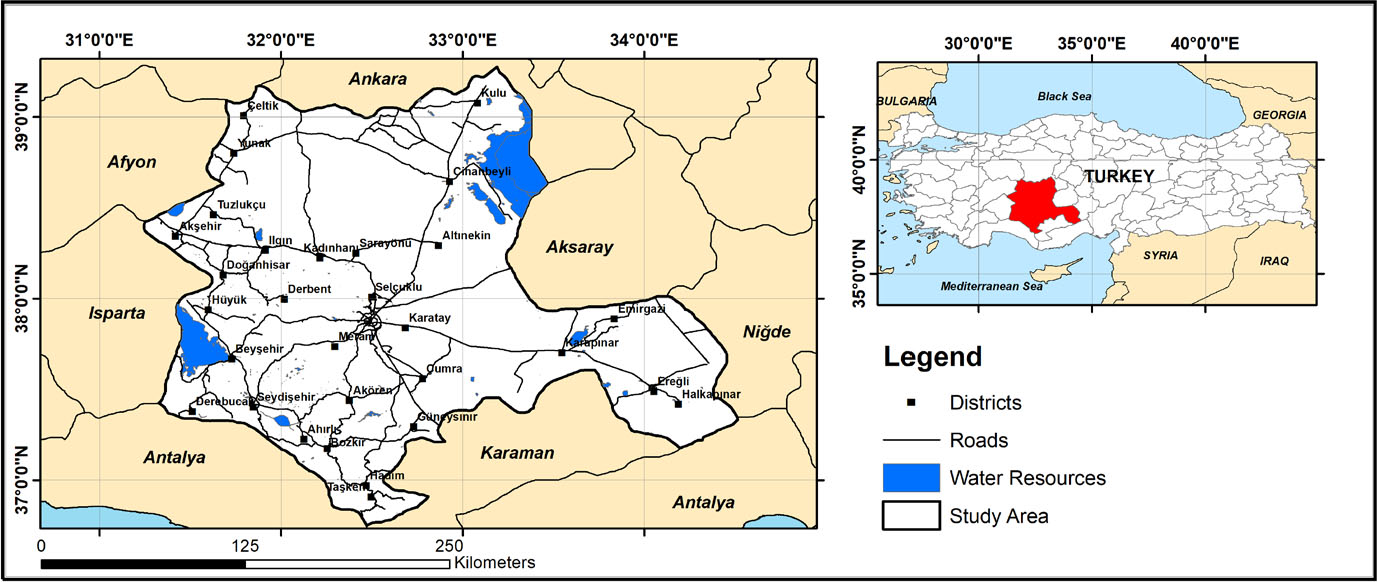
Fig. 1
The boundaries of the study area (Konya province).
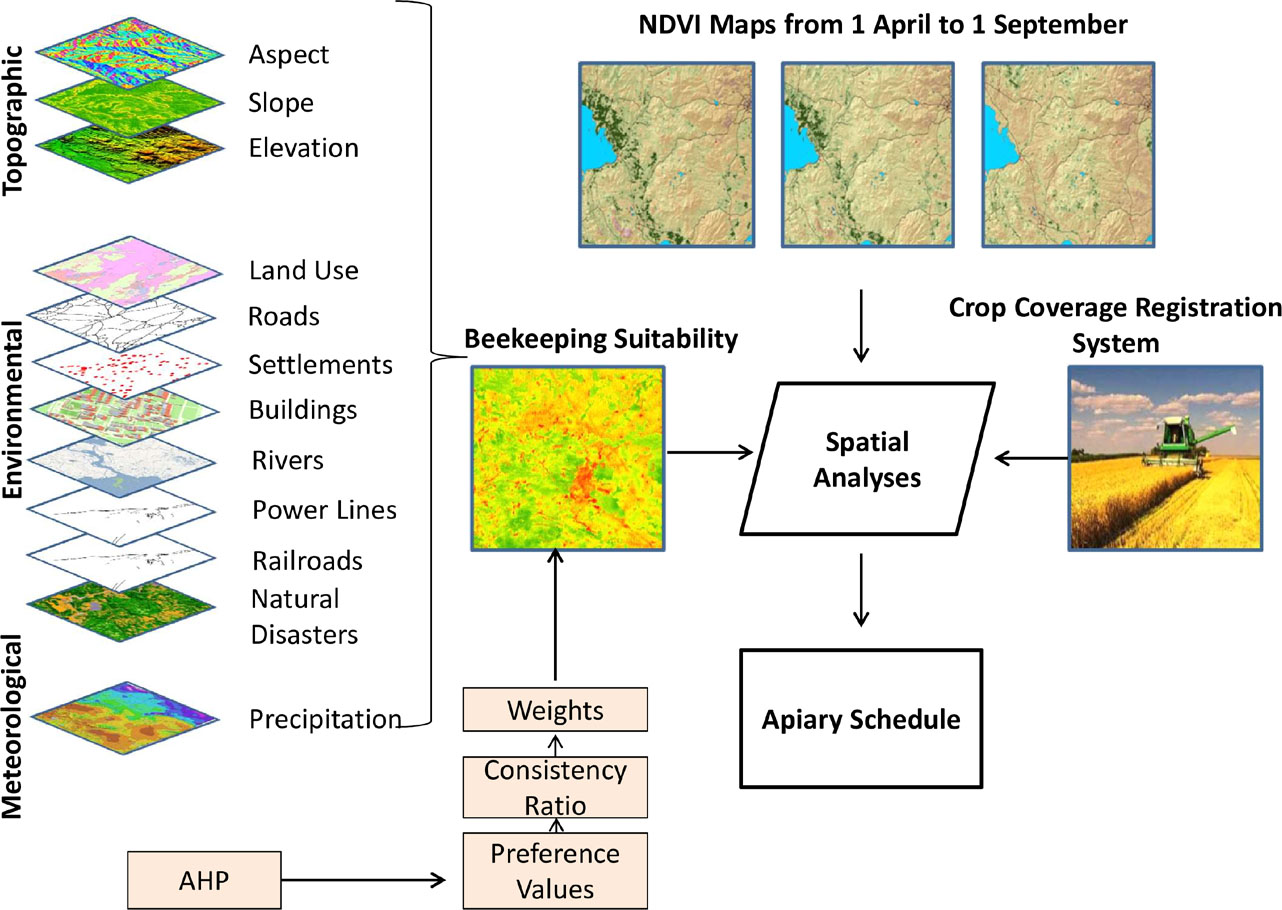
Fig. 2
The implementation model of the apiary schedule.
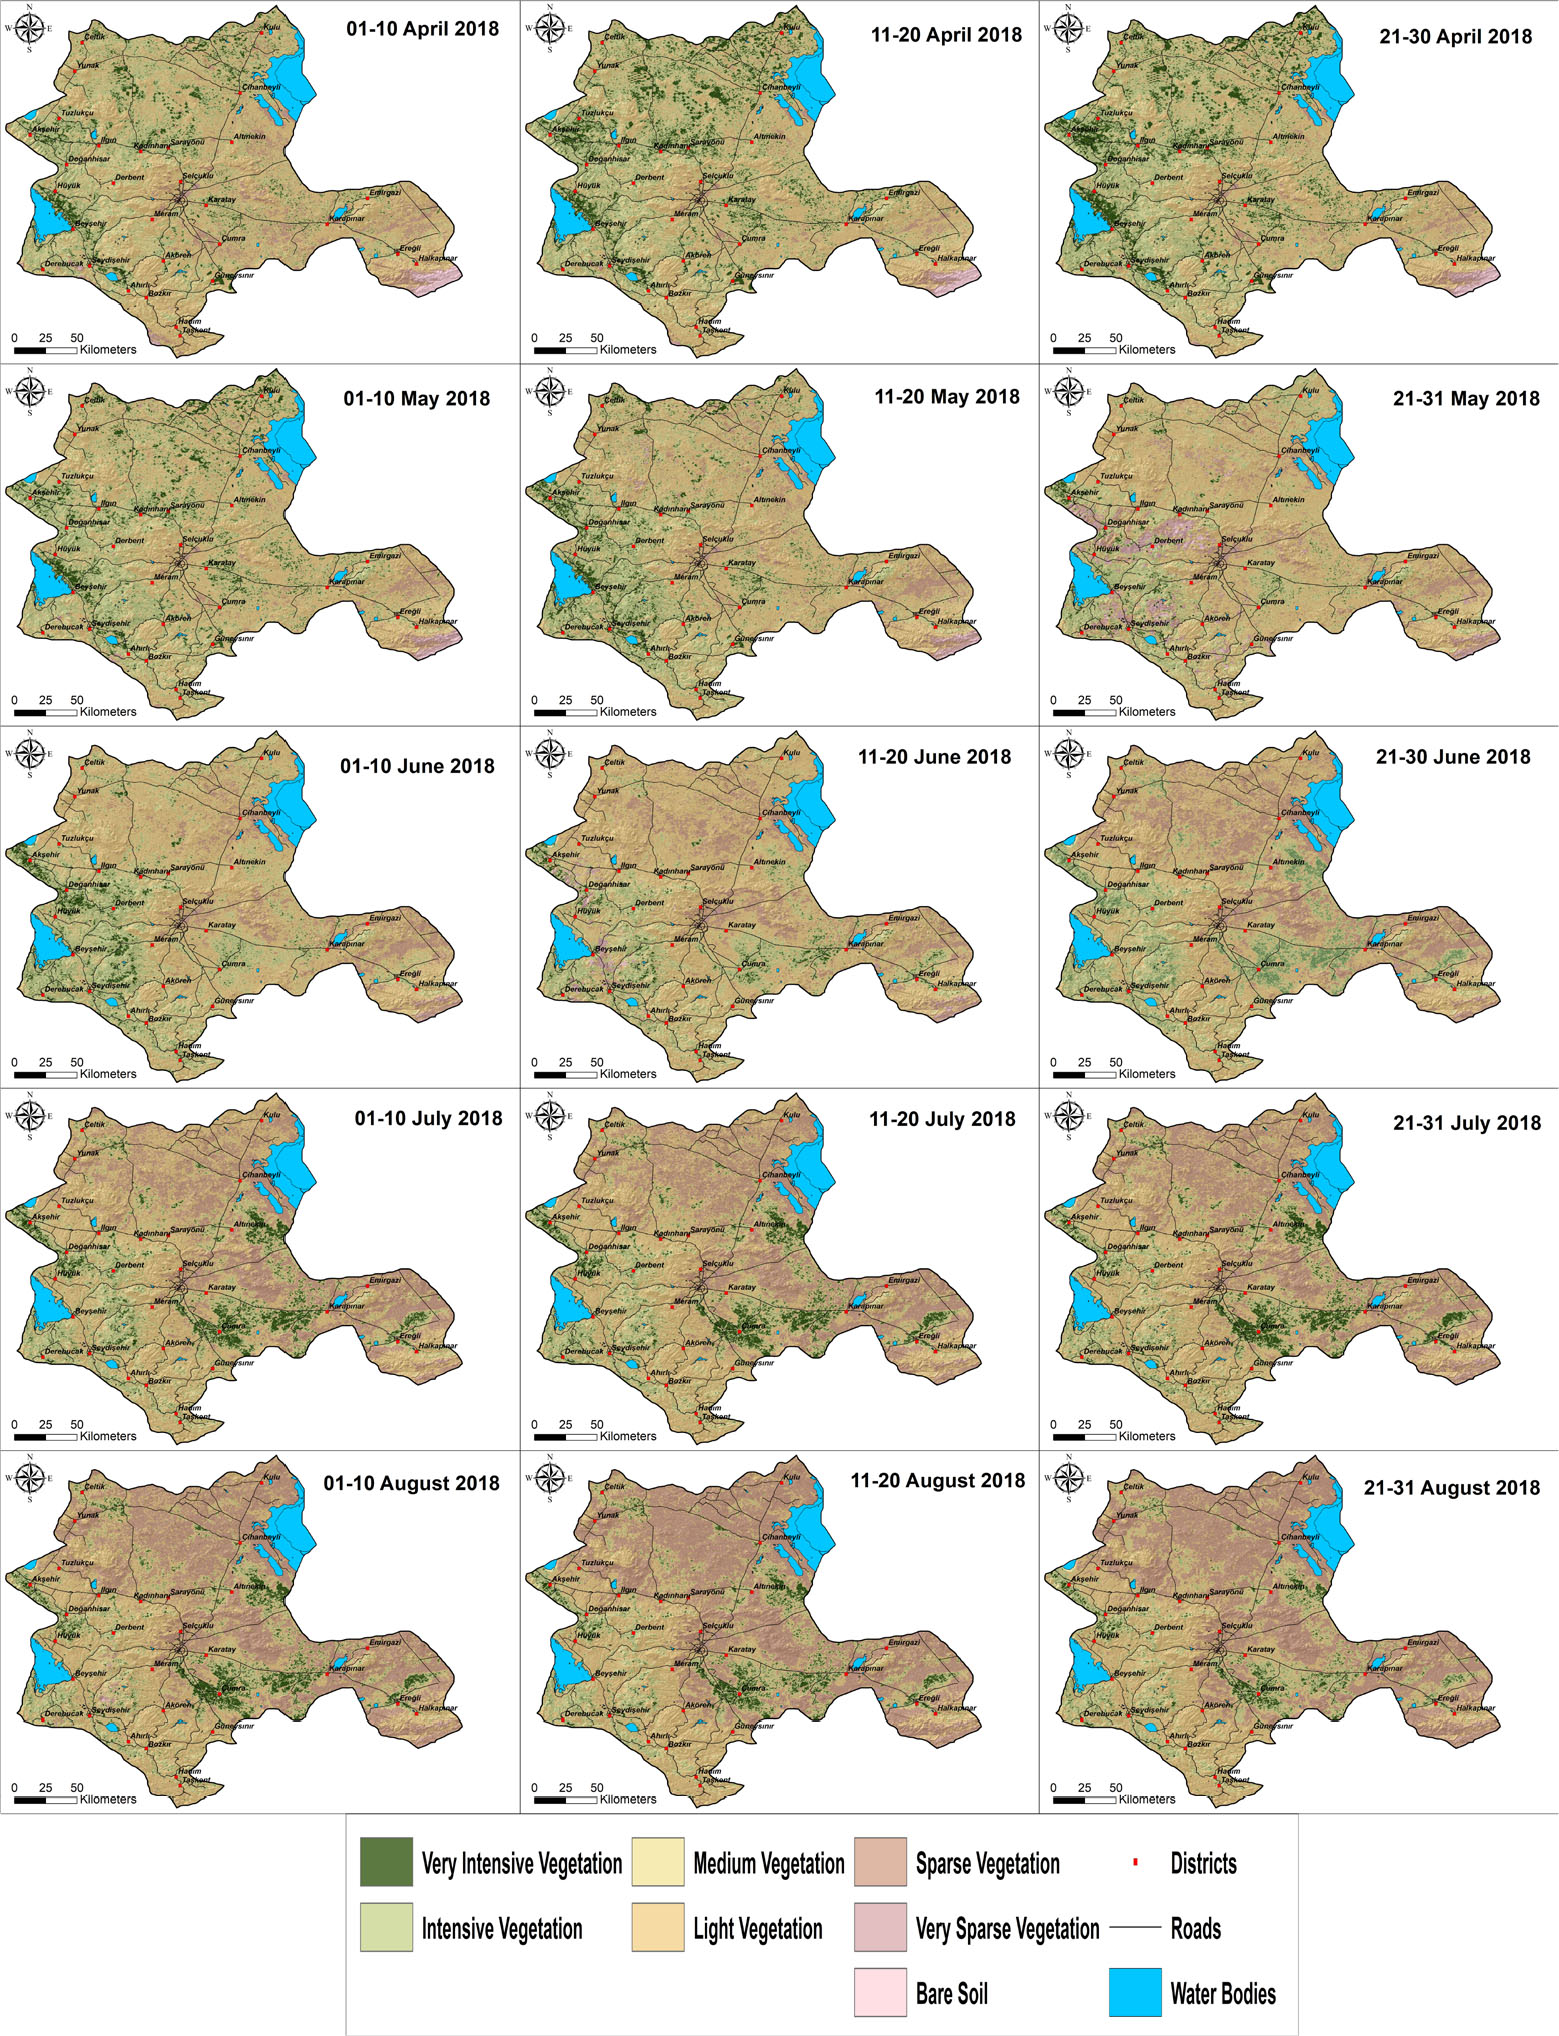
Fig. 3
NDVI images from 1st April to 31st August.
Table 2
Beekeeping suitability pairwise matrix
| Criteria | AS | EL | SL | FL | DtW | DtR | DtS | DtP | DtB | DtRI | PR | ND | Weight |
|---|---|---|---|---|---|---|---|---|---|---|---|---|---|
| AS | 1 | 2 | 2,7 | 0,3 | 1,1 | 4 | 4 | 2,5 | 2,5 | 4 | 3 | 3 | 0,129 |
| EL | 1 | 1,1 | 0,2 | 0,5 | 2 | 2 | 1,1 | 1,1 | 2 | 1,5 | 1,5 | 0,063 | |
| SL | 1 | 0,2 | 0,3 | 1,2 | 1,2 | 1 | 1 | 1,2 | 1,1 | 1,2 | 0,048 | ||
| FL | 1 | 3,5 | 9 | 9 | 8 | 8 | 8 | 7 | 8 | 0,339 | |||
| DtW | 1 | 4 | 4,2 | 3 | 3 | 4,2 | 3 | 2,8 | 0,133 | ||||
| DtR | 1 | 1 | 0,8 | 0,8 | 1 | 0,9 | 0,8 | 0,036 | |||||
| DtS | 1 | 0,8 | 0,8 | 1 | 0,9 | 0,7 | 0,035 | ||||||
| DtP | 1 | 1 | 1,6 | 1,1 | 1,2 | 0,048 | |||||||
| DtB | 1 | 1,4 | 1,1 | 1,1 | 0,047 | ||||||||
| DtRI | 1 | 0,9 | 0,7 | 0,035 | |||||||||
| PR | 1 | 0,8 | 0,042 | ||||||||||
| ND | 1 | 0,045 | |||||||||||
| (CR=0,081) | Total | 1.0000 | |||||||||||
[i] (AS: Aspect, EL: Elevation, SL: Slope, FL: Flora, DtW: Distance to Waters, DtR: Distance to Roads, DtP: Distance to Powerlines, DtB: Distance to Buildings, DtRI: Distance to Railways, PR: Precipitation, ND: Natural Disasters)
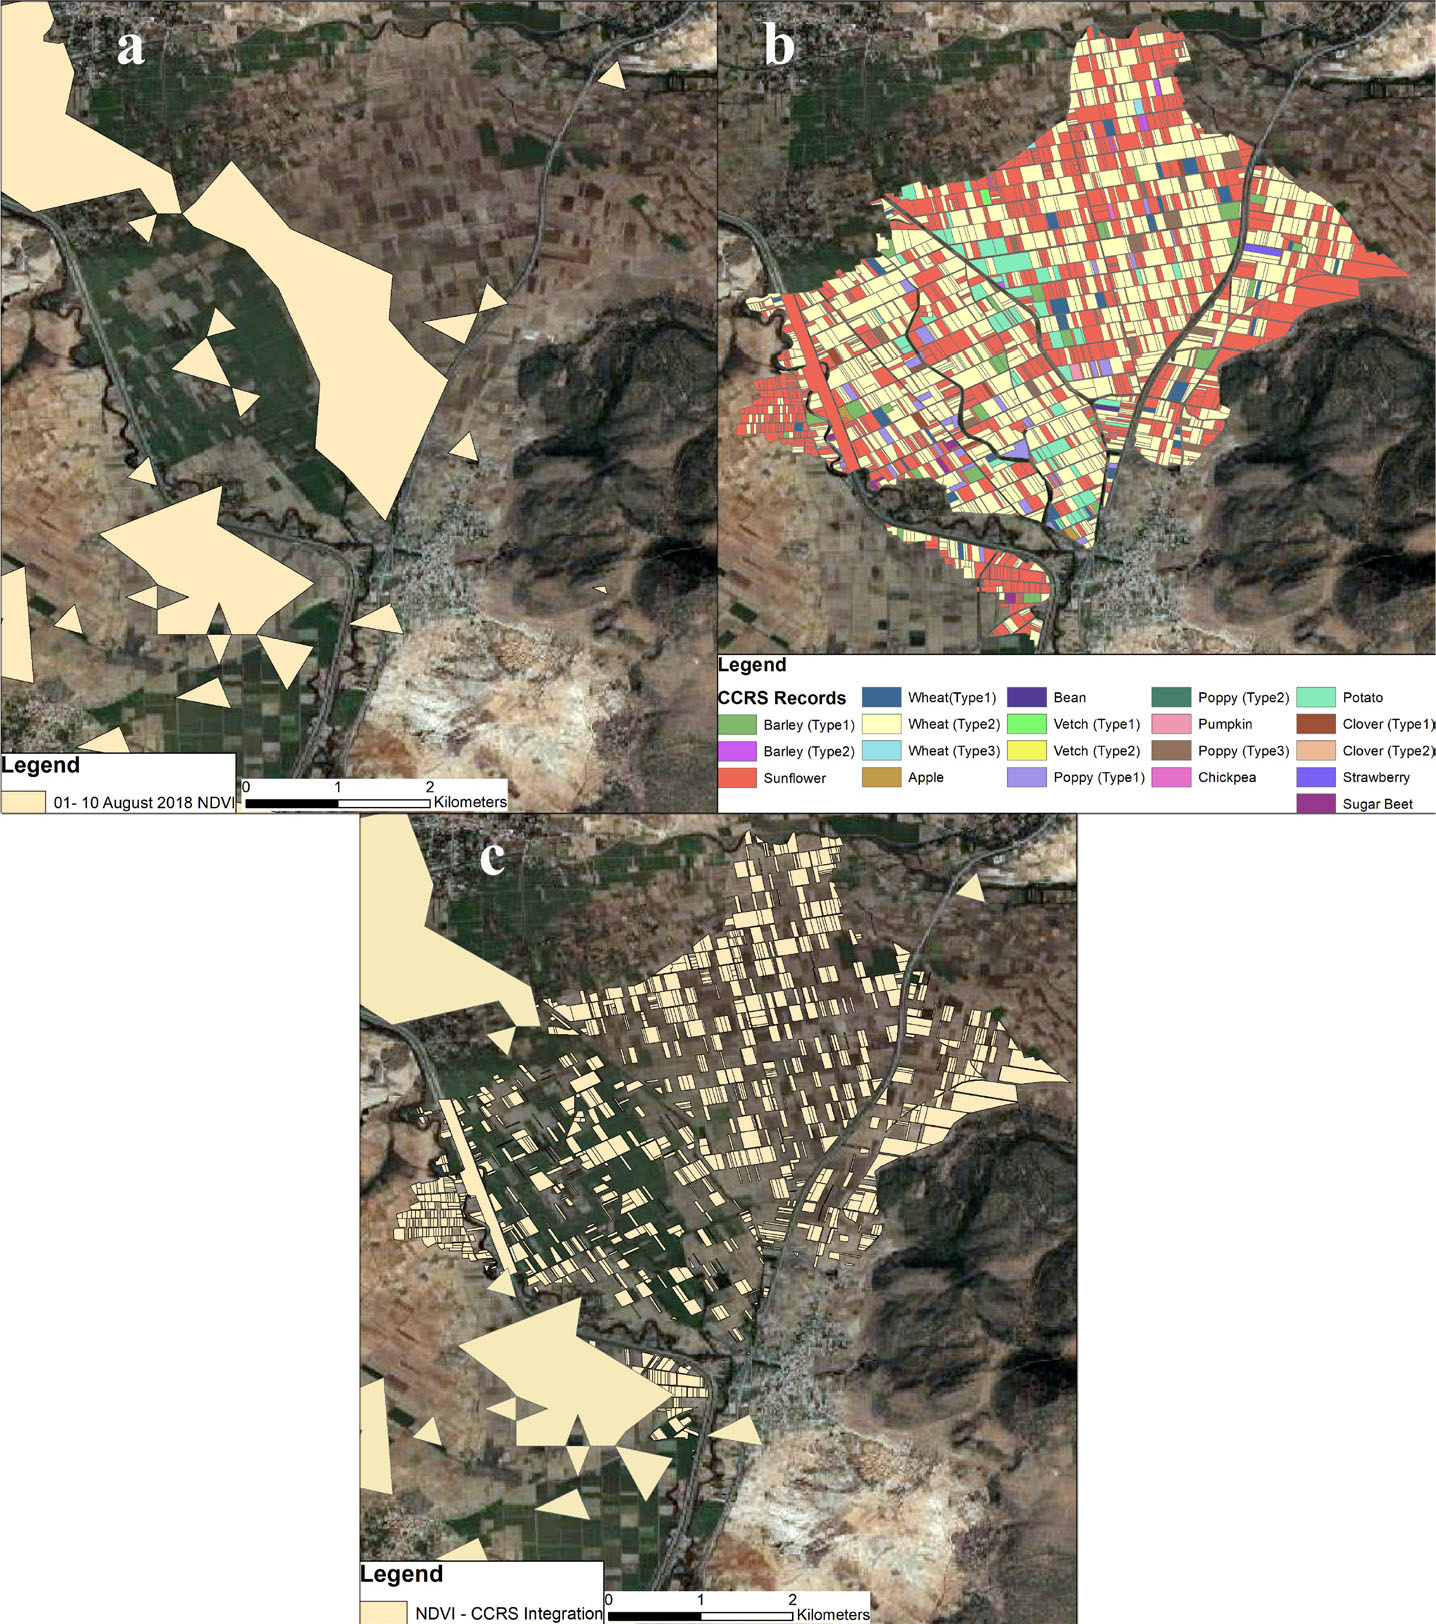
Fig. 4
a-) 01–10 August 2018 NDVI Imagery b-) CCRS crop type map c-) Integration of CCRS and NDVI data (Apiary Schedule).
Table 3
Field study results for a sample 5 of 176 apiaries
| Apiary Name | Latitude | Longitude | Hive Count | Location | Begin Date | End Date | Honey Type |
|---|---|---|---|---|---|---|---|
| A1 | 32,86913 | 38,338409 | 50 | Hüyük | 3 April | 10 May | Highland |
| A25 | 33,084416 | 38,181350 | 30 | Gevrekli | 5 April | 16 May | Highland |
| A52 | 33,058012 | 38,308402 | 100 | Karapınar | 11 July | 27 August | Sunflower |
| … | … | … | … | … | … | … | … |
| A102 | 32,88018 | 38,177285 | 15 | Altınekin | 9 July | 23 August | Sunflower |
| A148 | 32,677932 | 38,339811 | 35 | Bozkır | 8 May | 13 June | Highland |
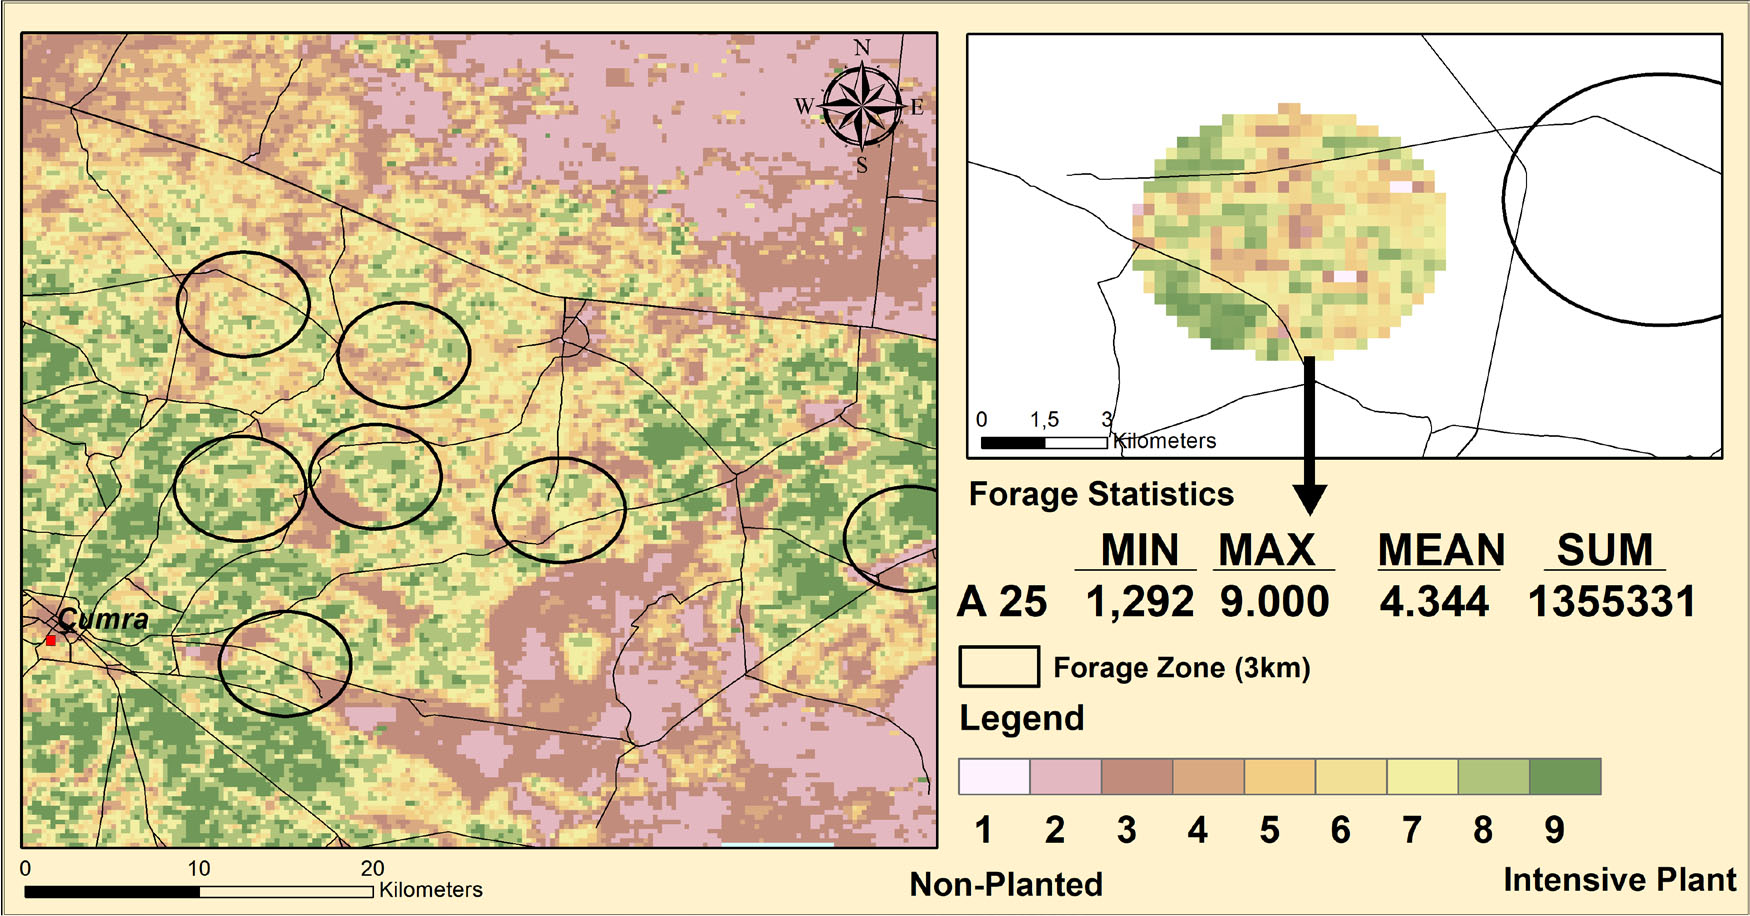
Fig. 5
Zonal statistics of forage zones.
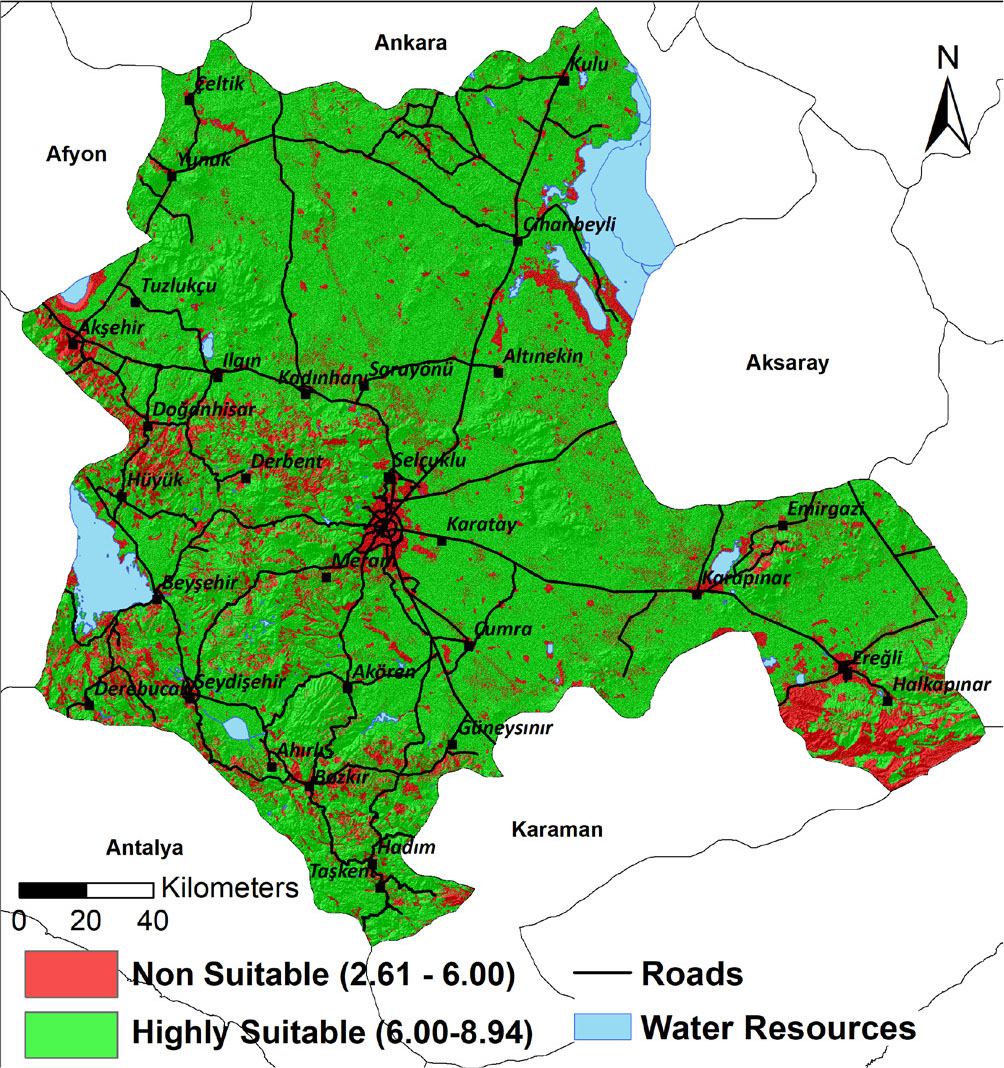
Fig. 6
Beekeeping suitability map.
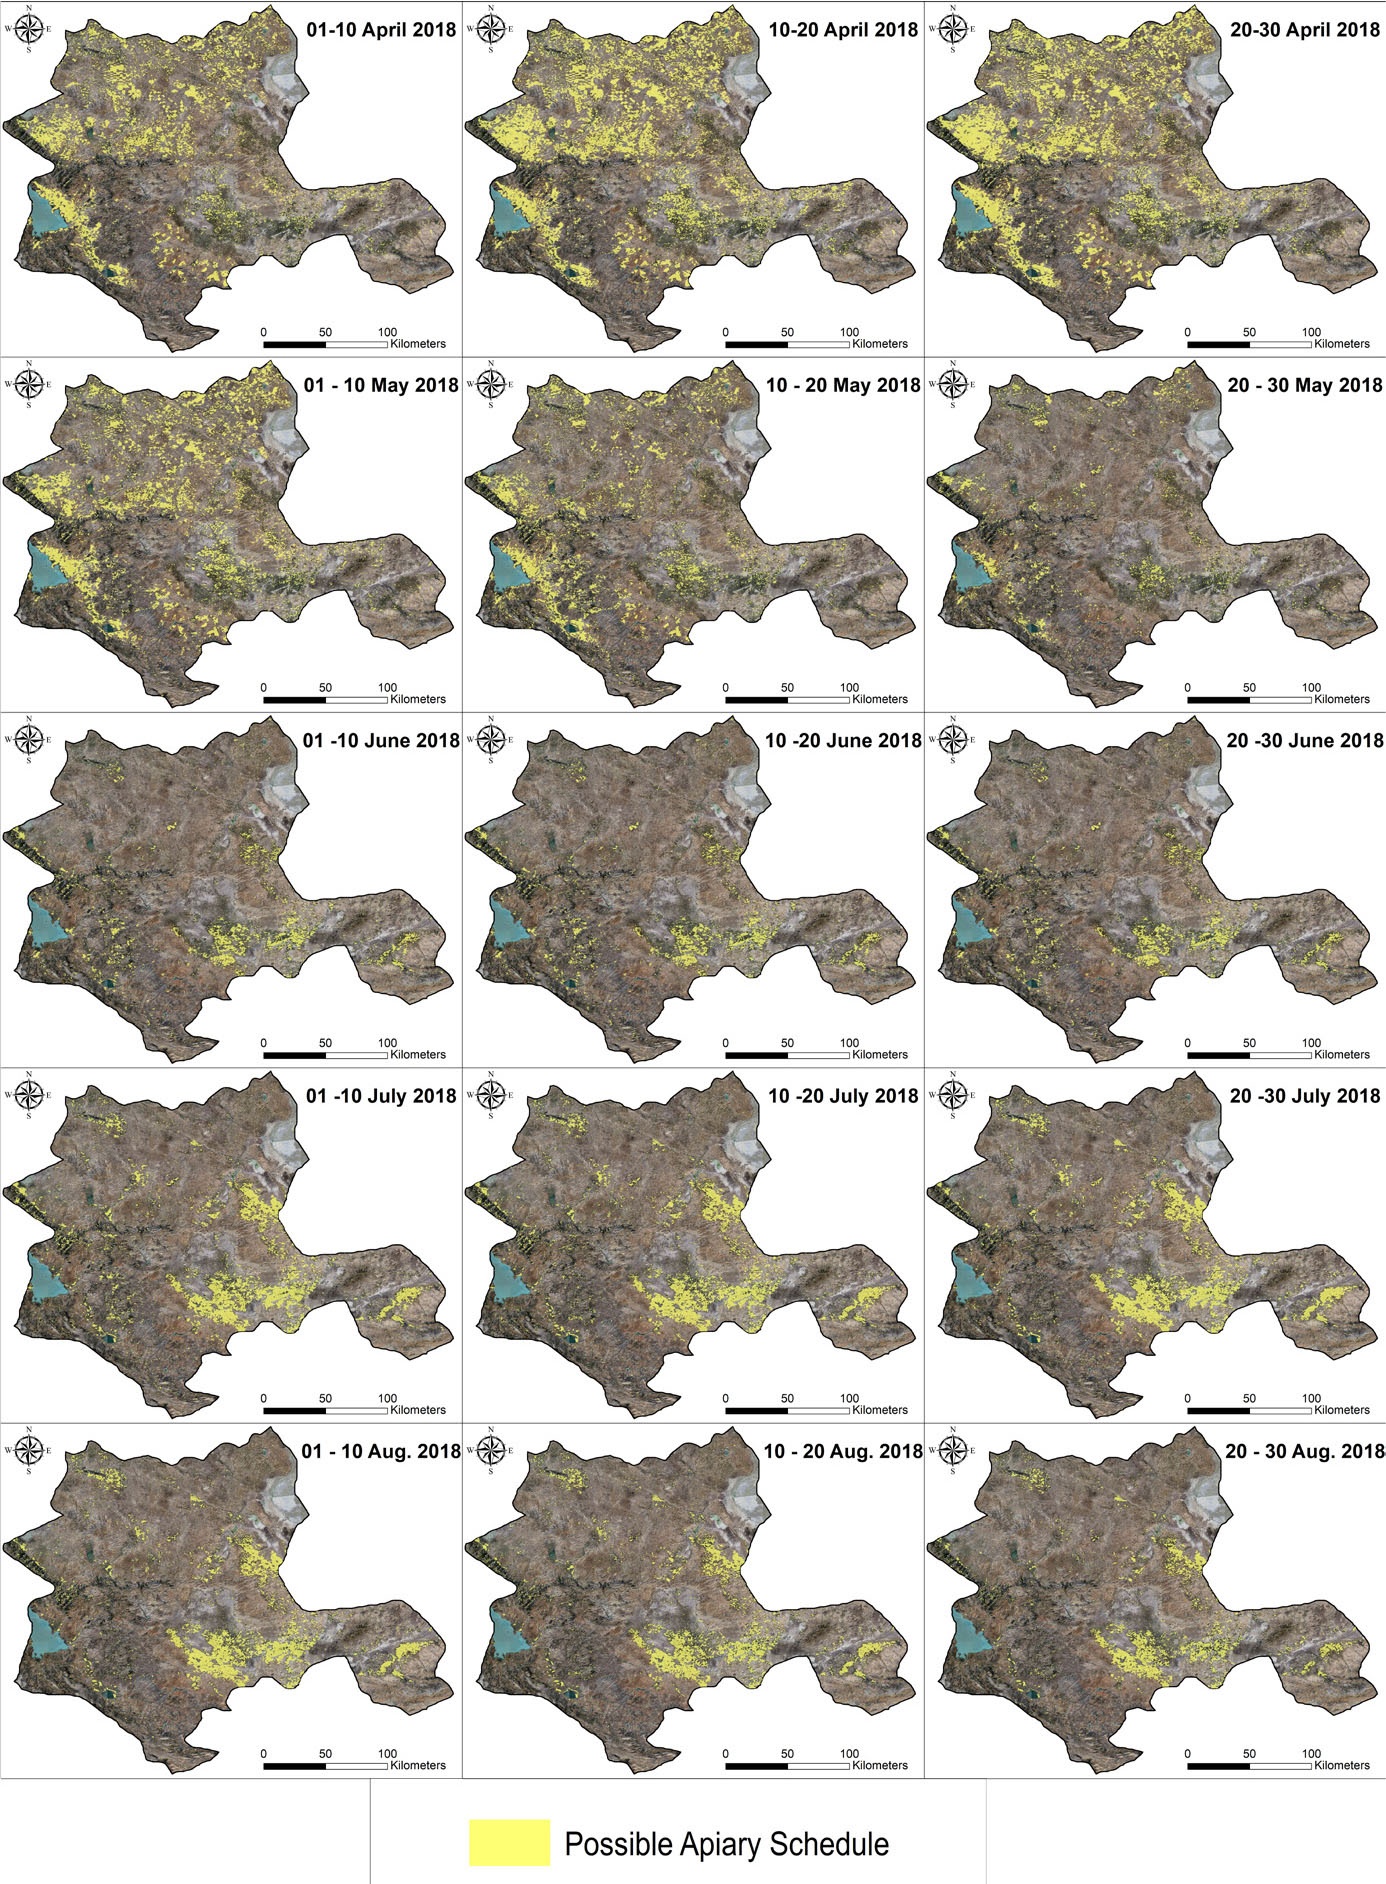
Fig. 7
Determined apiary schedules from 1st April to 31st August.
Table 4
Average season start and end dates retrieved from field studies
| Region | Average Start Date | Average End Date | Apiaries | |
|---|---|---|---|---|
| Early Season Apiaries | Beyşehir, Seydişehir, Bozkır | 6 April | 12 May | 45 |
| Late Season Apiaries | Hadim, Taşkent | 3 May | 27 May | 35 |
| Apiaries at Agricultural Lands | Çumra, Karapınar, Altınekin | 8 June | 24 August | 96 |
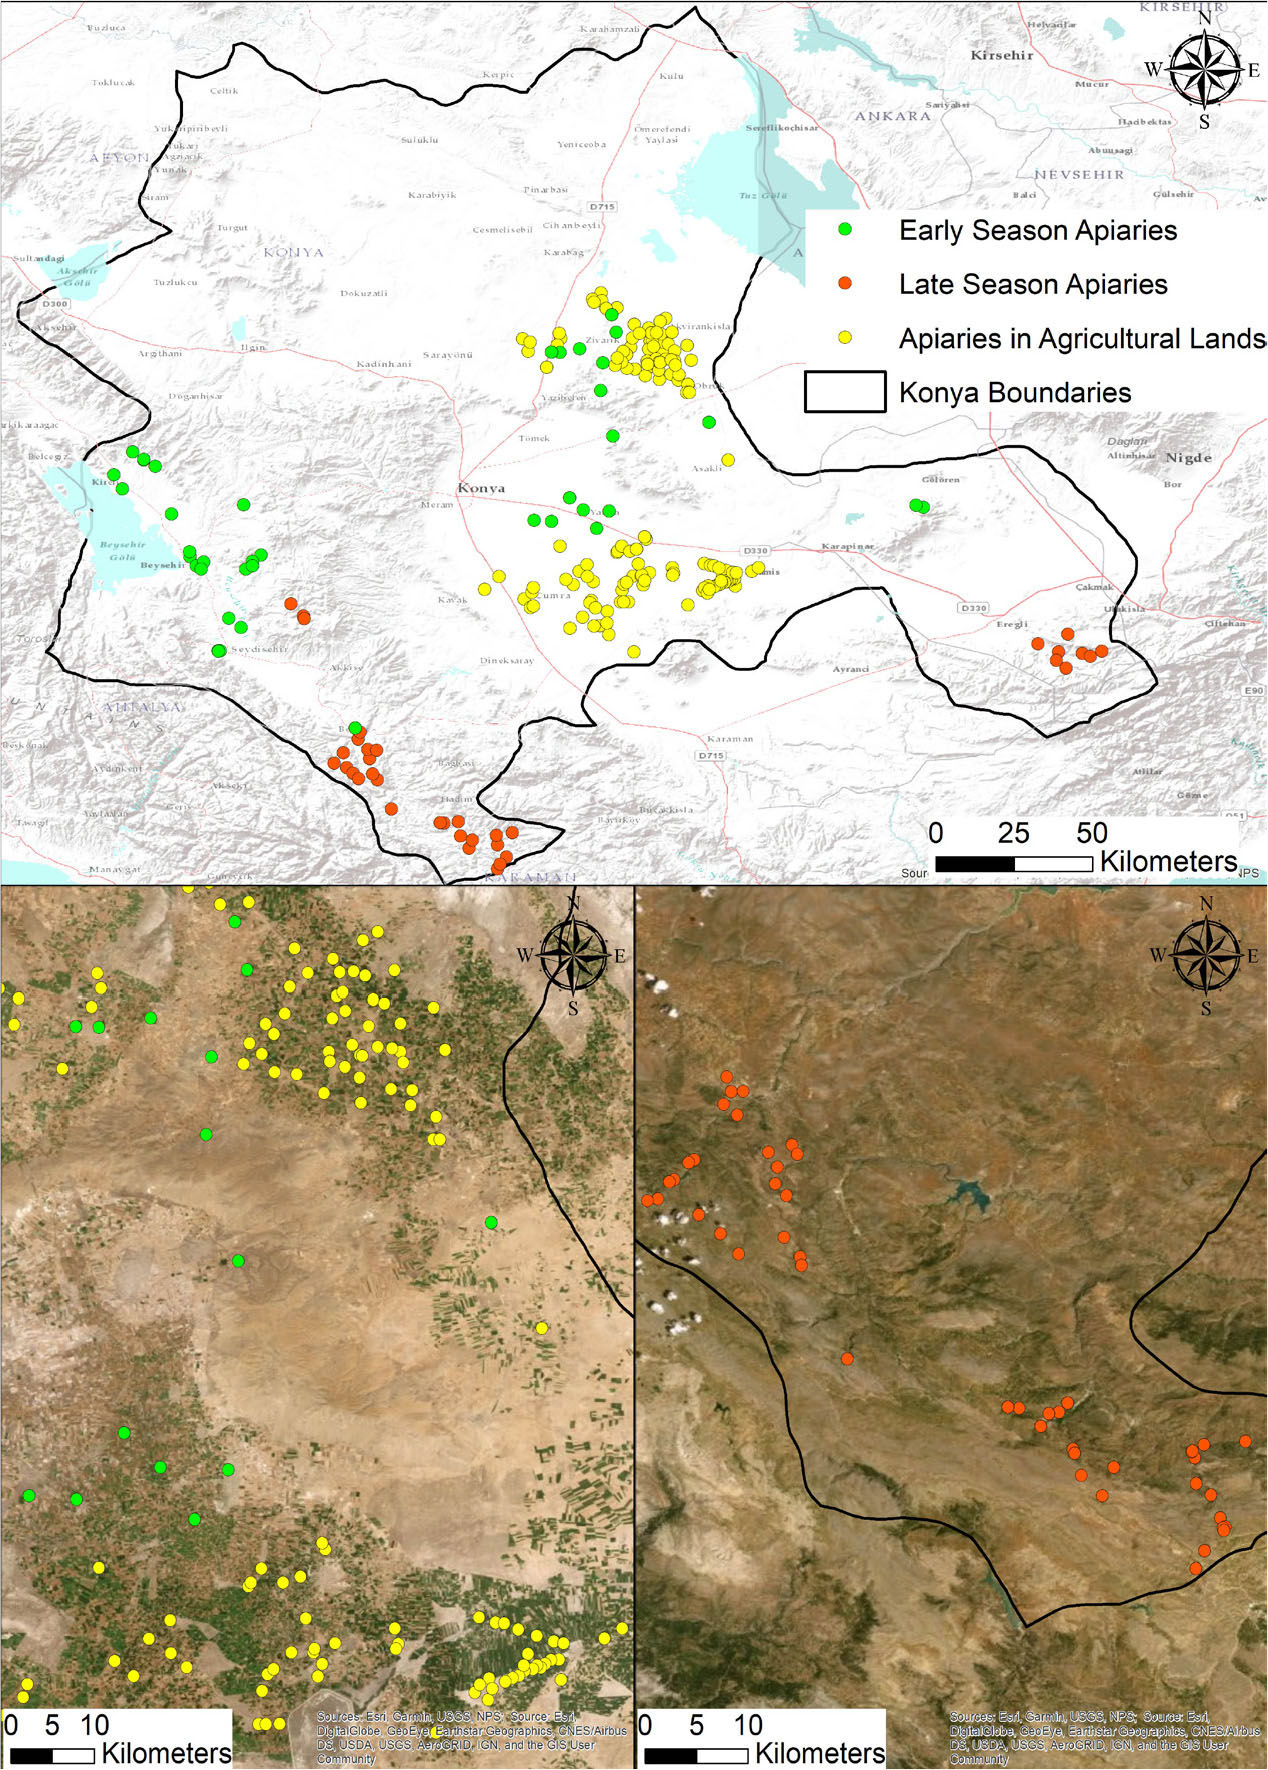
Fig. 8
Existing apiary locations and their clusters.
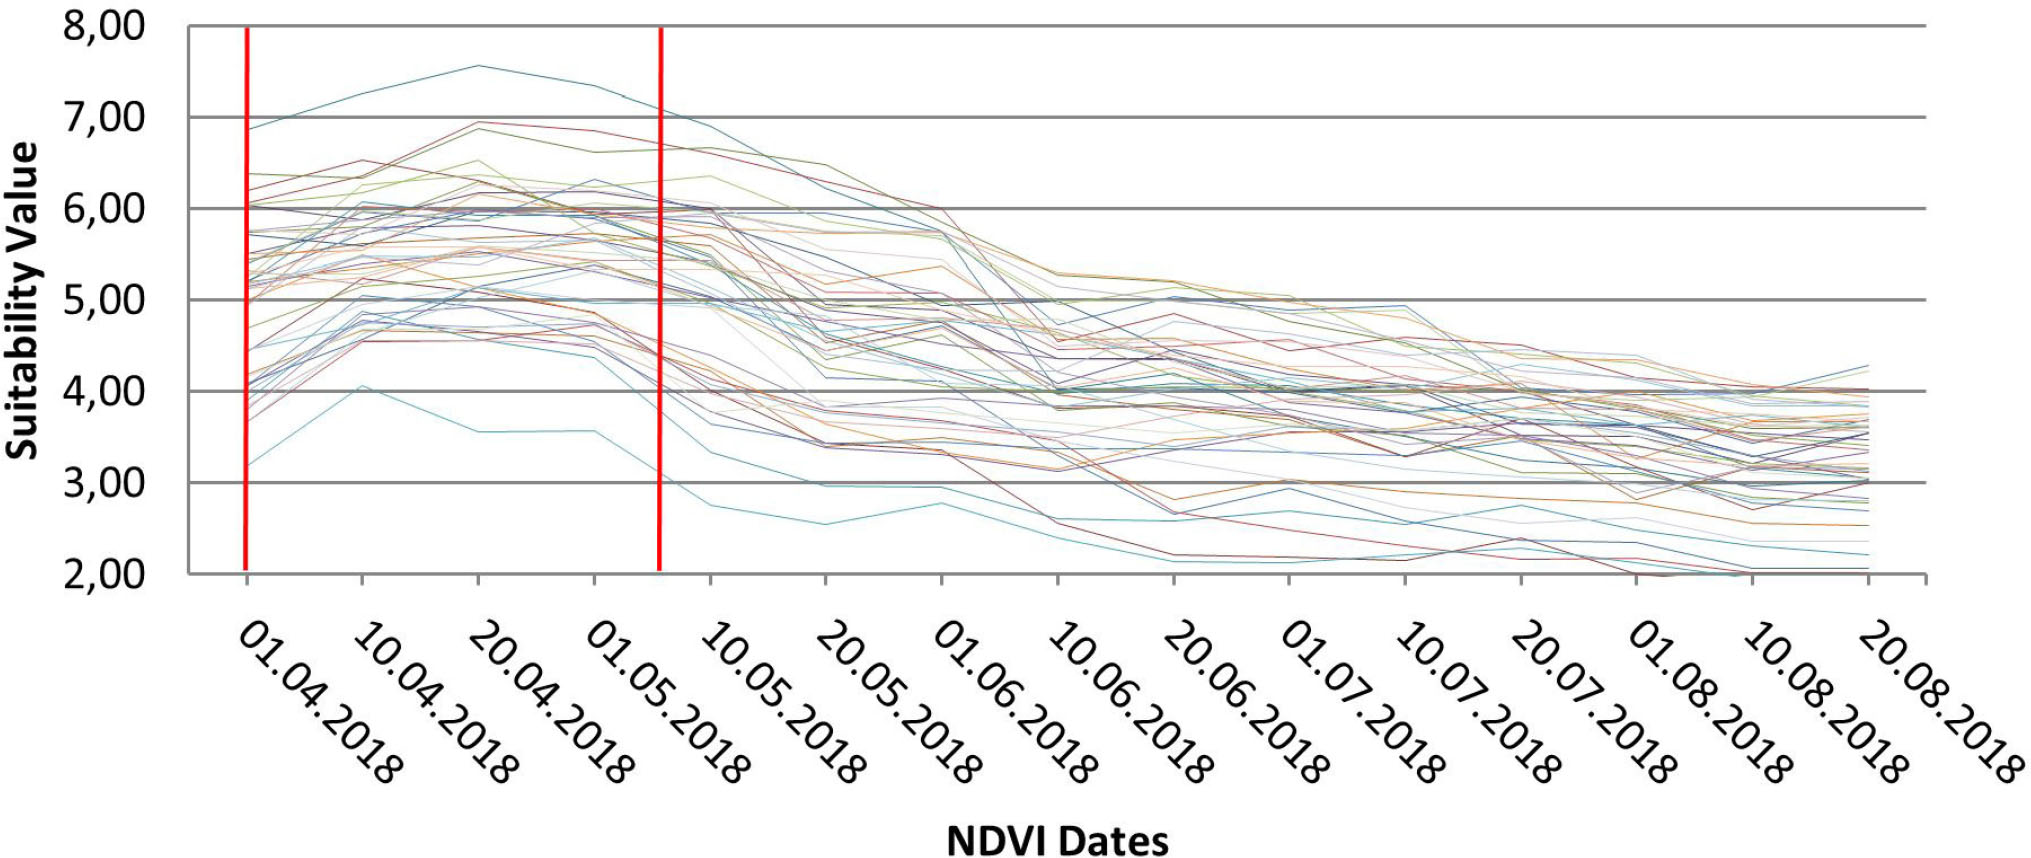
Fig. 9
NDVI graphics for early season apiaries.
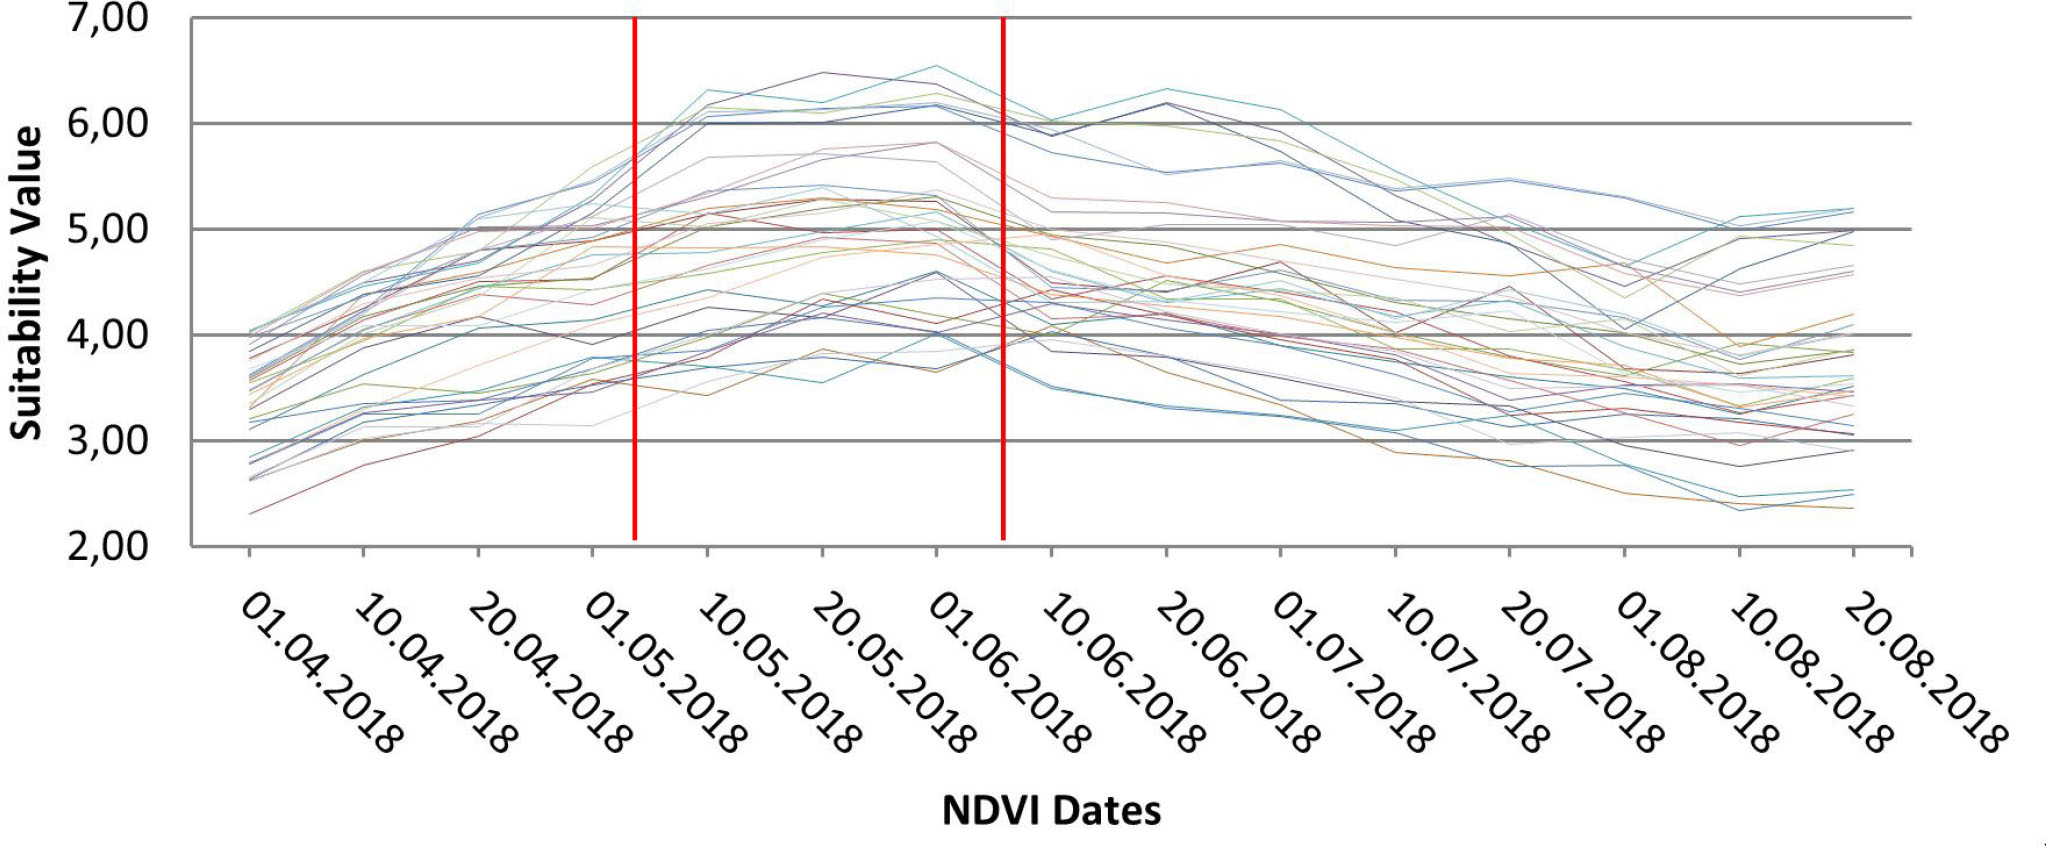
Fig. 10
NDVI graphics for late season apiaries.
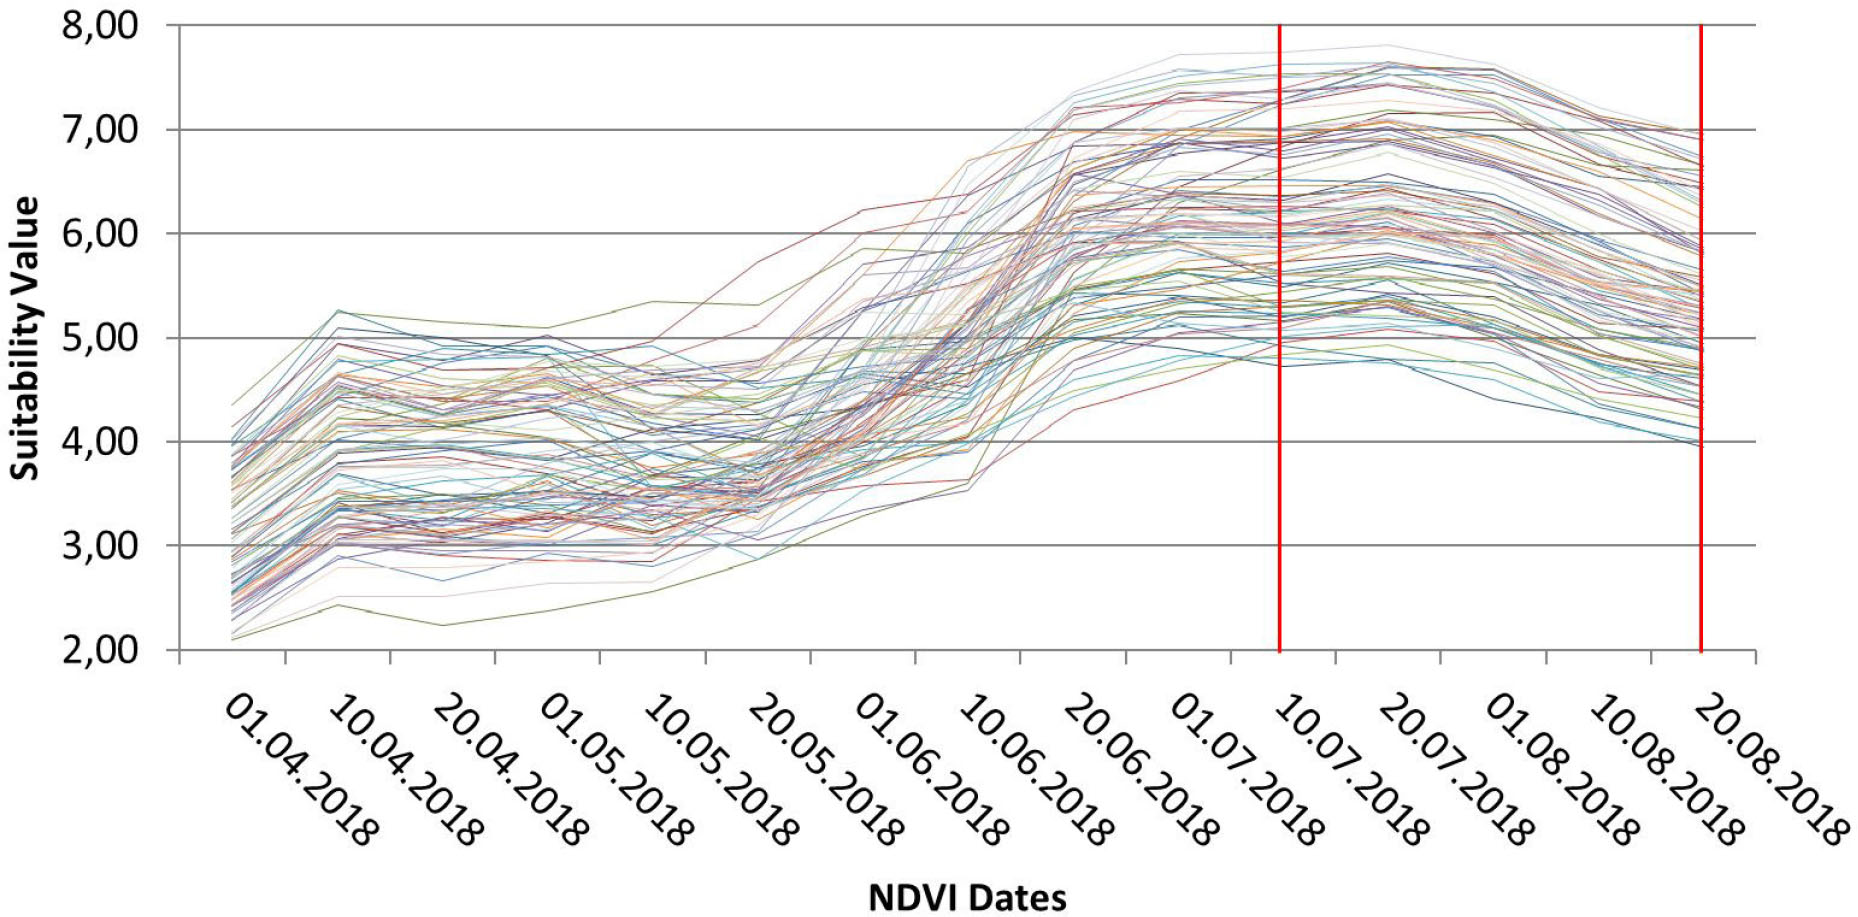
Fig. 11
NDVI graphics of apiaries in agricultural lands.
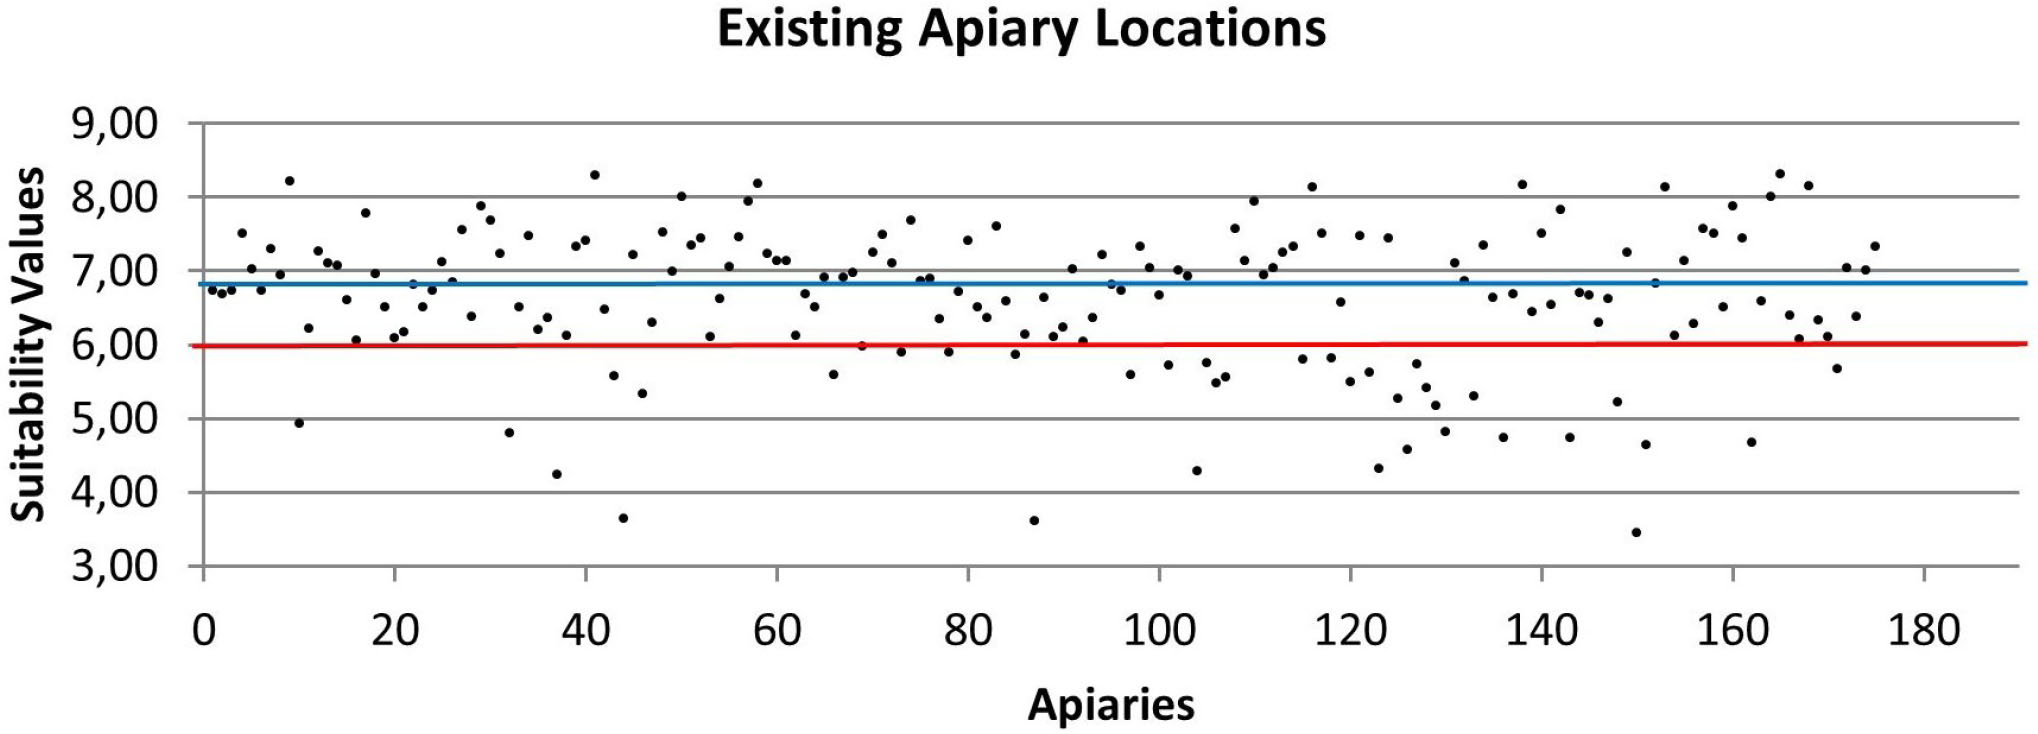
Fig. 12
Distribution of apiaries according to suitability values corresponding to their geographical locations, considering the value 6 as the suitability threshold (The blue line represents the average suitability value of 176 beekeeping locations).
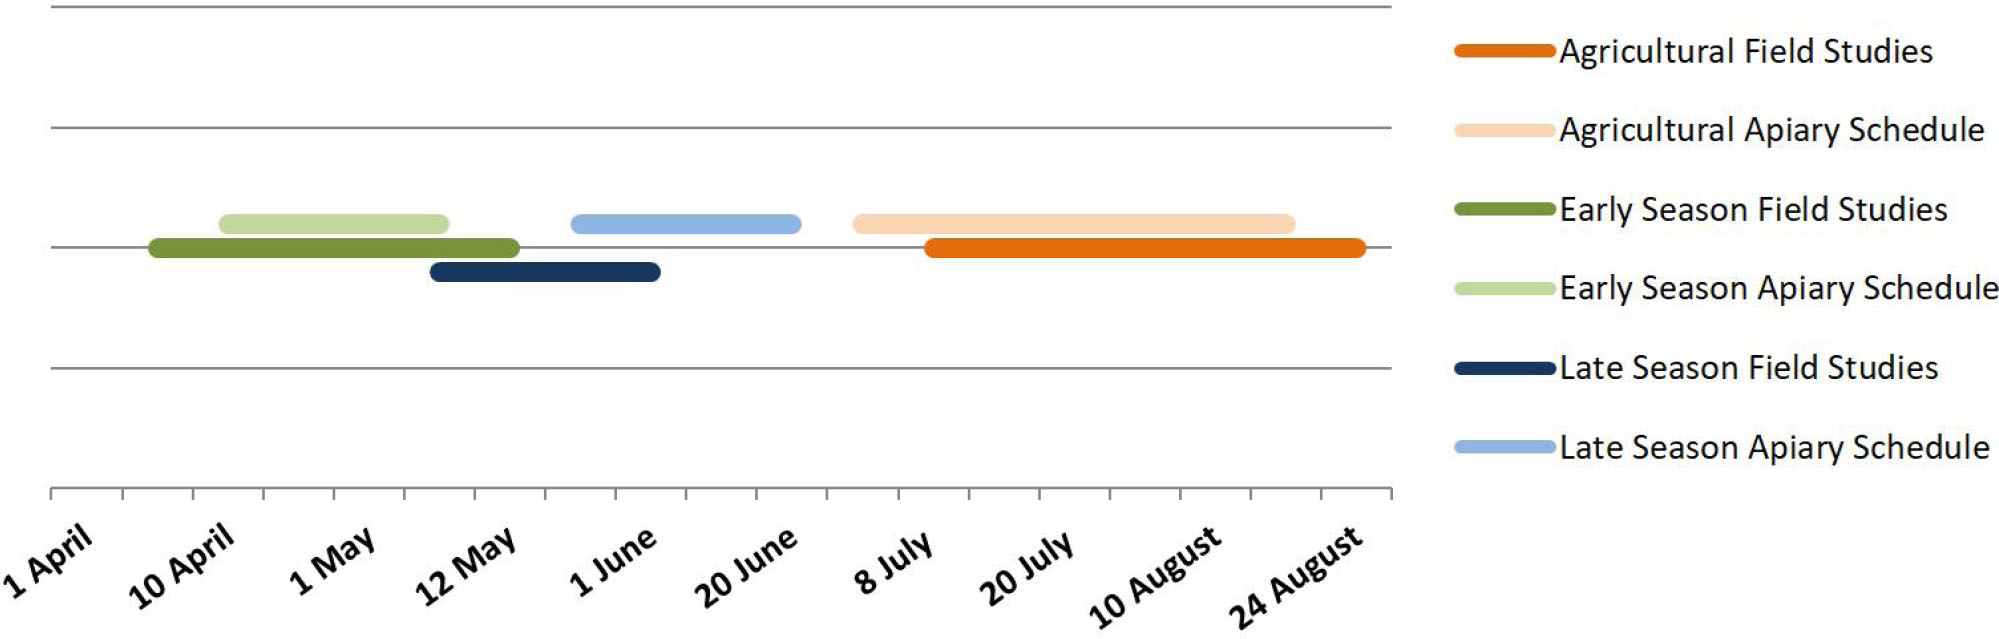
Fig. 13
Comparison of apiary schedule and field study dates.