
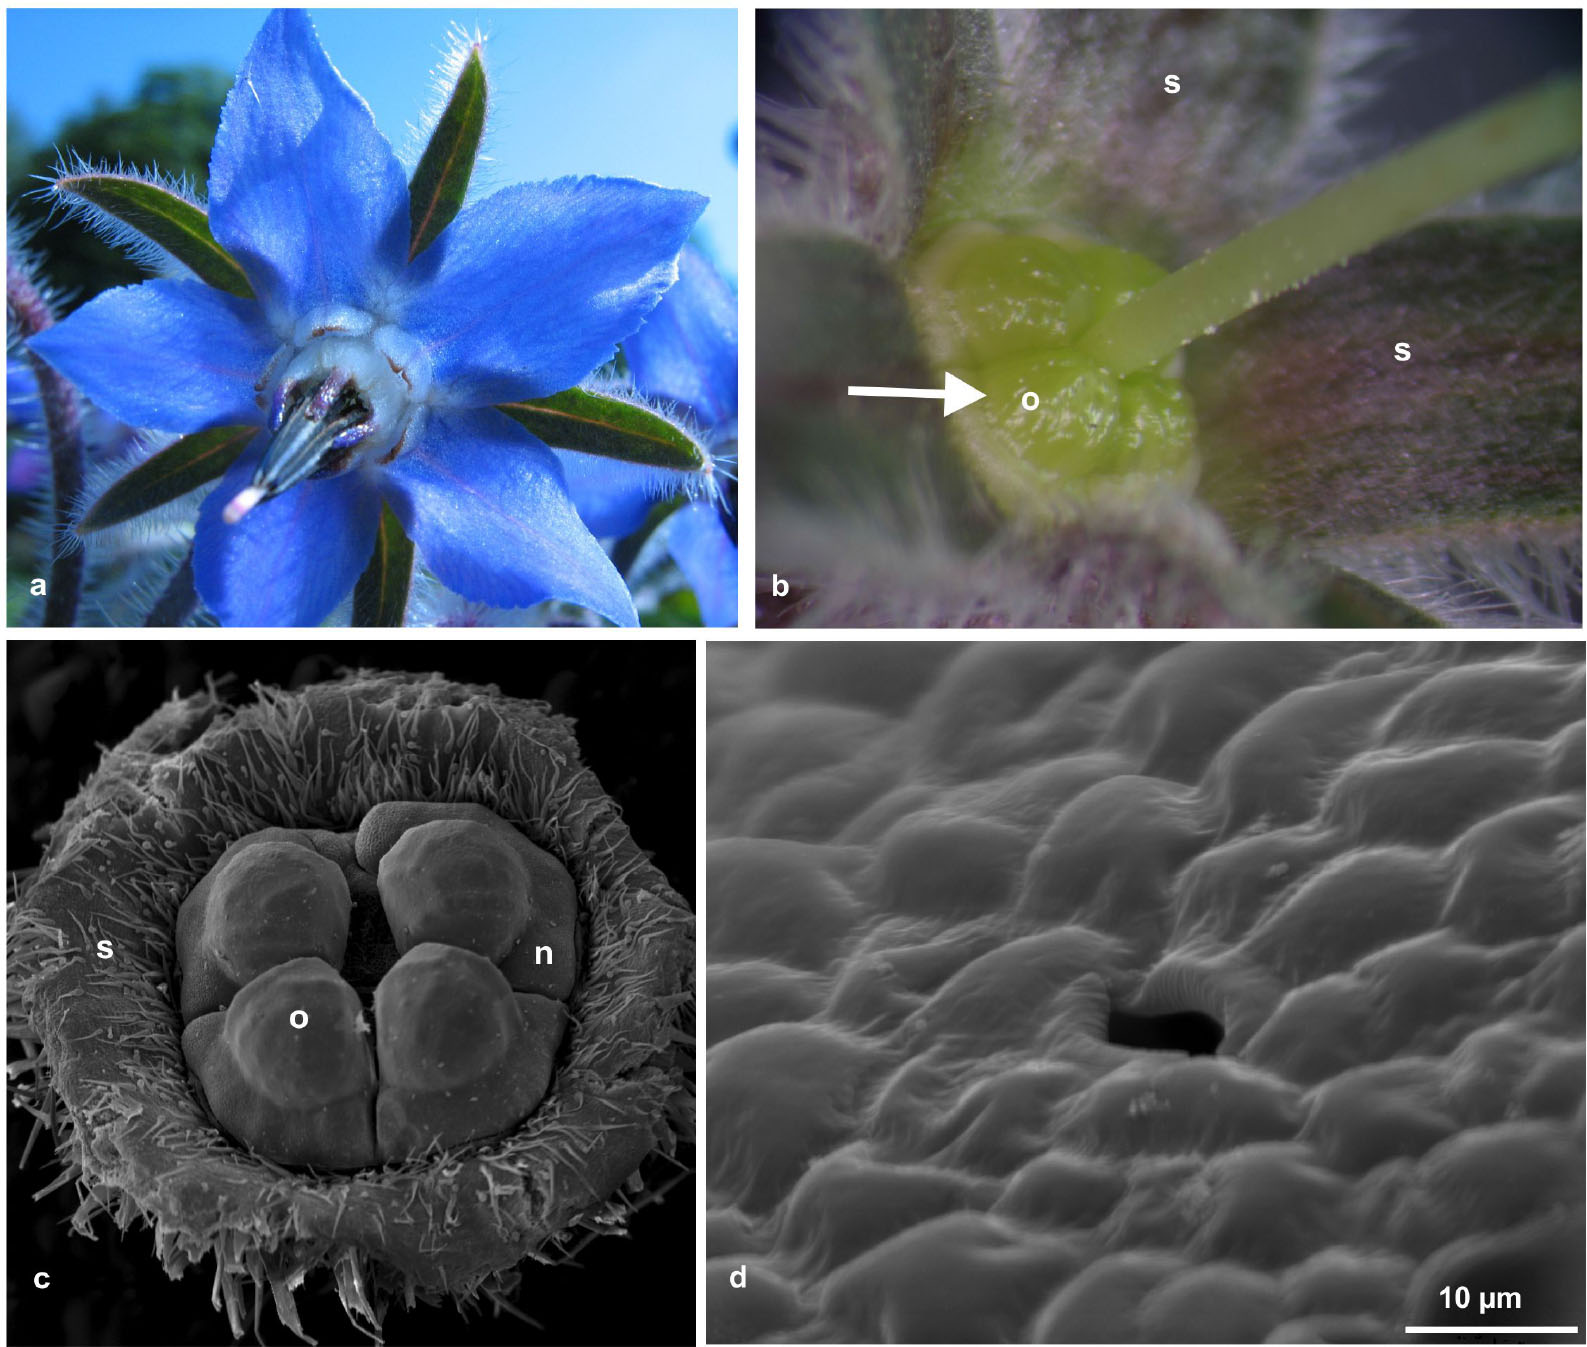
Fig. 1
Morphology and microstructure of a Borago officinalis flower. a. Front view of a flower. b. Fourloculed ovary with a nectary ring below (arrow). c. Four-lobed nectary ring (SEM). d. Nectary epidermis with a nectarostoma (SEM). Abbreviations: s - sepal, o - ovary, n - nectary lobe.
Table 1
Flowering phenology and abundance of Borago officinalis L. in the years of study.
| Year | Flowering time (days) | Life span of a flower (hours) | Number of flowers | |
|---|---|---|---|---|
| plant−1 | m−2 of plot | |||
| 2007 | 20.06–07.08 | 21.3 ± 1.15 | 1024 ± 628 | 4866 ± 2981 |
| (49) | n = 6 | n = 6 | n = 6 | |
| 2008 | 17.06–14.08 | 20.6 ± 1.53 | 999 ± 365 | 4744 ± 1731 |
| (59) | n = 6 | n = 10 | n = 10 | |
| 2009 | 22.06–20.08 | 21.7 ± 2.08 | 863 ± 332 | 4100 ± 1578 |
| (60) | n = 6 | n = 10 | n = 10 | |
| mean | (56) | 21.2 ± 1.00 | 953 ± 414 | 4570 ± 1968 |
| n = 18 | n = 26 | n = 26 | ||
[i] Mean values (± SD) are given, SD - standard deviation. The results for life span of the flower, number of flowers · plant−1 and number of flowers · m−2 of plot do not significantly differ between years of study (p > 0.05).
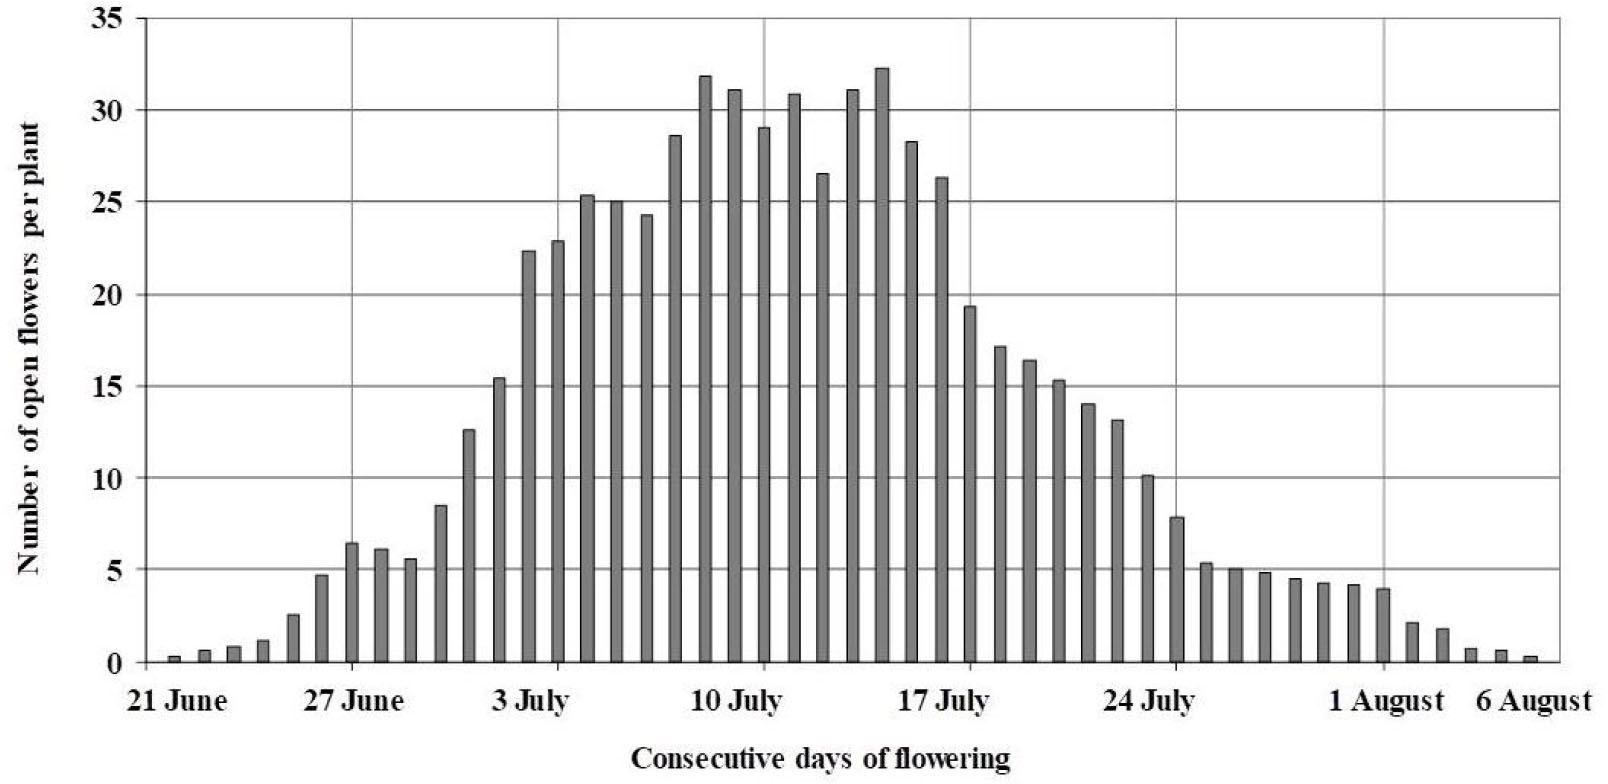
Fig. 2
Seasonal flowering pattern of Borago officinalis plants in 2007. The bars represent mean values (n = 6).
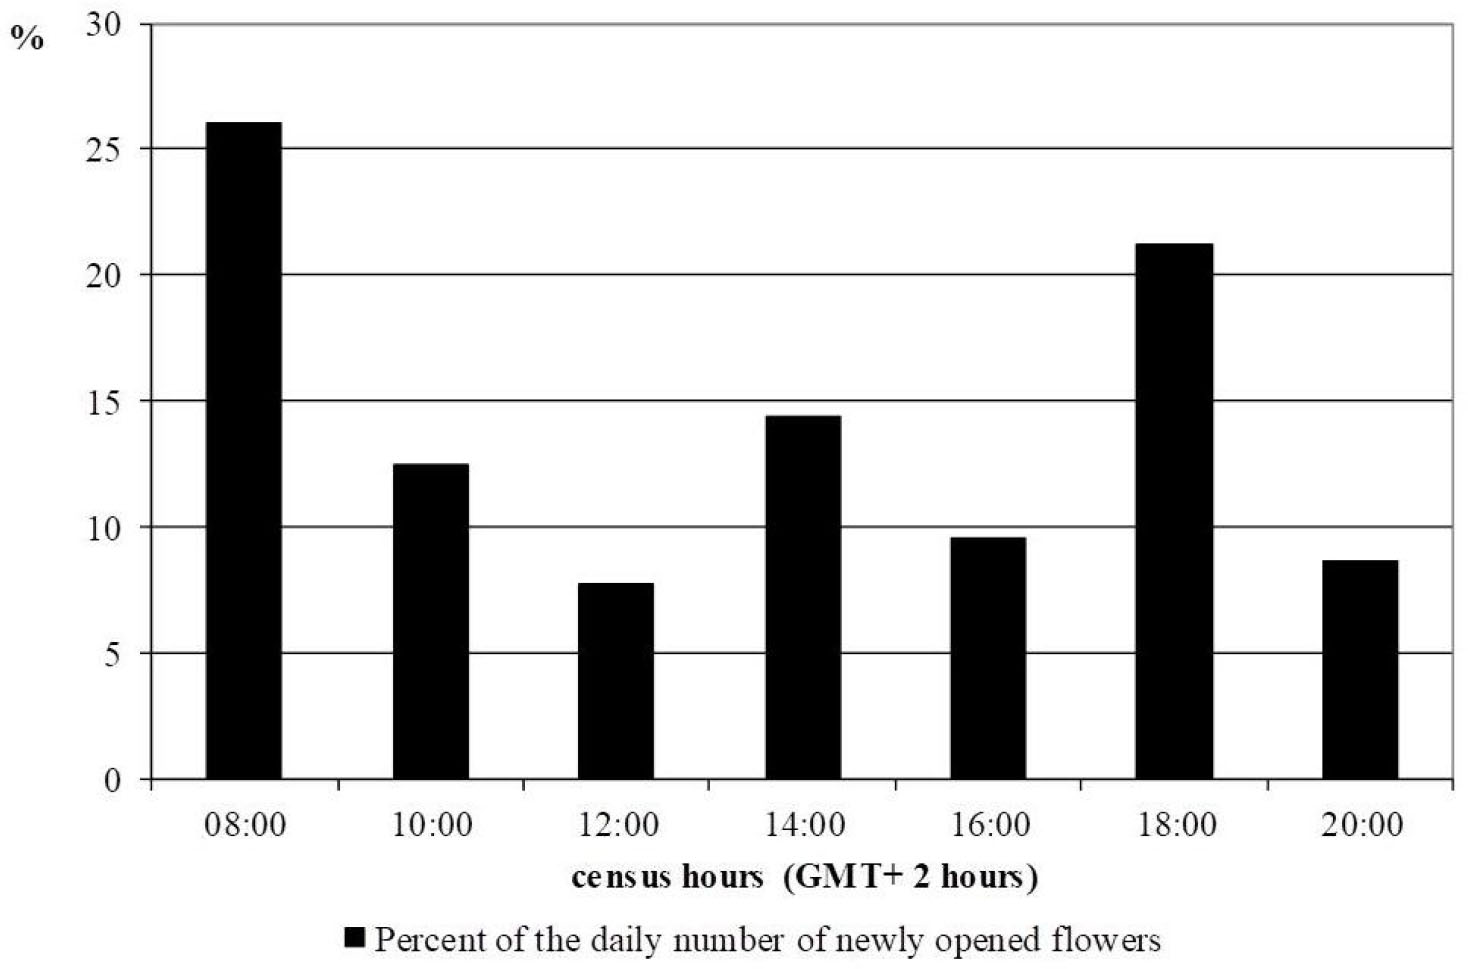
Fig. 3
Daily pattern of opening Borago officinalis flowers per stems (n = 8) recorded on the 16th and 17th June 2007. The bars represent mean values.
Table 2
Nectar production parameters in Borago officinalis L. in the growing seasons 2007–2009.
| Year | Amount · flower−1 of: | Sugar concentration of nectar (% wt/wt) | Amount of sugars secreted in nectar: | ||
|---|---|---|---|---|---|
| nectar (mg) | sugars secreted in nectar (mg) | plant−1 (g) | m−2 of crop (g) | ||
| 2007 | 4.3 ± 2.4 | 0.9 ± 0.2 | 26.7 ± 10.9 | 1.0 ± 0.6 | 4.5 ± 1.2 |
| n = 20 | n = 20 | n = 20 | n = 6 | n = 20 | |
| 2008 | 4.0 ± 2.2 | 1.3 ± 0.6 | 36.3 ± 18.8 | 1.3 ± 0.5 | 6.3 ± 3.0 |
| n = 14 | n = 14 | n = 14 | n = 10 | n = 14 | |
| 2009 | 3.8 ± 2.2 | 1.3 ± 0.6 | 33.8 ± 4.9 | 1.1 ± 0.4 | 5.1 ± 2.5 |
| n = 19 | n = 19 | n = 19 | n = 10 | n = 19 | |
| mean | 4.0 ± 2.2 | 1.2 ± 0.5 | 31.5 ± 13.1 | 1.1 ± 0.5 | 5.2 ± 2.3 |
| n = 53 | n = 53 | n = 53 | n = 26 | n = 53 | |
[i] Mean values (± SD) are given, SD - standard deviation. The results for all nectar parameters do not significantly differ among the years of the study (p > 0.05).
Table 3
Pollen production in Borago officinalis during growing seasons 2007–2009. Mean values (± SD) are given, SD - standard deviation.
| Year | Pollen amount: | ||
|---|---|---|---|
| flower−1 (mg) | plant−1 (g) | m−2 of crop (g) | |
| 2007 | 1.3a ± 0.5 | 1.4a ± 0.8 | 6.4a ± 2.6 |
| n = 12 | n = 6 | n = 12 | |
| 2008 | 1.1b ± 0.2 | 1.1a ± 0.4 | 5.1a ± 1.2 |
| n = 12 | n = 10 | n = 12 | |
| 2009 | 1.0b ± 0.4 | 0.9a ± 0.3 | 4.2b ± 1.5 |
| n = 12 | n = 20 | n = 12 | |
| mean | 1.1 ± 0.4 | 1.1 ± 0.5 | 5.2 ± 2.0 |
| n = 36 | n = 26 | n = 36 | |
[i] Means in columns with the same letters do not differ significantly; the HSD Tukey test, p = 0.05
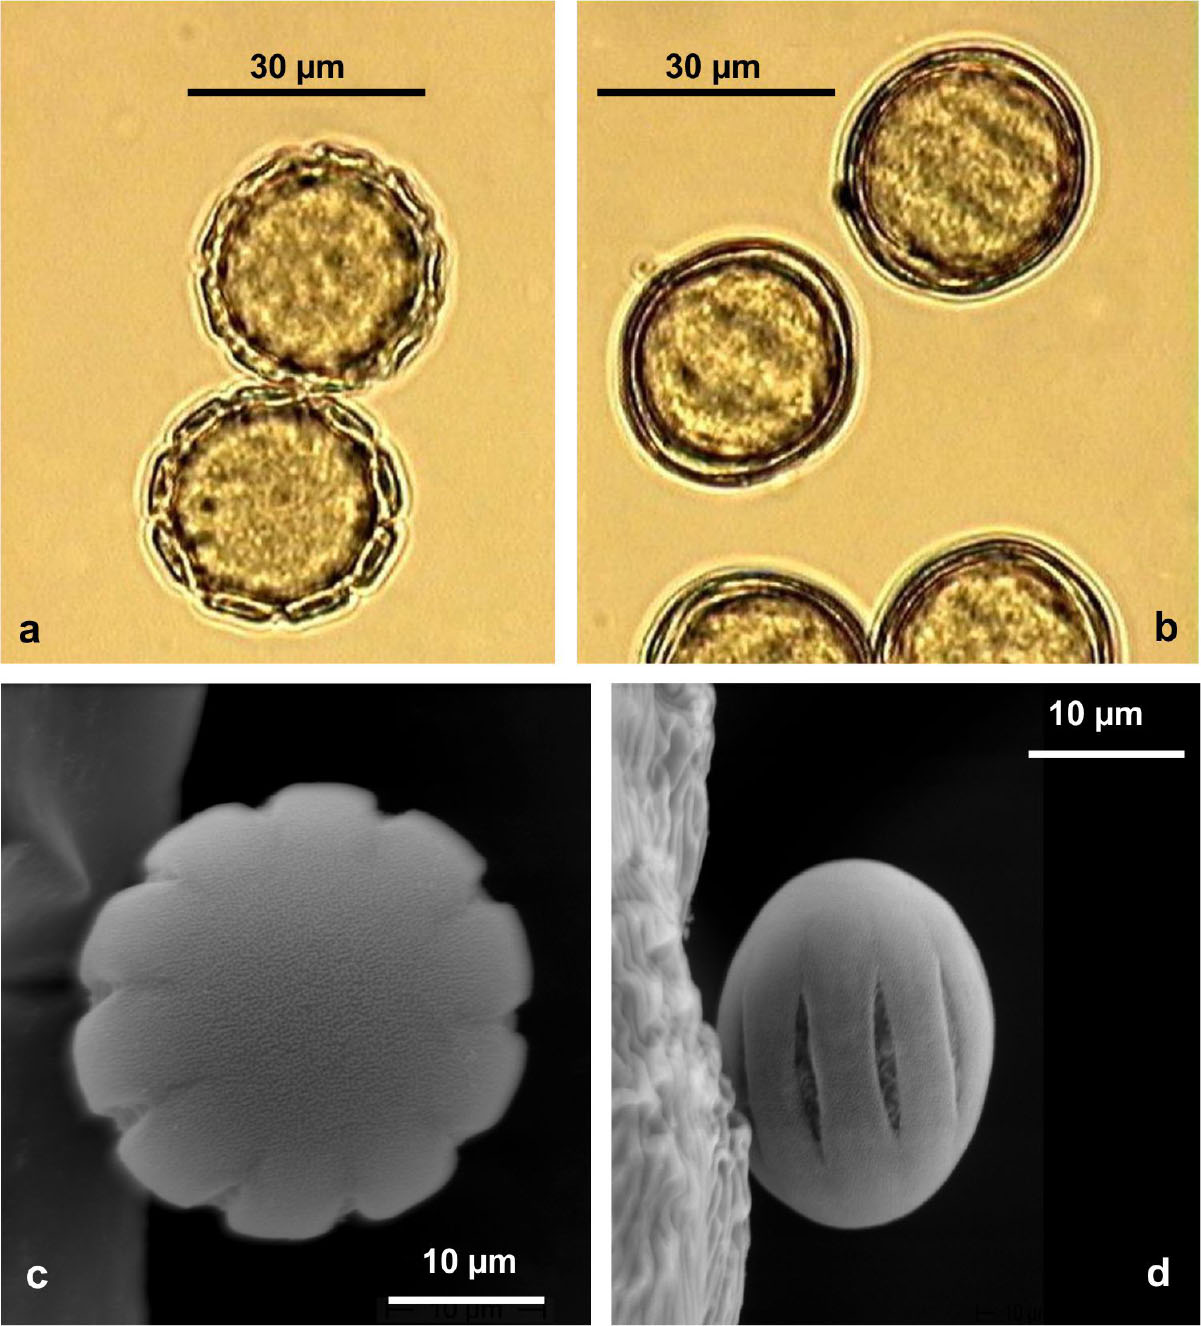
Fig. 4
Micrographs of Borago officinalis pollen grains. a. Polar view, LM. b. Equatorial view, LM. c. Polar view, SEM. d. Equatorial view, SEM.
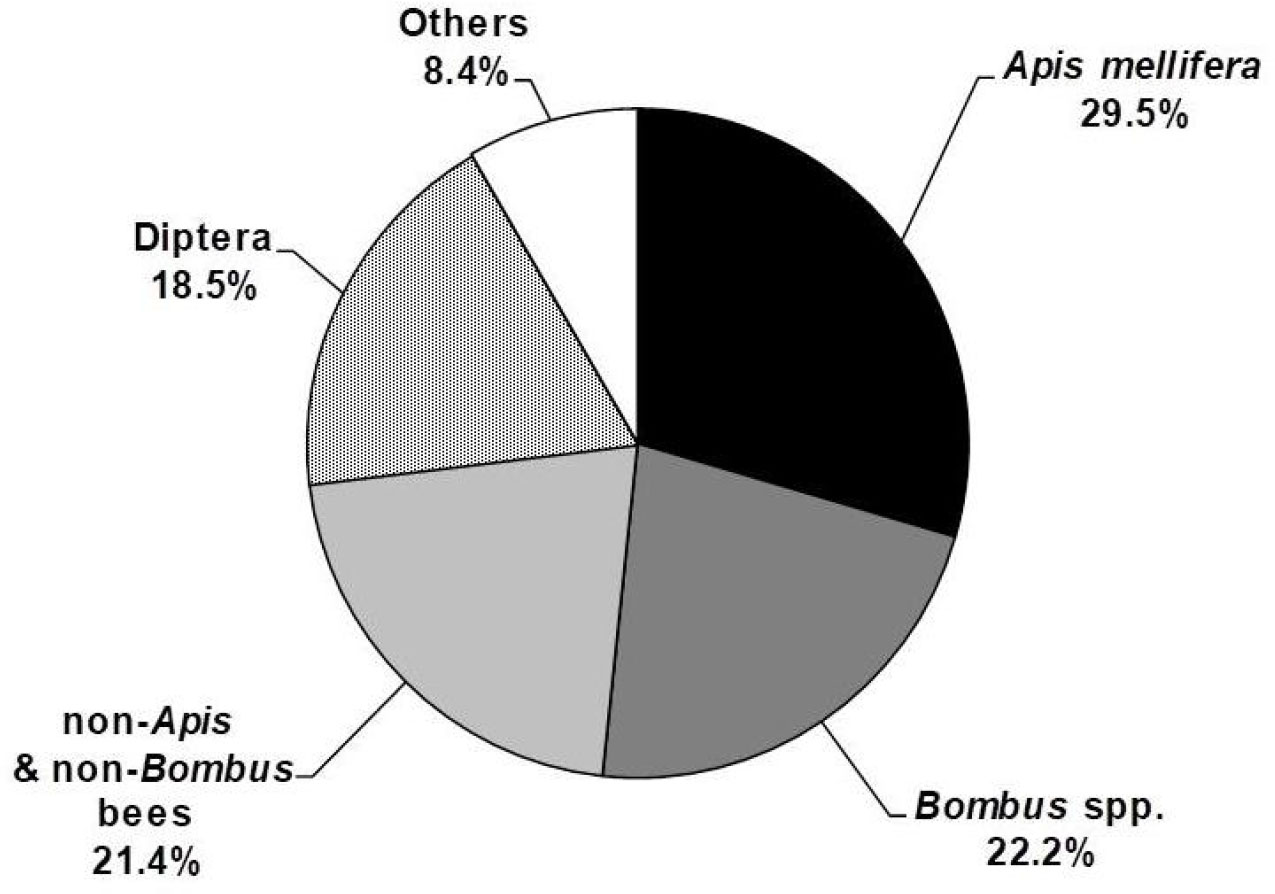
Fig. 5
Insect visits expressed as the percentage of total visits to Borago officinalis flowers recorded in 2007 and diurnal visitors to flowers.
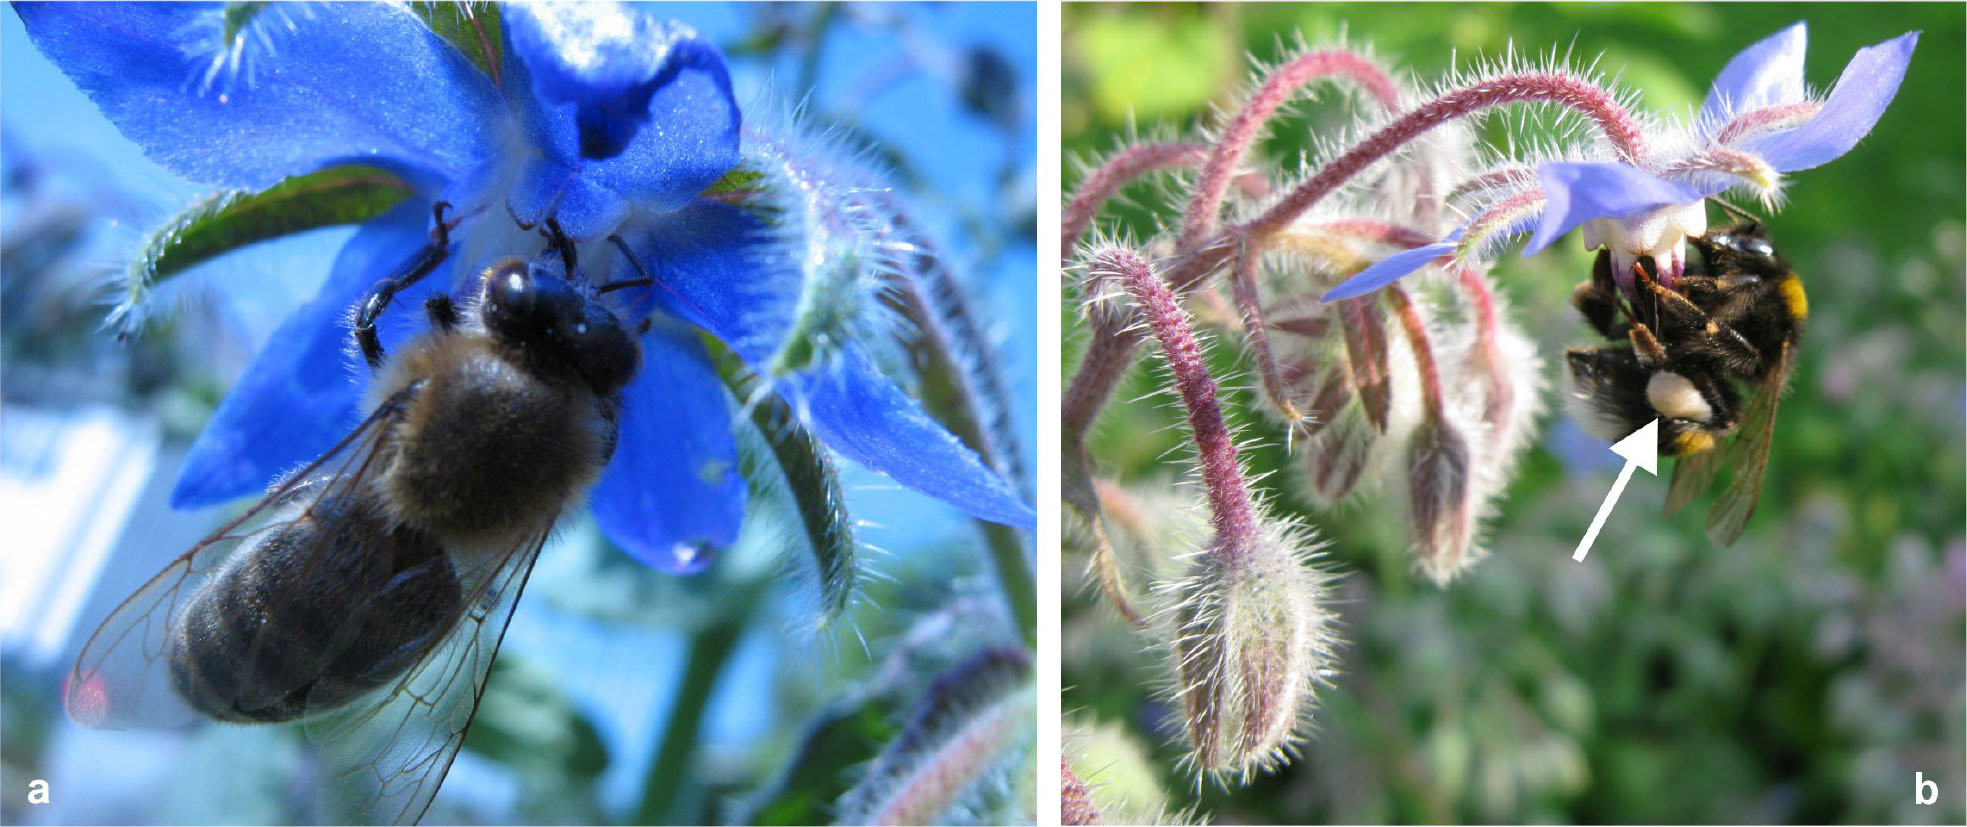
Fig. 6
Bees foraging on Borago officinalis flowers. a. Honey bee gathering nectar. b. Bumblebee collecting nectar and pollen with a visible corbicular pollen load (arrow).
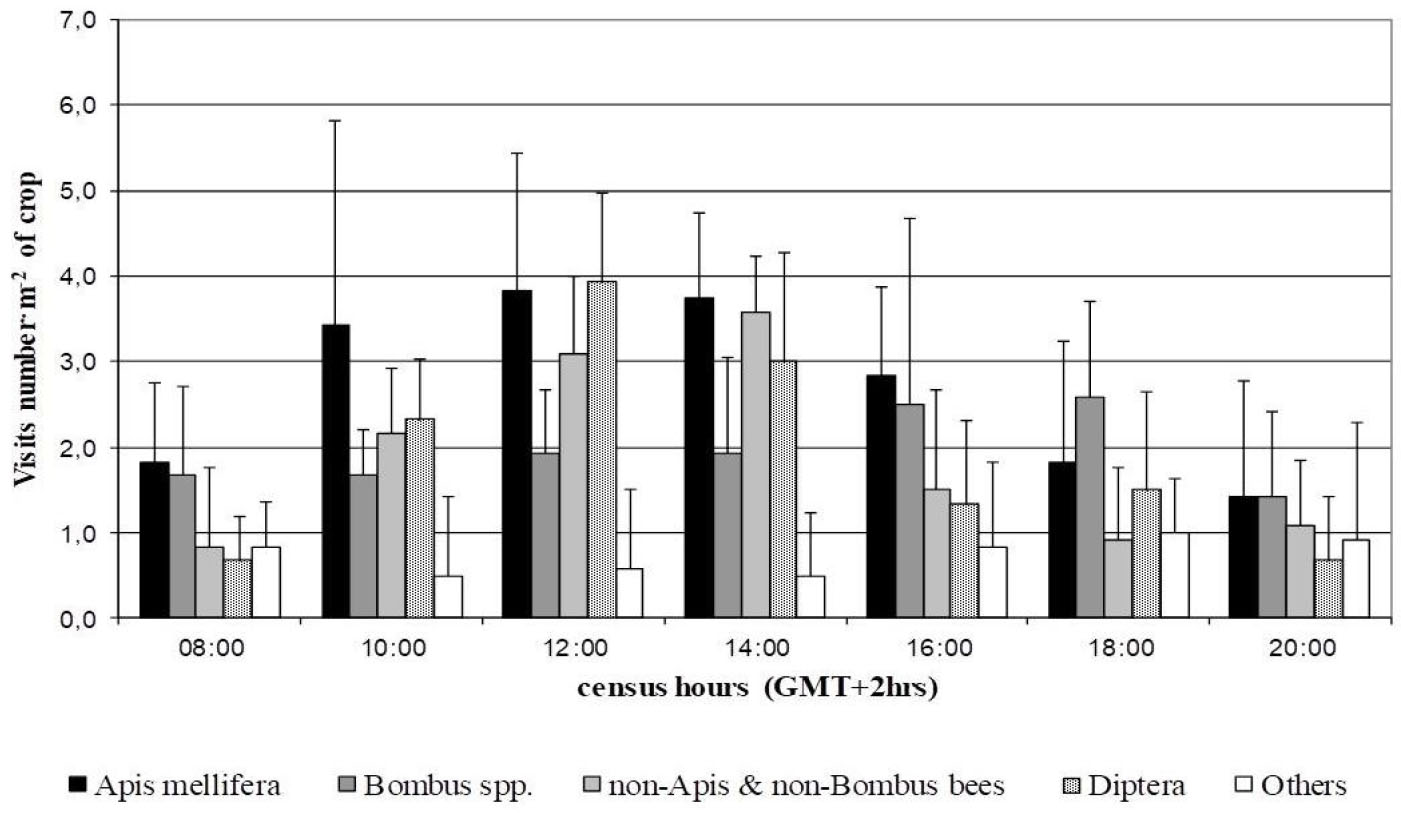
Fig. 7
Number of insect visits (mean and SD) to Borago officinalis crops throughout the day in the 2007 season (n = 252 records).