
1. Introduction
This paper analyzes the effects of hypothetical MW (HMW) increases on social and fiscal outcomes across European Union (EU) countries using the EU-wide microsimulation model EUROMOD. The analysis presented here supported the impact assessment report (European Commission, 2020b) accompanying the proposal of the European Commission (2020a) for an EU Directive on adequate minimum wages (MWs). The paper describes in detail the methodology underlying the simulations, including the challenges related to the use of available EU household survey data and the choices made to address these challenges. It then presents the estimated social impacts of HMW increases in 21 EU Member States with statutory national MW (NMWs).
The EUROMOD model is used because it allows for a comparable analysis of all EU Member States. More specifically, EUROMOD allows for an ex-ante assessment of the distributional, inequality, and poverty effects of real or hypothetical reforms in a comparative way across EU countries by considering the full set of interactions within the tax-transfer system of each country.1
The use of individual-level data, and microsimulation tools in particular, is crucial for the ex-ante assessment of the impacts of HMW increases for two reasons. First, the use of individual-level data allows the researcher to distinguish which individuals and groups would benefit considering their economic and demographic situation. Second, by taking account of taxes and benefits, microsimulation enables the researcher to simulate, on the one hand, the net income of MW earners and their families (which is a necessary step to assess social impacts) and, on the other hand, the impacts of HMW increases for public budgets.
While microsimulation takes account of taxes and benefits, the HMW scenarios are assessed in this study without modeling possible accompanying changes to parameters of the tax and benefits system. Such accompanying changes are commonly adopted as discretionary measures by governments and hence the link with MW increases is not automatic.2 For this reason, and to ensure that all countries are treated uniformly, simulations of HMW scenarios are assessed in this paper based on the assumption of unchanged tax and benefits rates.
From a methodological perspective, this paper combines two strengths of past ex-ante simulation studies that have examined the impacts of HMW scenarios in the EU in a comparative way: (1) the use of microsimulation methods and (2) the inclusion of all workers, irrespective of breaks in their employment history. In particular, like Matsaganis et al. (2015), this study uses EUROMOD to control for the interactions between MW policy and the tax-benefit system. However, because of challenges related to the available information on working time in the European Statistics on Income and Living Conditions (EU-SILC) data, Matsaganis et al. (2015) restrict the analysis to workers who worked in the same job (part-time or full-time) over the previous year. The disadvantage of this restriction is that it risks excluding many potential beneficiaries of MW policies. Therefore, following Eurofound (2014) and similarly to Detragiache et al. (2020), this paper includes workers with unstable employment histories by using the methodology proposed by Brandolini et al. (2010) to impute the working time in cases where this information is missing. The method adopted by Brandolini et al. (2010) is applied with an additional step of outlier correction to address measurement errors in hourly wages and correct for the possible bias that results from them.3
Besides the methodology used, this paper contributes to the literature by assessing a broader set of scenarios and types of impacts. In particular, hypothetical scenarios include increases in statutory MW (SMWs) to 40%, 45%, and 50% of the average wage and 50%, 55%, and 60% of the median wage.4 Besides the share of workers affected and their wage increases, outcomes assessed include: the increase in the aggregate wage bill, reductions in wage inequality, in-work poverty, the gender pay gap, and impacts on public budgets.
The simulations are static in the sense that second-round macroeconomic feedbacks are not explicitly modeled. However, indirect impacts on the labor market are simulated in two ways. First, possible negative employment effects are simulated based on an elasticity taken from a survey by Dube (2019b) of the literature of empirical employment effects of MW increases. Second, possible positive labor supply effects at the intensive margin (i.e., hours offered by workers) are assessed using labor supply elasticities estimated through EUROLAB (Narazani et al., 2021), a behavioral microsimulation model that relies on EUROMOD.
The results suggest that increasing SMWs to the lowest of the reference values (50% of the median wage or 40% of the average wage) would affect only about one-third of the 21 Member States with a SMW, while the highest reference values (60% of the median wage or 50% of the average wage) would affect almost all Member States. Although the implied wage increases are often substantial for the beneficiaries (often reaching 20%), the implied increases in the aggregate wage bill rarely exceed 2%, even in the scenarios with the highest reference values. The impact on public budgets is estimated to be generally positive because of higher revenues from personal income taxes and social security contributions, although the effect is quantitatively small.
The simulations suggest that MW increases can significantly reduce in-work poverty, wage inequality, and the gender pay gap. In the hypothetical scenarios with the highest reference values, the average reduction in in-work poverty over all EU Member States is 12%–13% and the average reduction in wage inequality (as measured by the D5/D1 indicator5) is 8%–10%, while the average reduction in the gender pay gap is 5%.
MW increases may have second-round effects through affecting the labor market. The two extensions in this paper aiming to simulate such effects suggest that (1) possible negative employment effects of MW increases are small as compared to the benefits of increased wages for low-wage earners; and (2) MW increases may have a small positive effect on the labor supply of MW earners at the intensive margin (more hours offered), especially among part-time workers.
The rest of this paper is organized as follows. The next section surveys the related literature on the social impacts of MWs. Section 3 briefly presents the current status of MWs across the EU, which serves as the baseline for the simulations, as well as the scenarios assessed. Section 4 discusses the data and the methodology. Section 5 presents the results of the simulations and Section 6 concludes.
2. Related Literature on the Social Impacts of MWs
The results presented in this paper fit within the recent strands of the literature indicating that MWs have a positive impact on social outcomes, particularly on wage inequality, the gender pay gap, and (in-work) poverty. This section places the present research in the context of these respective strands of the literature, including a brief discussion about unintended consequences (possible employment impacts).
2.1. Wage inequality
One of the main motivations behind MWs is to support the earnings of low earners and protect them from unfairly low wages. MWs are thus expected to reduce wage inequality. This hypothesis is borne out by the literature focusing on longer-term developments in wage inequality both in the US and Europe. While there are differences between their quantitative results, both Lee (1999) and Autor et al. (2016) attribute a significant part of the increase in US wage inequality since the 1980s to the erosion of the federal MW. Part of the explanation for these results is that MWs have a positive effect on higher wage levels as well (these are called “spillover” or “ripple effects”). When MWs are not updated, this may result in stagnating wages for a broader spectrum of workers, and not only for workers earning around the MW. Similarly, for Europe, Pereira and Galego (2019) find that MW increases have been among the important factors driving differences in wage inequality in Europe since the early 2000s.
2.2. Gender pay gap
While the literature on the impacts of MWs on the gender pay gap is scarcer than the other strands of literature discussed here, it has been known that the majority of MW earners are women, and therefore the impacts of MWs have a gender aspect. For instance, Belman and Wolfson (2014, p. 16) find in their survey that “[a]lthough the magnitude of the effect remains in play, there is universal agreement that the MW reduces wage inequality, particularly among women.” Focusing on Europe, and in particular on the introduction of the MW in Ireland and the UK, Bargain et al. (2018) show a large reduction of the gender wage gap at the bottom of the distribution in Ireland but a low impact in the UK. The authors suggest that the contrasting results between the two countries may be due to the degree of non-compliance with the UK NMW legislation. In the case of Poland, Majchrowska and Strawiński (2018) find MW increases significantly lowered the gender wage gap among young workers, although the impact was not large for adult workers.
2.3. (In-work) poverty
There is a significant academic literature on the impact of the MW on poverty outcomes that also considers the sociodemographic characteristics of MW earners. The poverty-alleviating impacts of MWs are mediated by demographic and other factors because many MW earners do not live in poor households (for instance because their partner earns a higher income), while many poor people are not MW earners (instead they are unemployed, inactive, self-employed, or in informal employment). For this reason, some papers have found that MWs have little impact on overall poverty rates (see, e.g., the survey of Belman and Wolfson, 2014). However, more recent research has found beneficial impacts of MWs on poverty outcomes. Based on individual-level data from the US for the period 1984–2013, Dube (2019a) finds that MWs significantly reduce the non-elderly poverty rate.
Relevant studies in Europe largely focus on countries that recently introduced a NMW, including the UK (1999), Ireland (2000), and Germany (2015). In most cases, these studies use microsimulation tools and generally find that the introduction of a MW had small but beneficial effects on poverty outcomes. In particular, Sutherland (2001b), studying the UK NMW, concludes that “the main contribution of the NMW is in underpinning the strategy of in-work benefits to supplement the family incomes of the low paid.” This conclusion is supported by Atkinson et al. (2017) who find, when assessing proposals by Atkinson (2015) to reduce inequality, that increasing the UK MW to a “living wage” level would reduce the poverty headcount slightly (by 0.4 percentage points), and it would also strengthen the impact of other hypothetical poverty-reducing tax-benefit reforms by about the same magnitude. Similarly, the literature on Ireland found that the MW is a relatively “blunt tool” to reduce poverty, but it is still effective in protecting the wages of low-skilled workers. In particular, Maitre et al. (2017) found that 17% of MW employees belong to a household that is at risk of poverty, compared to 3.3% of non–MW employees. In addition, Holton and O’Neill (2017) found that the Irish MW is an effective tool in protecting the income of low-skilled workers, particularly during recessions. Finally, in the case of Germany, microsimulation analyses by Müller and Steiner (2009, 2013) have concluded that the MW has only a small impact on overall poverty, both because it does not target poor households and because wage gains of poor households would be dampened by increased taxes and benefits withdrawn.6
Recent EU-wide work supports the view that MWs have a small reducing effect on overall poverty, but it also finds a more significant impact on in-work poverty. Analyzing the labor market status of households in the EU at risk of poverty, Eurofound (2014) conclude that the impact of increased MWs “on relative poverty at the household level would be limited.” Simulating the impacts of a hypothetical increase (or introduction) of a SMW at 50% of the national average wage in all EU Member States, Matsaganis et al. (2015) find that the “at-risk-of-poverty rate would fall by at least 1 percentage point in 13 out of 28 Member States.” Simulations by the European Commission (2016) also find small but beneficial impacts of HMW increases on poverty rates in the EU. Finally, Detragiache et al. (2020) find that “[a] hypothetical European MW set at 60% of each country's median wage would reduce in-work poverty but have limited effects on overall poverty.”
In this context, this paper focuses on in-work poverty as a relevant poverty-related outcome of MW policies since MW policies have a more direct impact on the poverty rate of workers than that of the total population. While MWs are not the only policy measures to fight poverty, they are found to be an important element in an effective policy mix to reduce in-work poverty and to improve work incentives.7 This is in line with conclusions from past microsimulation work cited above, as well as with recent theoretical advances on the link between MWs and optimal taxation.8
2.4. Possible unintended negative impacts including on employment
Some researchers have argued that the MW may fail to effectively protect low-wage earners because of its negative impacts on their employment. For instance, Neumark and Wascher (2008, p. 6) suggest that, “although MWs compress the wage distribution, because of employment and hours declines among those whose wages are most affected by MW increases, a higher MW tends to reduce rather than to increase the earnings of the lowest-skilled individuals.” Nevertheless, conclusions from the recent literature are in contrast to this warning. While negative employment impacts are possible, they tend to be small as compared to the wage increases for beneficiaries. For instance, in a survey of the most recent research, Dube (2019b) finds that “[o]verall the most up to date body of research from US, UK and other developed countries points to a very muted effect of MWs on employment, while significantly increasing the earnings of low paid workers. Importantly, this was found to be the case even for the most recent ambitious policies.” This paper relies on the survey of Dube (2019b) to calibrate the simulation of employment impacts.
2.5. Possible positive effect on labor supply at the intensive margin (hours offered)
There is a large literature on employment effects of MW. However, the effects of MW on both, the working hours that people would like to supply and the hours that people actually work, are less studied.
At the time of the early survey of Brown et al. (1982), the few studies on working hours produced ambiguous results. And neither has recent research found conclusive results on the effect of MWs on actual hours worked. After a MW increase for young workers in New Zealand, Hyslop and Stillman (2007) find increasing teenage working hours. In contrast, evidence from Germany of its MW introduction in 2015 suggests that it may have reduced working hours (Caliendo et al., 2019). Evidence from the introduction of the MW in the UK in 1999 was mixed instead (Dolton et al., 2010).
A priori, it is plausible that higher wage prospects should have a positive effect on labor supply. Nevertheless, the effect of MWs on hours offered by workers is still less studied than the effect on actual hours worked. This is related to the fact that hours offered are hard to observe. In a rare example of such studies, Dickens et al. (2014) study the discontinuity caused by youth MWs in the UK. They find evidence for an increase in job search intensity for 22-year-olds as compared to similar people a few months younger to whom lower minima applied. Whether positive effects on hours offered translate to an increase in actual hours worked likely depends on the economic context as well as on institutional factors.
3. MWs in the EU and Scenarios Assessed
MW protection can be provided by collective agreements or by SMWs, which are set by law. In six out of 27 EU Member States, MW protection is provided by collective agreements: Austria, Cyprus, Denmark, Finland, Italy, and Sweden. Of these Member States, Cyprus also has SMWs covering some low-wage occupations. The other 21 Member States have statutory NMWs (as opposed to SMWs that apply only to some occupations, as in Cyprus). In all Member States with statutory NMWs, collective agreements set wages above the SMWs in a number of sectors.
We analyze the impacts of hypothetical increases in statutory NMWs in the 21 EU Member States that have them. The simulations are assessed against a baseline scenario reflecting policies and MW levels in 2019.9 Figure 1 depicts this baseline: statutory NMWs expressed as a percentage of the gross national median and average wage in 2019. In 2019, MWs ranged from below 45% of the median wage in Estonia, Malta, and Ireland to about 60% of the median wage in Bulgaria and France and about 70% of the median wage in Portugal. In terms of the average wage, they ranged from <40% (in Estonia, Malta, Ireland, Czechia, Latvia, Hungary, and Romania) to about 50% in Portugal, France, Slovenia, and Spain.
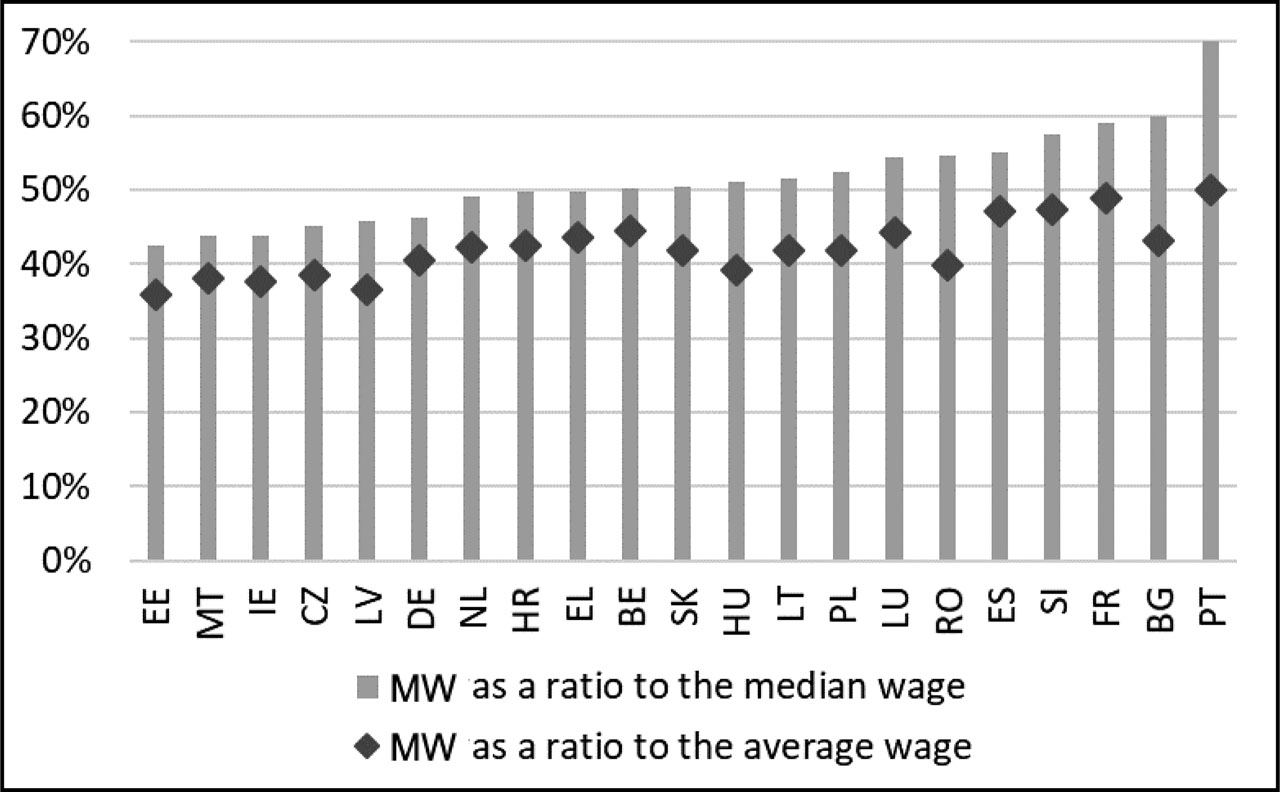
Figure 1
MWs, expressed as a percentage of the gross median and average wage of full-time workers, 2019.
Source: European Commission calculations based on Eurostat data. MWs, minimum wages.
We analyze two types of HMW scenarios. The first type of country-specific HMW is anchored on the median gross wage in the respective country, while the second type is based on the average gross wage. Wage statistics for the year 2019 are taken from Eurostat (for more detail, see Appendix B1).
For the first set of HMW scenarios, the ratios 50%, 55%, and 60% of median gross wage are calculated. For the HMW scenarios based on average gross wages, ratios of 40%, 45%, and 50% are applied. The ratios are set differently between both types of scenarios to make sure that they are comparable in terms of ambition (i.e., average wages are higher than median wages). Table A1 in Appendix contains further details about the HMW in euros corresponding to each of the scenarios.
4. Data and Methodology
4.1. The microsimulation model and the underlying data
To account for the interactions between HMW increases and the tax-benefit system, this analysis uses the EU-wide microsimulation tool EUROMOD, version I2.0+. The tax-benefit systems simulated in this version of the model refer to those in place as of June 30, 2019. For each individual in the data, tax liabilities and social benefit entitlements are simulated according to the laws of the respective country. Disposable income is calculated by adding benefits to and subtracting taxes from gross income of each individual. EUROMOD provides the same framework for all European countries and makes results comparable. Sutherland (2001a), and Sutherland and Figari (2013) provide a detailed description of the EUROMOD model.
The underlying data used in EUROMOD come from EU-SILC surveys from 2017. EUSILC surveys collect information on sociodemographic characteristics, income sources, employment status, and gross income for representative samples of the national populations. In some countries, data are enriched by country-specific data sources.10
In order to align the data on earnings and other non-simulated income components to the actual situation in 2019, data on individual income sources are inflated using uprating factors. Uprating factors are collected from national tax authorities, national statistical offices, or Eurostat. The sociodemographic characteristics of the population recorded in EU-SILC 2017 are kept constant.
EUROMOD can be used to assess the effects of actual or hypothetical policy changes and alternative economic and demographic scenarios. In this study, EUROMOD is used to assess the impact of hypothetical policy scenarios of increases in SMWs. These scenarios involve raising the gross wage of individuals in the data in cases where it is below the level of a HMW. Hence, the model calculates the taxes due, social insurance contributions, and benefits for each individual and household, both in the baseline and in the hypothetical scenarios.
EUROMOD allows us to take full account of the interactions between HMW increases and the tax-benefit system. An increase in the gross wage of a MW earner generally results in an increase of the net income of the worker's family, although the impact on net income is dampened by increased income taxes and reduced benefits.
EUROMOD is a static microsimulation model that simulates first-round effects of policy changes.11 It does not take into account potential behavioral reactions of individuals, e.g., changes in labor supply. Similarly, EUROMOD does not consider potential macroeconomic reactions, including the impacts of MWs on labor demand (and by implication employment) or consumer prices. Thus, main simulations of the social and fiscal impacts of MWs are calculated under the assumption that both individuals’ employment status and their working hours remain unchanged. However, we present two extensions to estimate possible impacts of HMW increases on, respectively, employment and labor supply at the intensive margin (i.e., hours offered). Section 4.3 provides more details on the methodology.
4.2. Simulating HMW scenarios
To account for potential measurement errors in the calculation of hourly wages, we adopt a set of correction methods. The technical details of the calculation of hourly wages and the data correction method can be found in Appendix B. We then assign the new HMW to potential MW workers. This assignment is done by increasing hourly wages to the level of the new HMW when the observed hourly wage is lower than that level. This is consistent with increased compliance and a reduced use of variations and exemptions (see Appendix B for a more detailed discussion). At the same time, the simulations assume no impact of MW increases on wages slightly above the new HMW; in other words, the simulations do not account for possible “spillover” effects.12
Statutory MWs apply to employees. Therefore, in this analysis, we do not change the incomes of individuals earning other types of income, such as self-employment or pension income. More specifically, the potential sample of HMW earners is selected under the following conditions: (1) positive employment income, (2) no self-employment income, (3) no pension income, and (4) not younger than 18 years. The wages of the remainder of the population remain unaffected by the HMW. In a next step, we recalculate annual earnings by multiplying the new hourly wage rate by the reported yearly working time.13 The new gross earnings are therefore higher than or equal to the gross earnings in the baseline.
Once the earnings are recalculated based on a specific HMW scenario, we run EUROMOD to calculate taxes, social insurance contributions, and benefits at the new level of gross earnings. This is needed to calculate the fiscal effects of the hypothetical scenarios and also the disposable income of households, which in turn is needed to assess the policy impact on in-work poverty.
4.3. Labor market effects
Besides its main results on the social and fiscal impacts of MWs, which are simulated as first-round effects, this paper includes two extensions to assess the possible labor market impacts of HMW increases. The first extension calculates possible negative employment effects based on elasticities estimated by the empirical literature. The second extension calculates labor supply adjustments at the intensive margin, i.e., modeling how increased wages may induce some workers to offer more working hours on the labor market.
4.3.1. The methodology of the calculation of employment effects
Employment effects are estimated using the so-called “own-wage elasticity,” which measures how employment in the group affected by the MW increase responds to an increase in the average wage of that group induced by the MW change.
The definition of the own-wage elasticity (OWE) implies that the change in total employment is the product of three factors:
(1) the own-wage elasticity (OWE);
(2) the estimated percentage increase in the wages of those affected by the MW increase (%ΔWageaff); and
(3) the share of workers affected by the new MW (Shareaff).
Expressed in formula, this means that:
Factors (2) and (3) are calculated using the EUROMOD microsimulations of various hypothetical scenarios.
Factor (1), that is, the OWE, is taken from the survey of the recent literature (Dube, 2019b). Based on 48 recent international studies estimating the OWE, including evidence on EU Member States, Dube (2019b, p. 50) finds that the median elasticity reported in the literature is −0.16.14
An elasticity of −0.16 means that the MW raises the earnings of beneficiaries by much more than its possible negative impact on employment reduces earnings (by about a ratio of 6:1). For the overall impact of a MW increase to be negative on the overall earnings of low-wage earners, a OWE lower than −1 is required. Accordingly, elasticities between 0 and −0.4 can be considered as “small in magnitude” (Dube, 2019b, p. 27).
There is uncertainty around the elasticity used, which also affects the employment impacts obtained using the elasticity. More optimistic and pessimistic scenarios could also be constructed by rescaling the central estimate of the elasticity. For instance, a more pessimistic scenario is constructed by the CBO (2019) by assuming that long-term effects of MW increases exceed those implied by the estimated short-term elasticities by 50%.15 A more optimistic scenario, in turn, could be that MW increases, especially at moderate levels, do not have a negative employment effect at all. Such an optimistic scenario could be based on the consideration that many of the studies used in the literature surveys focus on specific groups of workers, such as teenagers, and are not necessarily indicative of the overall impacts of MWs. Studies focusing on a broader set of low-wage workers, on average, imply smaller employment effects. In particular, “for the set of studies that consider broad groups of workers the median OWE estimate is quantitatively close to zero (−0.04)” (Dube, 2019b, p. 50).
4.3.2. The methodology of the calculation of labor supply effects
Labor supply effects are calculated using labor supply elasticities at the intensive margin that measure how working hours in the group affected by the MW increase may respond to an increase in the average wage of that group induced by the MW change. Labor supply elasticities are calculated using EUROLAB and its discrete choice labor supply model that relies on EUROMOD to construct the budget constraints.16 In particular, we run a version of EUROLAB with a choice set consisting of four ranges of positive working hours ([5–18], [19–32], [33–46], and [47–60]) plus an alternative of zero working hours. The final choice set established in this case consists of five alternatives for singles and 25 for couples. To calculate the elasticity of labor supply, the EUROLAB model first estimates preference parameters used to compute the changes in working hours after an increase by 1% of gross wages. Based on this definition of the labor supply elasticity, we can derive the change in total working hours as follows:
where ɛ is the labor supply elasticity at the intensive margin; %ΔWageaff is the estimated percentage increase in the wages of the workers affected by the MW increase; Shareaff and Hoursaff are, respectively, the share and the average working hours of the workers affected by the new MW; and Shareunaff and Hoursunaff are, respectively, the share and the average working hours of the workers not affected by the new MW.5. Results
This section presents the results by type of impact. The first four subsections present: the impacts on SMWs themselves (Section 5.1), the share of workers affected by the MW increase, that is, the share of workers earning the MW under the scenarios (Section 5.2), the implied wage increase for those affected (Section 5.3), and the implied increase in aggregate wages (Section 5.4).
The next three subsections present the impacts of various hypothetical scenarios on indicators related to the most relevant social outcomes: on wage inequality (Section 5.5), in-work poverty (Section 5.6), and the gender pay gap (Section 5.7).
Impacts on public budgets are presented in Section 5.8. The presentation of the results in Sections 5.1 to 5.8 focuses on the impacts on the 21 Member States with a statutory NMW. To complement these results, Section 5.9 summarizes selected implications of these results at the EU level.
5.1. SMWs
HMWs at 60% of the median wage and 50% of the average wage are the two highest ones of the six reference values assessed. As can be seen in Figure 1 above, they are close to the highest SMWs currently observed in the EU. The MWs in Bulgaria, France, Portugal, and Slovenia are at or close to 60% of the median, while the countries approximating 50% of the average wage are France, Portugal, Slovenia, and Spain.
In contrast, the lowest reference values would imply a gap to be closed for about one-quarter to one-third of Member States. A reference value of 50% of the median wage would imply increases for nine Member States from their 2019 levels (Czechia, Croatia, Estonia, Germany, Greece, Ireland, Latvia, Malta, the Netherlands; the implied increase would be small in Croatia, Greece, and the Netherlands). Meanwhile, a reference value of 40% of the average wage would imply increases for six Member States: Czechia, Estonia, Hungary, Ireland, Latvia, and Malta.
Intermediate reference values would imply gaps to close for one-half to two-thirds of the Member States. In particular, an intermediate reference value of 55% of the median wage would imply increases for 15 Member States. These are (in addition to the ones below 50% in 2019): Belgium, Slovakia, Hungary, Lithuania, Luxembourg, and Poland. Meanwhile, an intermediate reference value of 45% of the average wage would imply increases for 17 Member States. These are (in addition to the ones below 40% in 2019): Belgium, Bulgaria, Croatia, Germany, Greece, Lithuania, Luxembourg, the Netherlands, Poland, Romania, and Slovakia (Figure 1 above).
The percentage increase in SMWs, implied by the various indicative reference values, are shown in Figure A1 in Appendix. (Table A1 in Appendix presents the implied increases in nominal terms.) The largest increases in MWs (i.e., reaching 30% in the case of the highest reference values) are implied in Member States such as Czechia, Estonia, Ireland, Latvia, and Malta, while the smallest increases (below 10% for the highest reference values) are implied for France, Portugal, Slovenia, and Spain.
While higher or lower reference values can be defined both in terms of the average and the median wage, the two indicators have somewhat different implications across Member States. In particular, reference values based on the average wage imply somewhat higher MWs for Member States such as Bulgaria, Hungary, Portugal, and Romania, while the reverse is true for Member States such as Belgium, Germany, Greece, Malta, and the Netherlands. The reason is that, while the average wage is higher than the median wage in all countries, the difference between both is not uniform across Member States.17
5.2. The share of workers affected
Countries can be divided into three groups based on the share of workers affected by the highest reference values. In seven Member States, the share of workers earning the MW would exceed 20% if the MW were set at 60% of the median wage; these countries are Estonia, Greece, Ireland, Luxembourg, Poland, Spain, and Romania. If set at 50% of the average wage, the share of workers would reach 20% also in Bulgaria and Hungary (see Figure A4 in Appendix; Figure A3 shows the share of workers earning the MW in the baseline).
In contrast, the share of MW earners would remain below 10% in Belgium, France, Lithuania, the Netherlands, and Slovenia even if the MW were set at 60% of the median or 50% of the average wage. In the rest of the countries, the share of MW earners is estimated to be between 10% and 20% at the highest reference values for SMWs (Figure A4 in Appendix).
5.3. The wages of those affected
The increase in the wages of beneficiaries (i.e., those workers originally earning at or below the HMW) would reach 20% in a number of countries under all scenarios. The average wage increase for the workers affected depends mainly on the initial level of the SMW and the shape of the wage distribution close to the MW, that is, the number of workers around the SMW that are affected when the MW increases. For the scenario in which MWs are set at 60% of the gross median wage, the average wage increase would reach 30% in Estonia and 25% in Germany, Greece, and Ireland. In the scenario where MWs are set at 50% of the average wage, the wage increase for affected workers would reach 25% only in Estonia (Figure A5 in Appendix).
5.4. Aggregate wages
The simulated increase of the wage bill depends on two factors: the share of workers affected and the average increase in earnings triggered by the new MW.
In the scenario where MWs are set at 60% of the median wage, the largest increase in the wage bill would be recorded in Greece, exceeding 4%. Other EU countries with an increase in the wage bill above 2% would be Ireland, Estonia, and Poland. In the scenario where MWs are set at 50% of the average wage, the largest increase in the wage bill would be recorded in Romania (above 4%) followed by Bulgaria, Estonia, Greece, Ireland, and Poland (above 2%; see Figure A6 in Appendix). These countries exhibit both a high share of MW earners at such levels of the MW (especially Greece and Poland) and a large increase in the wages of affected workers (especially Estonia and Ireland).
5.5. Wage inequality
A reduction of at least 10% in wage inequality would be observed in 12 Member States if their MWs were raised to 60% of the median wage. A reduction of at least 15% in wage inequality would be observed in seven Member States (Czechia, Germany, Estonia, Spain, Luxembourg, Poland, Slovakia; see Figure A7 in Appendix). These decreases occur from a high initial level of wage inequality in Spain but lower initial levels in other countries, such as Czechia, Poland, and Slovakia.
In the scenario where MWs are set at 50% of the average wage, the largest decreases in wage inequality are observed in Estonia and Romania (above 20%). The group of countries with a decrease exceeding 15% largely overlaps with the group of countries with a similar decrease in the scenario of 60% of the median wage, but it also includes Bulgaria and Greece, while excluding Germany.
5.6. In-work poverty
Eight countries would record a reduction by >20% in in-work poverty should they increase their SMW to a reference value of 60% of the median gross wage or 50% of the average (Figure A8 in Appendix).18 The most significant reductions in absolute terms are observed in Estonia, Greece, and Romania, where this would imply a decline in in-work poverty of >2 percentage points. However, decreases also reach 20% in Germany, Hungary, and Luxembourg, albeit from a lower baseline. Reductions would be lower, the most significant ones typically between 10% and 20%, if MWs were increased to the intermediate reference values (45% of the average wage or 55% of the median), while they would remain close or below 10% for the lower values (40% of the average wage or 50% of the median).
In some countries, such as Slovenia and the Netherlands, MW increases do not always reduce in-work poverty in the simulations. This is due to increased taxes (in the Netherlands) and reduced means-tested benefits (in Slovenia) for some beneficiary households. It is possible that the parameters of the tax-benefit systems would be adjusted by governments in the wake of MW adjustments to avoid such effects or to keep incentive effects unchanged. Such adjustments are not modeled (see related discussion in Section 1).19
5.7. The gender pay gap
The gap between the average wages of men and women declines in all EU countries as the MW increases. This is because a majority of MW earners are women in all EU Member States.20
In the scenario where MWs are set at 60% of the median wage, the gender pay gap declines by >20% in Greece and by >10% in Spain, Romania, and Slovakia (Figure A9 in Appendix). In the scenario in which MWs are set at 50% of the average wage, the gender pay gap declines by 25% in Romania and by >10% in Greece, Luxembourg, Poland, and Slovakia. In these hypothetical scenarios, the reduction in the gender pay gap is significant, exceeding 5% in a number of countries, including in some where the gap in average wages between men and women is high (e.g., Czechia, Latvia, Germany).
5.8. Fiscal effects
MWs affect public budgets in a number of ways. As a direct cost, higher MWs may increase the public-sector wage bill in the case where a share of public-sector employees earn the MW; the public-sector wage bill can also increase due to possible links of public-sector pay scales to the MW. Higher MWs may also raise the cost of some public procurements.21 This effect is, however, more than counterbalanced by the indirect effects on public revenues.
An increase in the MW raises revenues from labor taxes and contributions and may also reduce benefits expenditure. This effect is indirect but larger than any negative effect on the public-sector wage bill because few public employees earn wages close to the MW. For instance, Zandvliet et al. (2019) estimate that, in the Netherlands, increased revenues from labor taxes and benefits exceed direct costs related to the public wage bill by a factor between 4 and 5. Similarly, for the US, Zipperer et al. (2021) estimate that an increase of the federal MW would significantly reduce expenditure on public assistance programs and increase social security-related revenue.22 On the other hand, benefits expenditure may increase in countries where some social benefits are automatically linked to the MW.23 It is these impacts, on personal income taxes, social security contributions, and benefits entitlements, that are simulated in the present analysis using EUROMOD. Possible second-round effects, including impacts through taxes on corporations and consumption, are not modeled.
According to the simulations, MWincreases have a small but positive effect on public budgets, driven by increases in tax revenues and reductions of benefit expenditure (Figure A10 in Appendix). The magnitude of these effects is small; the overall improvement of public budgets is smaller than or equal to 0.1% of gross domestic product (GDP) in the scenarios implying smaller changes (50% of the median or 40% of the average wage), reaching 0.4% of GDP only in a few cases where MWs are increased to 60% of the median wage (in Estonia, Germany, Greece, and the Netherlands) and 50% of the average (in the Netherlands, Poland, and Romania). In turn, the simulations imply a small negative impact on the public budget balance for Hungary and Spain. Negative fiscal effects are driven by lower tax revenues in Hungary and by lower revenues from social security contributions in Spain. Results may be sensitive to modeling assumptions, including those related to how other policies, which are not automatically linked to the MW (e.g., tax brackets, rules of tax credits), would change under the various scenarios.
5.9. Extensions: Effects on employment and labor supply
5.9.1. Possible negative employment effects
As explained in more detail in Section 4.3.1 above, possible negative employment effects of higher SMWs are derived by applying an “own-wage elasticity” to the implied wage increase of MW earners.
The results show that possible negative employment effects remain below 0.2% in most cases if Member States increased their MWs to the lower reference values. The employment effect exceeds this level in Estonia and Ireland in the case of 40% of the average wage and also in Germany and Greece in the case of 50% of the median (Figure A11 in Appendix). If MWs were increased to intermediate reference values, negative employment effects would remain below 0.5% of total employment in most cases, and below 1% in all cases.
Finally, negative employment effects would remain below 0.8% in most cases for high reference values, but would reach 1% in Estonia, Greece, and Ireland (at 60% of the median wage) as well as in Greece and Romania (at 50% of the average wage).
5.9.2. Possible positive labor supply effects
As discussed in Section 2, higher SMWs can have positive impacts on labor supply. Following the method described in Section 4.3.2, we estimated labor supply elasticities using EUROLAB. As shown in Table A2 in Appendix, labor supply elasticities are relatively small in most of the countries – <0.1 (except in Germany). Table A2 in Appendix shows that the number of working hours supplied by workers affected by the MW increases is relatively high in most EU countries, being similar to those of the overall workforce. Only Germany stands out for a lower number of working hours, which may be explained by holders of “Minijobs,” a form of marginal employment with reduced fiscal burden. Given the low values of labor supply elasticities at the intensive margin, the estimated labor supply effects are also relatively small (Figure A12 in Appendix). In most countries, the impact would be below 0.2%. In Germany and Ireland, the effect is higher in some scenarios, but not substantially exceeding 0.5%. Labor supply effects are therefore even smaller (in absolute terms) then the employment effect estimates.24 Overall, the impacts of our simulated MW increases on employment and labor supply are relatively small.
5.10. Implied impacts at the EU level
5.10.1. Number of beneficiaries
If Member States increased their MWs to the highest reference values, wages could increase for 22 million workers (at 60% of the median wage) or 24 million workers (at 50% of the average wage).25 At intermediate reference values, the number of direct beneficiaries is estimated to be 11 million (55% of median wage) and 12 million (45% of the average wage). The difference is larger between both low reference values: if SMWs were increased to 50% of the median wage, this would increase wages for 5.4 million workers, while increases to 40% of the average wage would benefit 0.7 million workers. The EU-level results presented in this section are summarized in Table 1.
Table 1
A summary of results at the EU level
| Median wage | Average wage | |||||
|---|---|---|---|---|---|---|
| 50% of median wage | 55% of median wage | 60% of median wage | 40% of average wage | 45% of average wage | 50% of average wage | |
| Countries affected (of the 21 with a statutory national MW) | 9 MS: CZ, DE, EE, EL, HR, IE, LV, MT, NL | 15 MS: all but BG, ES, FR, PT, RO, SI | 19 MS: all but PT and BG | 6 MS: CZ, EE, HU, IE, LV, MT | 17 MS: all but ES, FR, PT, SI | 20 MS: all but PT |
| Number of workers affected | 5 million | 11 million | 22 million | 0.7 million | 12 million | 24 million |
| Increase in the EU wage bill (%) | 0.2 | 0.4 | 1.0 | 0.01 | 0.4 | 1.0 |
| Impact on wage inequality (%) | −2 | −5 | −8 | −1 | −6 | −10 |
| Impact on in-work poverty (%) | −2 | −6 | −12 | −1 | −7 | −13 |
| Gender pay gap (%) | −0.7 | −2 | −5 | −0.2 | −2 | −5 |
| Impact on total employment (%) | −0.1 | −0.2 | −0.4 | −0.01 | −0.2 | −0.5 |
| Impact on labor supply (hours offered) (%) | 0.00 | 0.07 | 0.15 | 0.05 | 0.09 | 0.17 |
[i] Notes: EUROMOD simulations. The baseline scenario reflects MWs in 2019. Impacts on wage inequality, in-work poverty, and the gender pay gap reflect an unweighted arithmetic average across EU Member States. Impacts on employment and hours offered reflect EU averages weighted by employment.
[ii] BE, Belgium; BG, Bulgaria; CZ, Czech Republic; DE, Germany; EE, Estonia; EL, Greece; ES, Spain; EU, European Union; EU, European Union; FR, France; HR, Croatia; HU, Hungary; IE, Republic of Ireland; LT, Lithuania; LU, Luxembourg; LV, Latvia; MS, Member States; MT, Malta; MW, minimum wage; NL, The Netherlands; PL, Poland; PT, Portugal; RO, Romania; SI, Slovenia; SK, Slovakia.
5.10.2. Increase in the EU wage bill
MW increases to the level of the highest reference values (60% of the median wage or 50% of the average) would imply increases in overall wages of about 1% at the EU level.26 Increases to intermediate reference values (i.e., 55% of the median wage or 45% of the average) would imply an overall wage increase of about 0.4%. The lower reference values imply smaller increases: an increase in the EU wage bill of about 0.2% (at 50% of the median wage) or an increase of 0.01% (at 40% of the average wage; see Table 1).
5.10.3. Wage inequality, in-work poverty, gender pay gap
Increasing SMWs to the lowest reference values would reduce wage inequality in EU Member States by 1%–2%, on average.27 Increases to intermediate reference values would imply an average decrease in wage inequality of about 5%–6%, while increases to high reference values would imply an average decrease in wage inequality of about 8%–10% (Table 1).
The implied EU-wide impacts on in-work poverty are somewhat larger than the impacts on wage inequality, while the impacts on the gender pay gap are somewhat smaller. In particular, increases in SMWs to the highest reference values would imply in EU Member States a decrease in in-work poverty of about 12%–13%, on average, and a 5% average decrease in the gender pay gap (Table 1).
5.10.4. Employment effects
An EU-wide employment effect can also be calculated based on the country-specific simulations. Increasing all SMWs to the lower reference values (40% of the average wage or 50% of the median wage) would imply a reduction of 0.1% of EU employment or less. Increasing SMWs to intermediate reference values implies a reduction in total employment of 0.2%, while increasing SMWs to the highest reference values implies a reduction in total employment of 0.4%.
5.10.5. Labor supply effects
The EU-wide labor supply effects are smaller (in absolute terms) than the employment effects. Increases of the SMW to the highest reference values would increase the number of working hours offered by MW earners by <0.2%. If this effect materializes, it may partly counterbalance the possible negative employment effects.
6. Conclusions
This paper analyzes the effects of HMW increases on social outcomes in 21 EU countries with a statutory NMW. Using the microsimulation model EUROMOD, it assesses the impact of HMW increases on wages and wage inequality, in-work poverty, and the gender pay gap, as well as on the public budgets of Member States. Results of this analysis were used in the impact assessment of the European Commission's proposal for an EU Directive on adequate MWs in the EU.
From a methodological perspective, the paper combines two important strengths of past analyses: First, following Matsaganis et al. (2015), it uses EUROMOD to control for the interactions between MW policy and the tax-benefit system. Second, following Eurofound (2014) and similarly to Detragiache (2020), it includes individuals with an unstable employment history. The inclusion of these workers is important for the analysis given that they are an especially vulnerable group of workers with potentially low wages. The methodological challenges include potential measurement error in reported earnings and working time in EU-SILC. The possible bias resulting from this challenge is addressed by an outlier correction methodology.
The simulations suggest that MW increases can reduce in-work poverty, wage inequality, and the gender pay gap significantly. In the hypothetical scenarios with the highest reference values, the average reduction in in-work poverty over all EU Member States is 12%–13%, the average reduction in wage inequality is 8%–10%, and the average reduction in the gender pay gap is 5%. While the implied wage increases are substantial for the beneficiaries, the implied increases in the aggregate wage bill are generally modest, suggesting that expected impacts on employment and competitiveness are also likely to be modest overall. Finally, MW increases are estimated to have a small impact on public budgets, improving the budget balance in most cases.
The simulations are static: second-round macroeconomic feedbacks are not assessed. However, two extensions explore the indirect impact of MW increases on labor market outcomes. The first extension simulates possible negative employment effects based on an elasticity reflecting the state-of-the-art empirical literature. The elasticity suggests that the MW raises the earnings of beneficiaries by much more than its possible negative impact on employment reduces earnings (by about a ratio of 6:1). The second extension uses EUROLAB to estimate possible labor supply effects at the intensive margin consistent with the notion that some workers would offer to work more hours at a higher hourly wage. The labor supply effects are lower (in absolute terms) than the employment effects. Hence, considering the two extensions, the overall labor market impact of MW simulations is expected to be small.
There is uncertainty around the simulated results. In particular, some of the methodological choices taken may result in an overstatement or understatement of the simulated impacts. For example, the assumption of full compliance with the HMW may imply an overestimation of the impacts, although this possible effect is limited by the outlier correction method. On the other hand, the assumption of no spillover effects (i.e., no impacts on the wages of workers earning slightly more than the MW) may result in an underestimation of the impacts. However, in case the results overstate the positive social impacts of the hypothetical scenarios, they also overstate the possible negative impacts on employment by the same degree (and vice versa).
A possible avenue for further research would be to more comprehensively model second-round effects of MW increases in the economy. In particular, it would be possible to link the microsimulation model with a macroeconomic model to take account of such general-equilibrium feedback effects. However, in such approaches, there is a risk of the implications of the macroeconomic model not being consistent with the latest empirical research on the impacts of MWs. Some macroeconomic models, due to their simplified neoclassical labor market module, overemphasize possible negative impacts of MW increases on employment and economic activity as compared to the body of recent empirical evidence.
Declarations
Availability of Data and Material
Data used is available through the European Commission https://euromod-web.jrc.ec.europa.eu/access-euromod#inline-nav-3 Codes are available upon reasonable request.
Competing Interests
Not Applicable.
Funding
Not Applicable.
Authors’Contributions
Not Applicable.
Acknowledgments
The views expressed in this document are solely those of the author(s) and do not necessarily represent the official views of the European Commission. At the time of writing, Áron Kiss and Stefano Filauro were working at the European Commission, Directorate-General for Employment, Social Affairs and Inclusion. The authors would like to thank Denis Leythienne (Eurostat) and Christine Aumayr-Pintar (Eurofound) for their help on minimum wage statistics; our colleagues at the European Commission: Alfonso Arpaia, Alessia Fulvimari, Kristine van Herck, Alkistis Zavakou (DG EMPL), Anneleen Vandeplas (DG ECFIN), Ana Agúndez García, Salvador Barrios, Bianey Palma Fernández, Alberto Tumino (JRC), and other colleagues from the Fiscal Policy Analysis Unit (B2) at JRC and the Country Reform (A3) and Thematic Analysis (A4) units at DG EMPL, as well as an anonymous referee, for useful comments and suggestions; and Mirela Music for statistical support. Any remaining errors are ours.
APPENDIX
Appendix A
Additional Tables and Graphs
A1. Additional tables
Table A1
SMWs in the various scenarios
| Countries | Statutory MW | Hypothetical MW as a ratio of | |||||
|---|---|---|---|---|---|---|---|
| Median wage | Average wage | ||||||
| 50% | 55% | 60% | 40% | 45% | 50% | ||
| Belgium | 1,594 | 1,584 | 1,742 | 1,900 | 1,434 | 1,613 | 1,792 |
| Bulgaria | 286 | 239 | 262 | 286 | 266 | 299 | 332 |
| Czechia | 519 | 580 | 638 | 695 | 545 | 613 | 681 |
| Germany | 1,557 | 1,680 | 1,848 | 2,016 | 1,537 | 1,729 | 1,921 |
| Estonia | 540 | 636 | 699 | 763 | 601 | 676 | 751 |
| Greece | 758 | 761 | 837 | 914 | 695 | 782 | 869 |
| Spain | 1,050 | 952 | 1,047 | 1,142 | 893 | 1,005 | 1,116 |
| France | 1,521 | 1,288 | 1,417 | 1,546 | 1,243 | 1,399 | 1,554 |
| Croatia | 506 | 510 | 561 | 611 | 478 | 538 | 598 |
| Hungary | 464 | 451 | 496 | 541 | 469 | 528 | 586 |
| Ireland | 1,656 | 1,886 | 2,074 | 2,263 | 1,757 | 1,977 | 2,196 |
| Lithuania | 555 | 538 | 591 | 645 | 532 | 598 | 665 |
| Luxembourg | 2,071 | 1,919 | 2,110 | 2,302 | 1,888 | 2,124 | 2,360 |
| Latvia | 430 | 470 | 517 | 564 | 470 | 529 | 588 |
| Malta | 762 | 871 | 958 | 1,045 | 798 | 898 | 997 |
| Netherlands | 1,616 | 1,662 | 1,828 | 1,994 | 1,545 | 1,738 | 1,931 |
| Poland | 523 | 505 | 555 | 606 | 506 | 570 | 633 |
| Portugal | 700 | 499 | 549 | 599 | 561 | 631 | 701 |
| Romania | 446 | 402 | 443 | 483 | 440 | 495 | 551 |
| Slovenia | 887 | 771 | 848 | 925 | 748 | 842 | 935 |
| Slovakia | 520 | 515 | 566 | 618 | 498 | 560 | 622 |
[i] Source: SMWs from Eurofound (2019). HMWs are derived from Eurostat data on median and average wages.
[ii] Note: HMWs, which are smaller than actual SMWs, are marked in gray. Wages of countries outside the Euro area are expressed in EUR. All wage levels are reported in gross terms.
[iii] HMWs, hypothetical MWs; MW, minimum wage; SMWs, statutory MWs.
Table A2
Labor supply elasticities and average working hours
| Country | Labor supply elasticity | Average working hours of MW earners | Average working hours of non–MW earners |
|---|---|---|---|
| Belgium | 0.048 | 31.4 | 36.8 |
| Bulgaria | 0.041 | 38.2 | 40.4 |
| Czechia | 0.045 | 37.7 | 40.9 |
| Germany | 0.123 | 29.8 | 37.9 |
| Estonia | 0.031 | 37.5 | 40.1 |
| Greece | 0.025 | 35.5 | 39.9 |
| Spain | 0.052 | 30.2 | 38.3 |
| France | 0.083 | 32.9 | 37.3 |
| Croatia | 0.005 | 39.0 | 40.7 |
| Hungary | 0.023 | 39.9 | 39.7 |
| Ireland | 0.092 | 30.5 | 34.3 |
| Lithuania | 0.048 | 37.4 | 39.6 |
| Luxembourg | 0.041 | 36.8 | 39.7 |
| Latvia | 0.037 | 38.0 | 40.2 |
| Malta | 0.056 | 31.3 | 39.6 |
| Netherlands | 0.046 | 28.2 | 33.3 |
| Poland | 0.025 | 37.2 | 41.0 |
| Portugal | 0.069 | 37.2 | 40.3 |
| Romania | 0.011 | 40.8 | 41.0 |
| Slovenia | 0.036 | 37.5 | 40.1 |
| Slovakia | 0.023 | 39.0 | 39.7 |
[i] MW, minimum wage.
[ii] Source: Calculations based on EUROLAB.
A2. Additional graphs
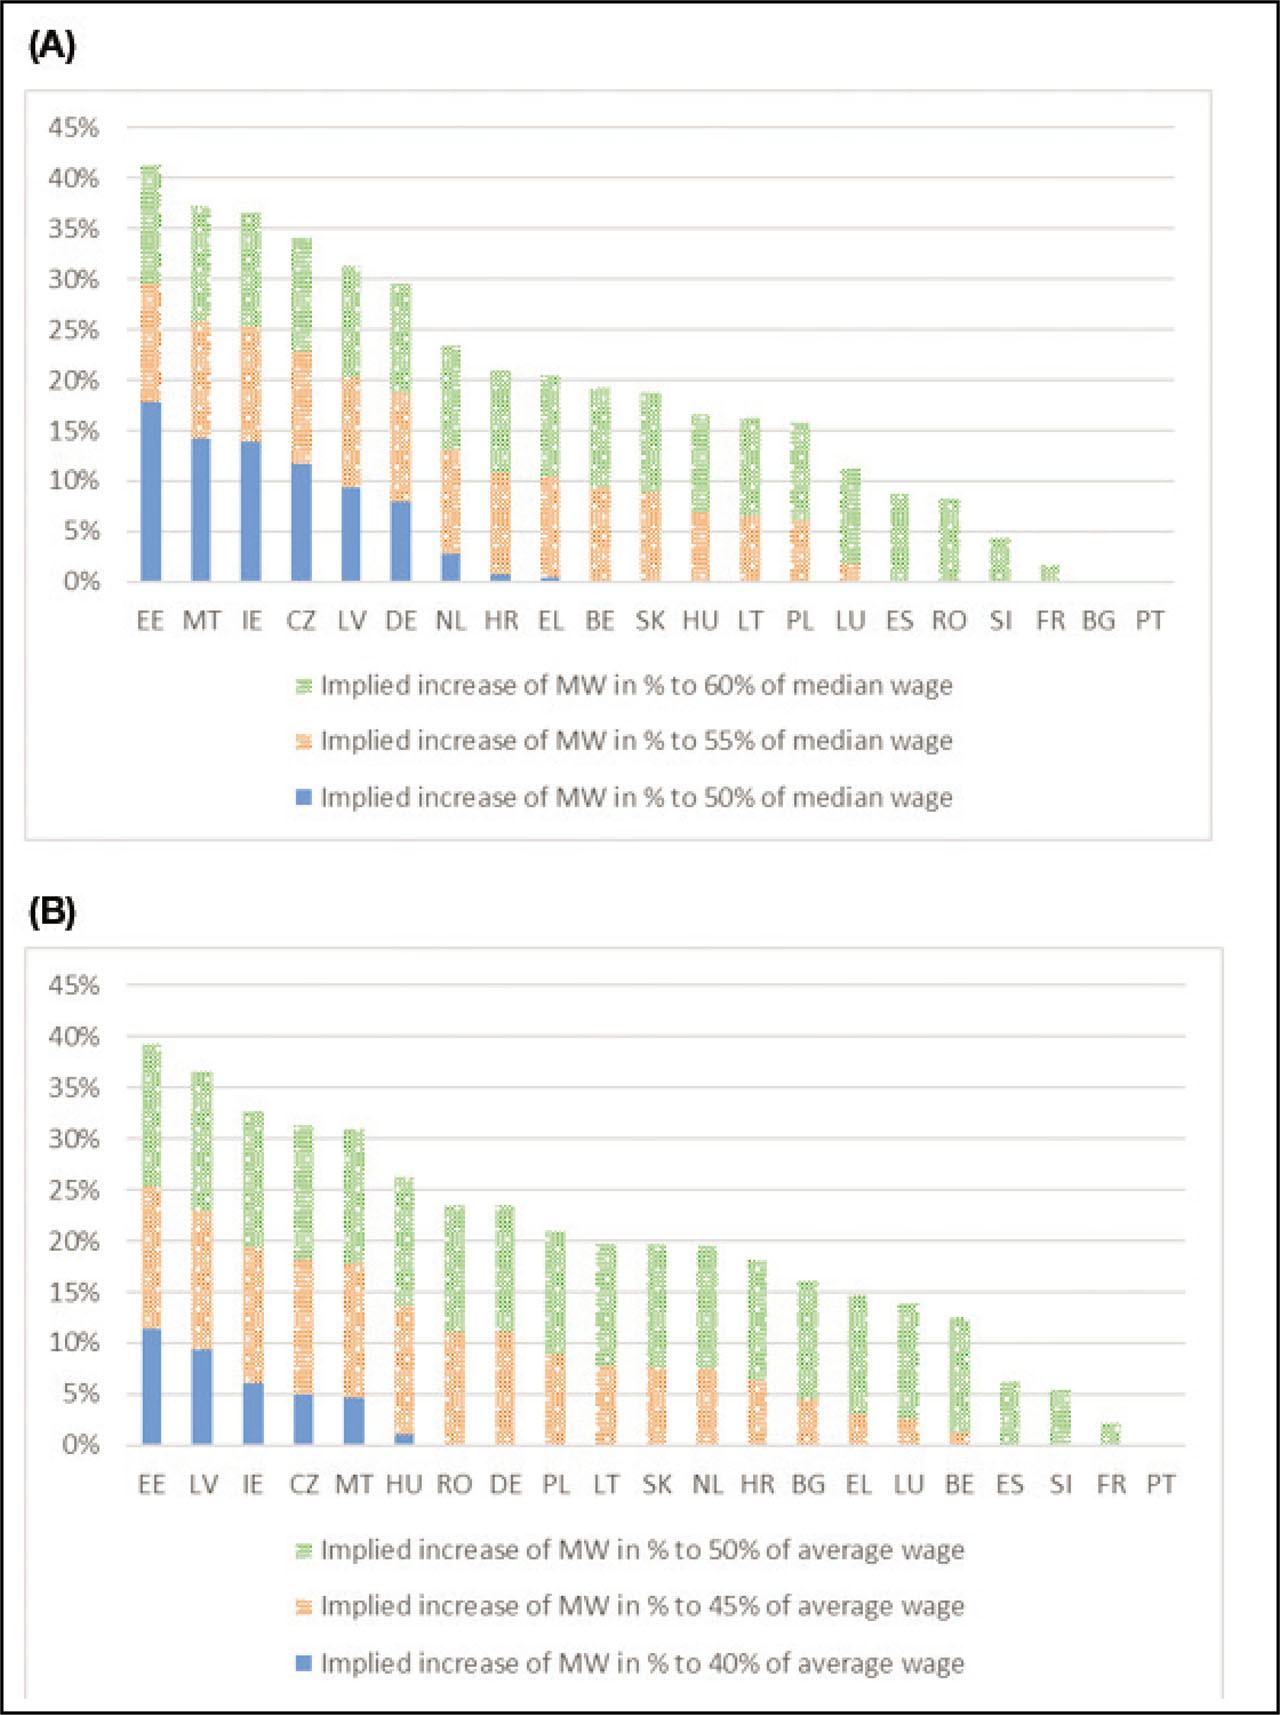
Figure A1
Implied MW increases for various indicative reference values (%).
(A) Scenarios of MWs as a proportion of the median wage. (B) Scenarios of MWs as a proportion of the average wage.
Source: Own calculations based on Eurofound data on monthly MW levels in 2019 (Eurofound, 2019) and Eurostat data on monthly earnings in 2019. BE, Belgium; BG, Bulgaria; CZ, Czech Republic; DE, Germany; EE, Estonia; EL, Greece; ES, Spain; FR, France; HR, Croatia; HU, Hungary; IE, Republic of Ireland; LT, Lithuania; LU, Luxembourg; LV, Latvia; MS, Member States; MT, Malta; MW, minimum wage; NL, The Netherlands; PL, Poland; PT, Portugal; RO, Romania; SI, Slovenia; SK, Slovakia.
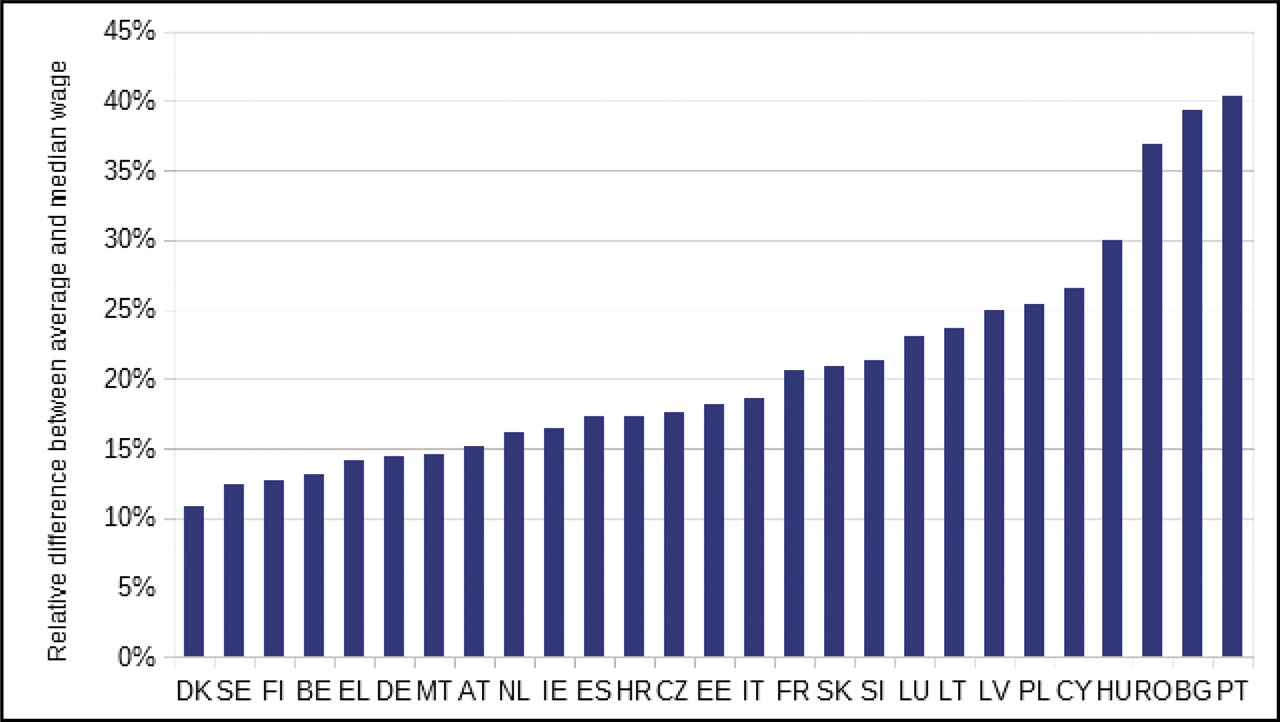
Figure A2
The relative difference between the average and the median wage, 2019.
Source: Eurostat. BE, Belgium; BG, Bulgaria; CZ, Czech Republic; DE, Germany; EE, Estonia; EL, Greece; ES, Spain; FR, France; HR, Croatia; HU, Hungary; IE, Republic of Ireland; LT, Lithuania; LU, Luxembourg; LV, Latvia; MS, Member States; MT, Malta; MW, minimum wage; NL, The Netherlands; PL, Poland; PT, Portugal; RO, Romania; SI, Slovenia; SK, Slovakia.
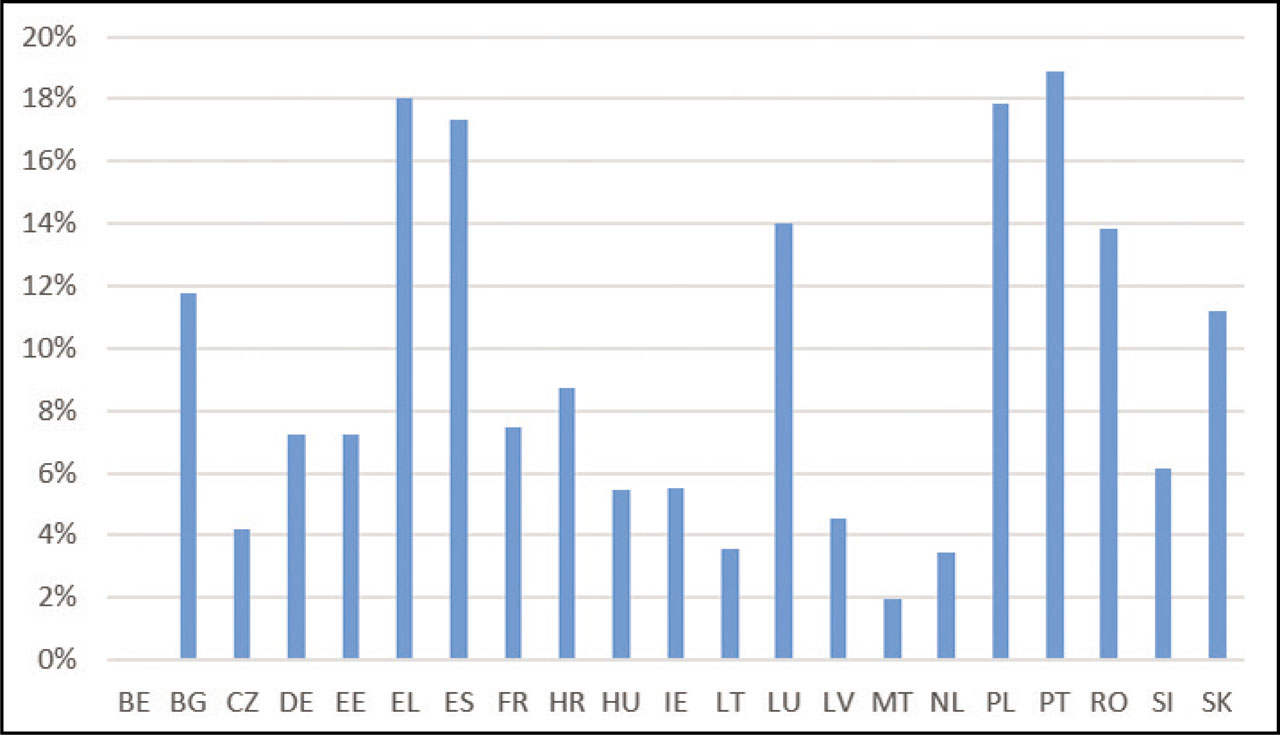
Figure A3
Share of workers earning (a wage close to) the SMW in the baseline scenario.
Notes: EUROMOD simulations for 2019. The graph shows the share of workers earning from 80% to 105% of the MW in the baseline. Countries are sorted alphabetically. BE, Belgium; BG, Bulgaria; CZ, Czech Republic; DE, Germany; EE, Estonia; EL, Greece; ES, Spain; FR, France; HR, Croatia; HU, Hungary; IE, Republic of Ireland; LT, Lithuania; LU, Luxembourg; LV, Latvia; MS, Member States; MT, Malta; MW, minimum wage; NL, The Netherlands; PL, Poland; PT, Portugal; RO, Romania; SI, Slovenia; SK, Slovakia; SMW, statutory MW.
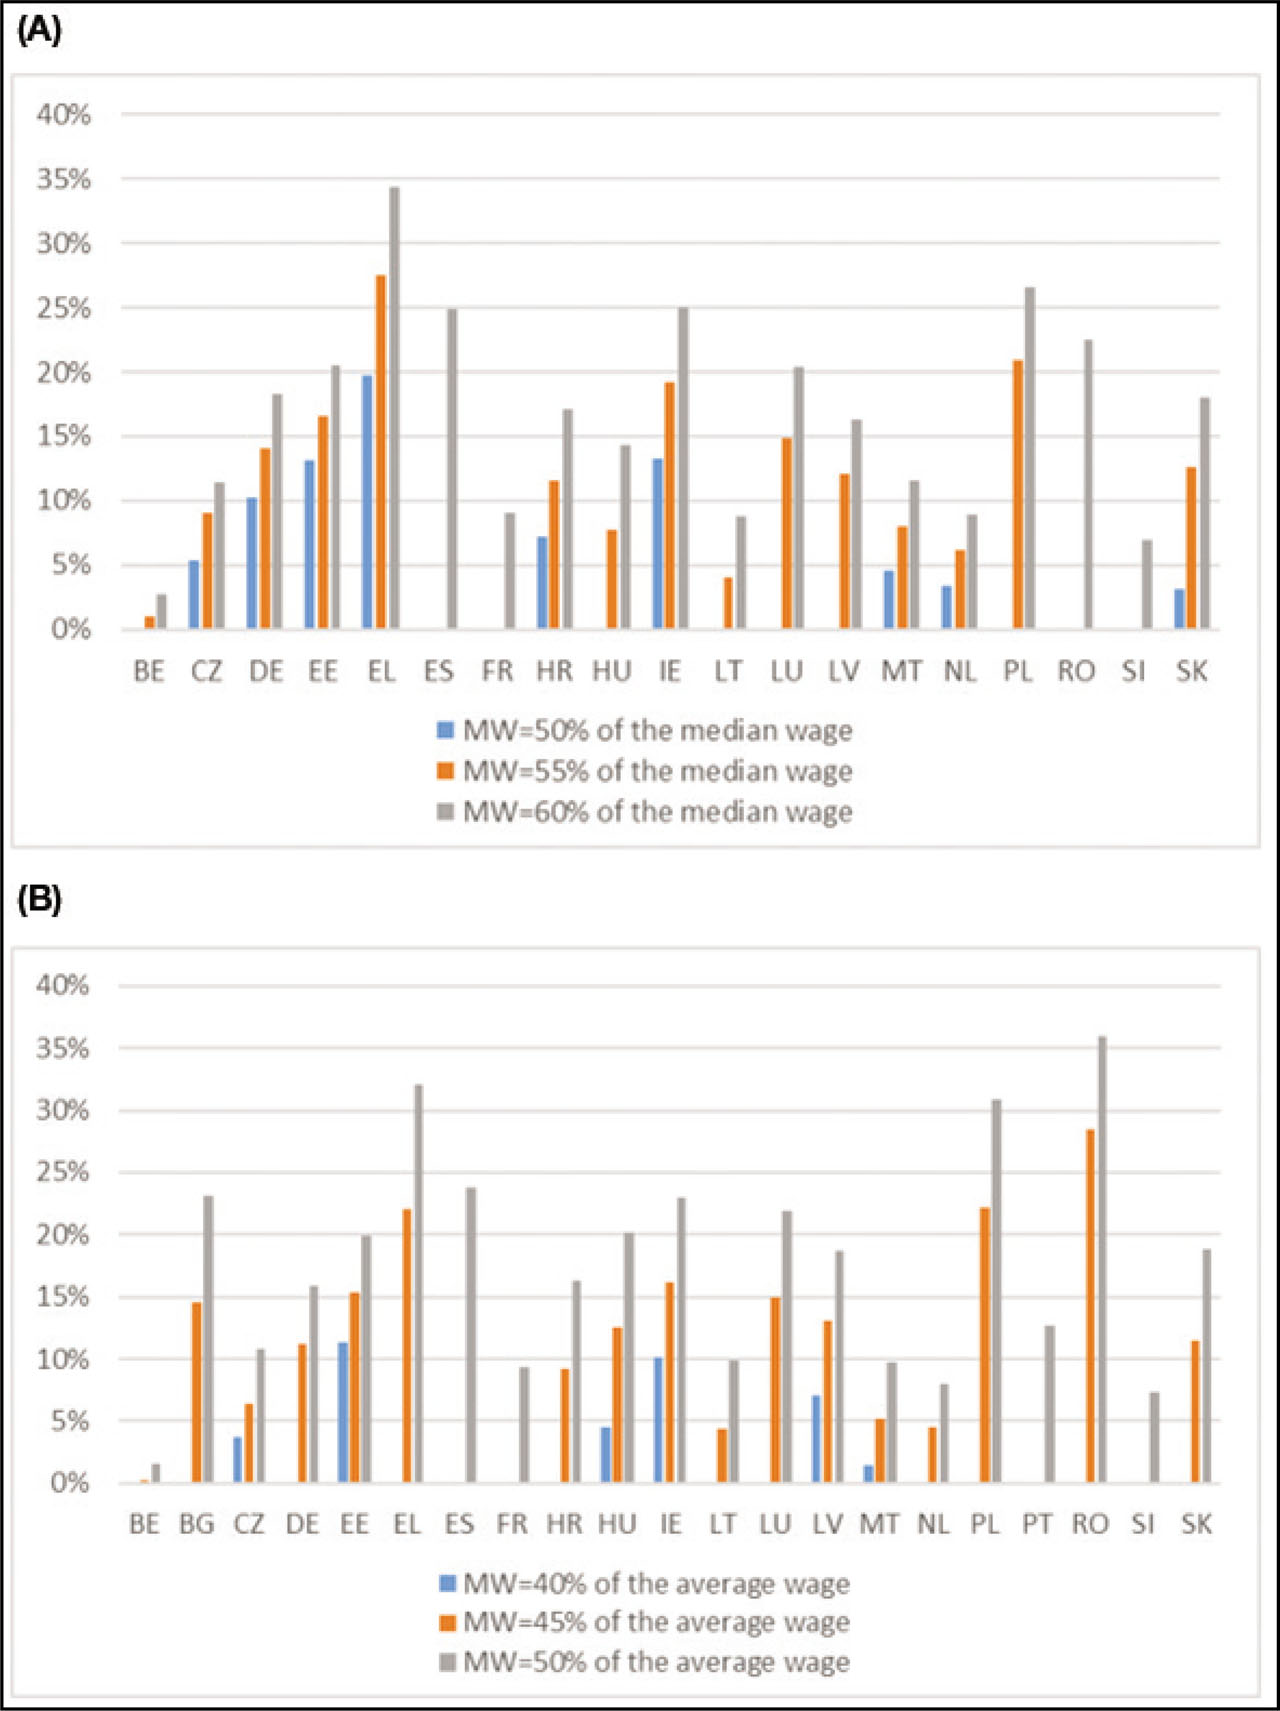
Figure A4
Share of workers affected by increases of the MW.
(A) Scenarios of MWs as proportion of median wages. (B) Scenarios of MWs as proportion of average wages.
Notes: EUROMOD simulations. The baseline scenario reflects MWs in 2019. Countries are sorted alphabetically. Countries with actual MWs above the hypothetical scenarios are excluded. BE, Belgium; BG, Bulgaria; CZ, Czech Republic; DE, Germany; EE, Estonia; EL, Greece; ES, Spain; FR, France; HR, Croatia; HU, Hungary; IE, Republic of Ireland; LT, Lithuania; LU, Luxembourg; LV, Latvia; MS, Member States; MT, Malta; MW, minimum wage; NL, The Netherlands; PL, Poland; PT, Portugal; RO, Romania; SI, Slovenia; SK, Slovakia.
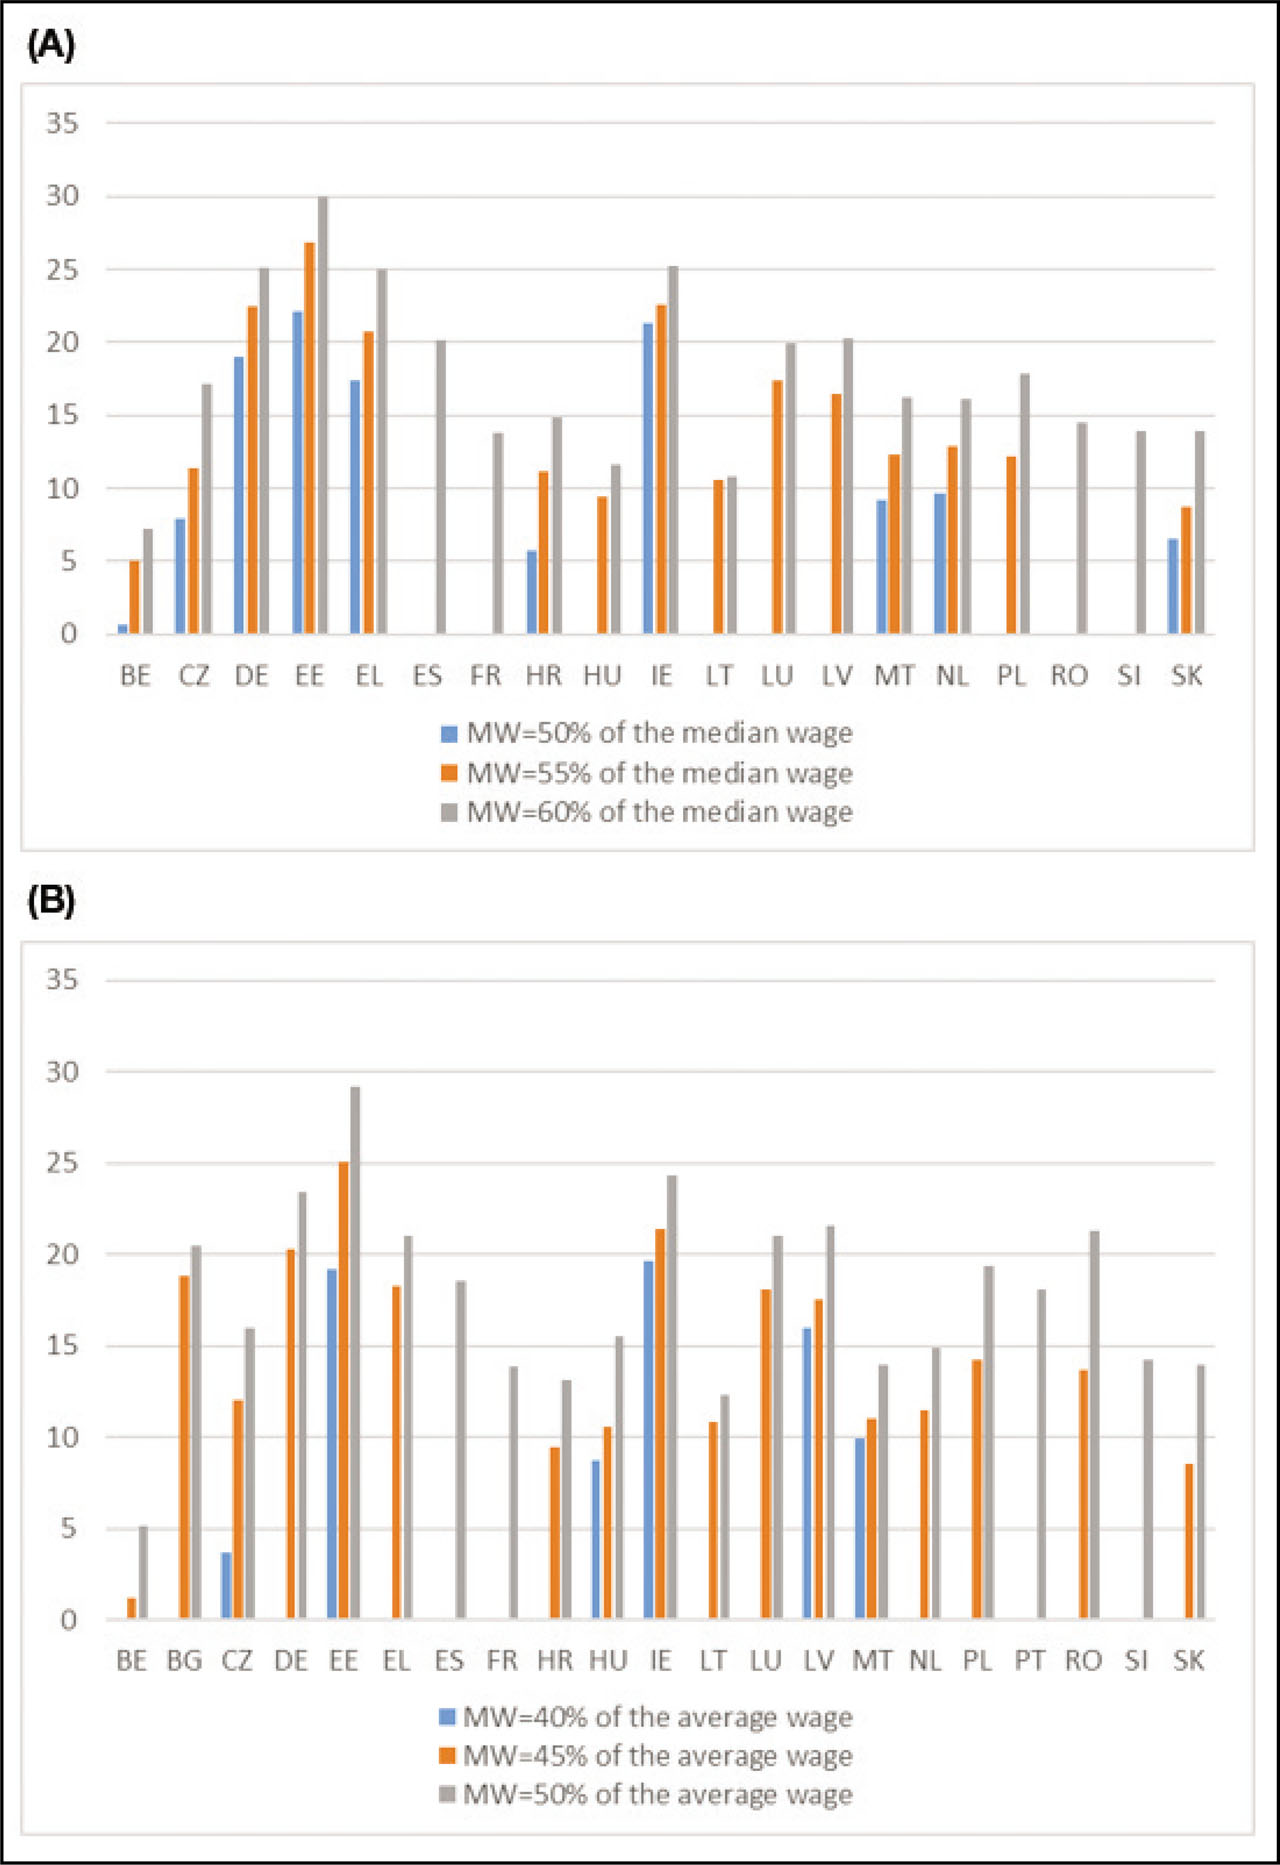
Figure A5
Average increase in the wages of those affected by increases in the MW (%).
(A) Scenarios of MWs as a proportion of the median wage. (B) Scenarios of MWs as a proportion of the average wage.
Notes: EUROMOD simulations. The baseline scenario reflects MWs in 2019. Countries are sorted alphabetically. Countries with actual MWs above the hypothetical scenarios are excluded. BE, Belgium; BG, Bulgaria; CZ, Czech Republic; DE, Germany; EE, Estonia; EL, Greece; ES, Spain; FR, France; HR, Croatia; HU, Hungary; IE, Republic of Ireland; LT, Lithuania; LU, Luxembourg; LV, Latvia; MS, Member States; MT, Malta; MW, minimum wage; NL, The Netherlands; PL, Poland; PT, Portugal; RO, Romania; SI, Slovenia; SK, Slovakia.
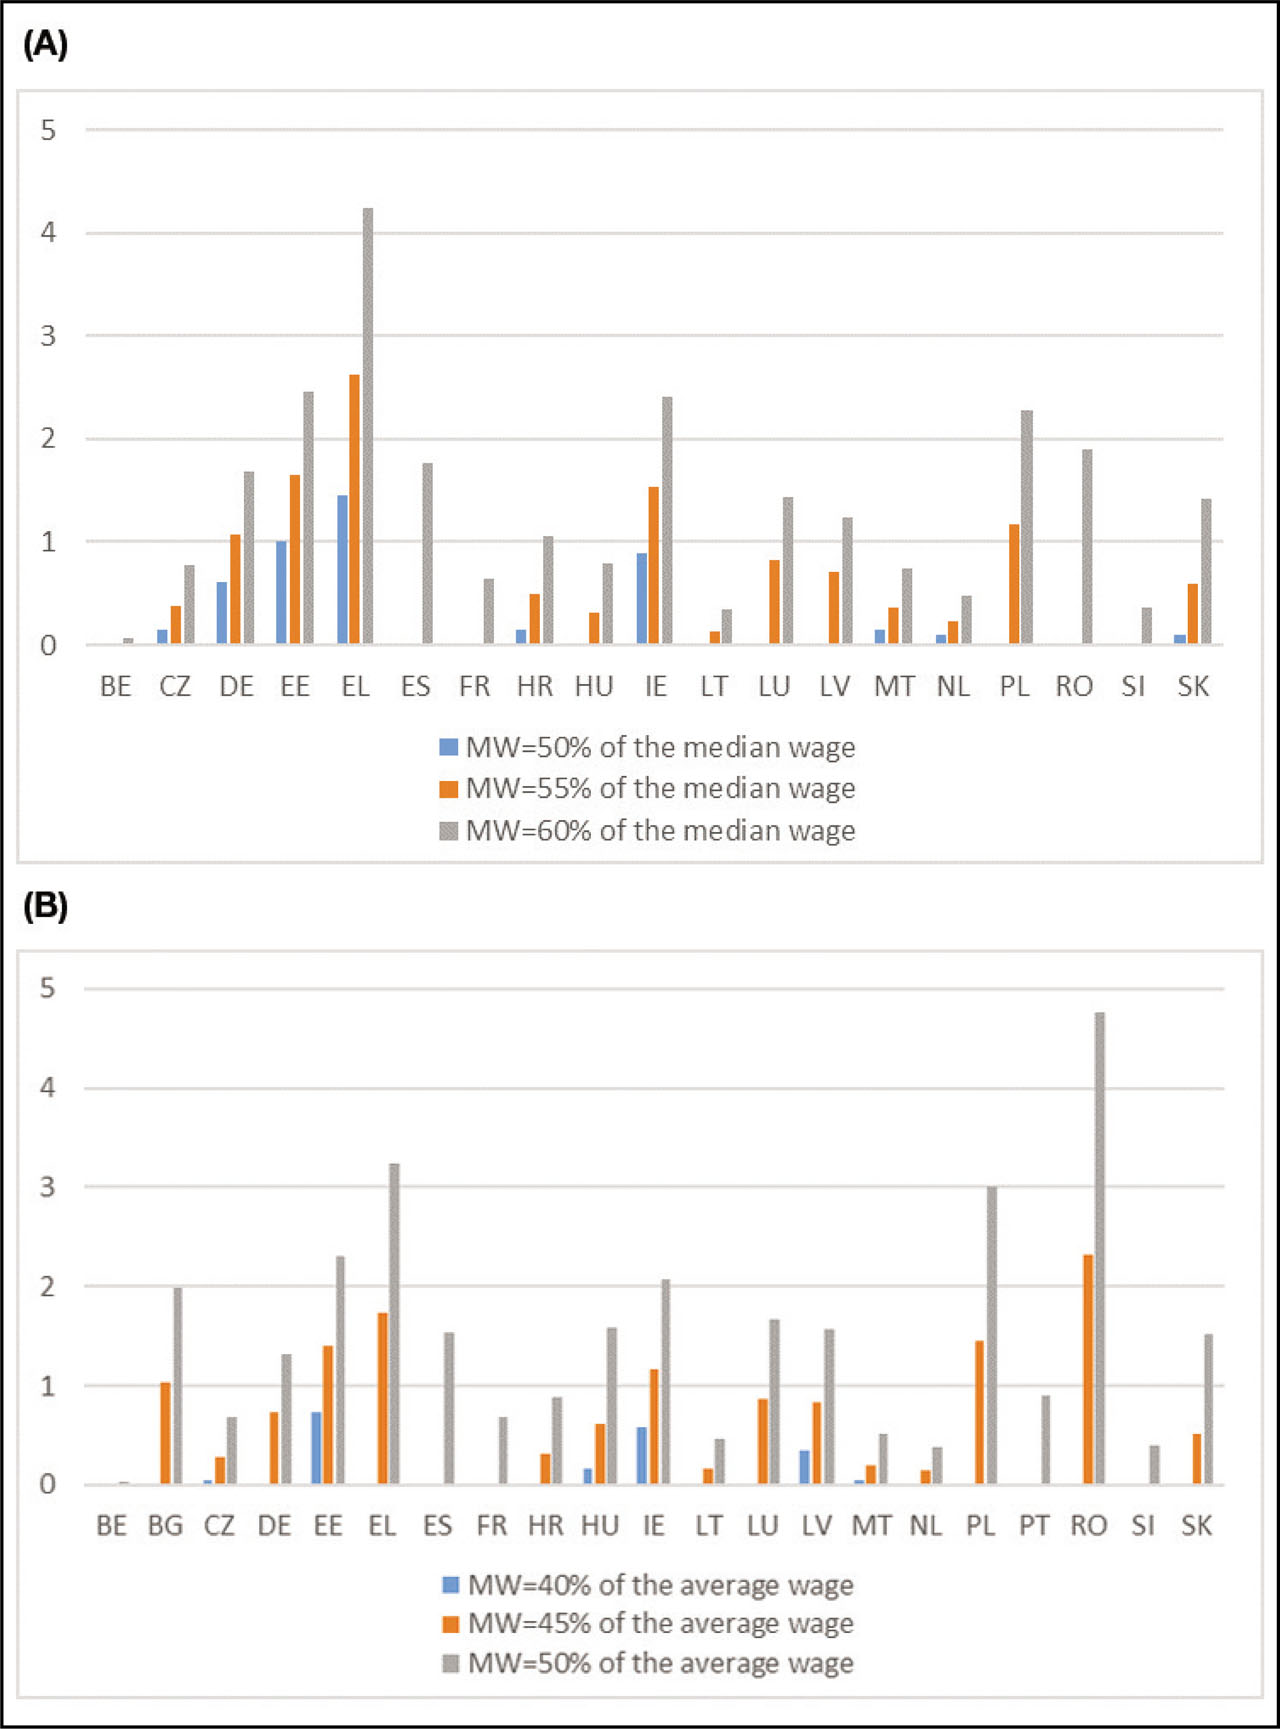
Figure A6
Change in the total wage bill as a result of changes in the MWs (%).
(A) Scenarios of MWs as a proportion of the median wage. (B) Scenarios of MWs as a proportion of the average wage.
Notes: EUROMOD simulations. The baseline scenario reflects MWs in 2019. Countries are sorted alphabetically. Countries with actual MWs above the hypothetical scenarios are excluded. BE, Belgium; BG, Bulgaria; CZ, Czech Republic; DE, Germany; EE, Estonia; EL, Greece; ES, Spain; FR, France; HR, Croatia; HU, Hungary; IE, Republic of Ireland; LT, Lithuania; LU, Luxembourg; LV, Latvia; MS, Member States; MT, Malta; MW, minimum wage; NL, The Netherlands; PL, Poland; PT, Portugal; RO, Romania; SI, Slovenia; SK, Slovakia.
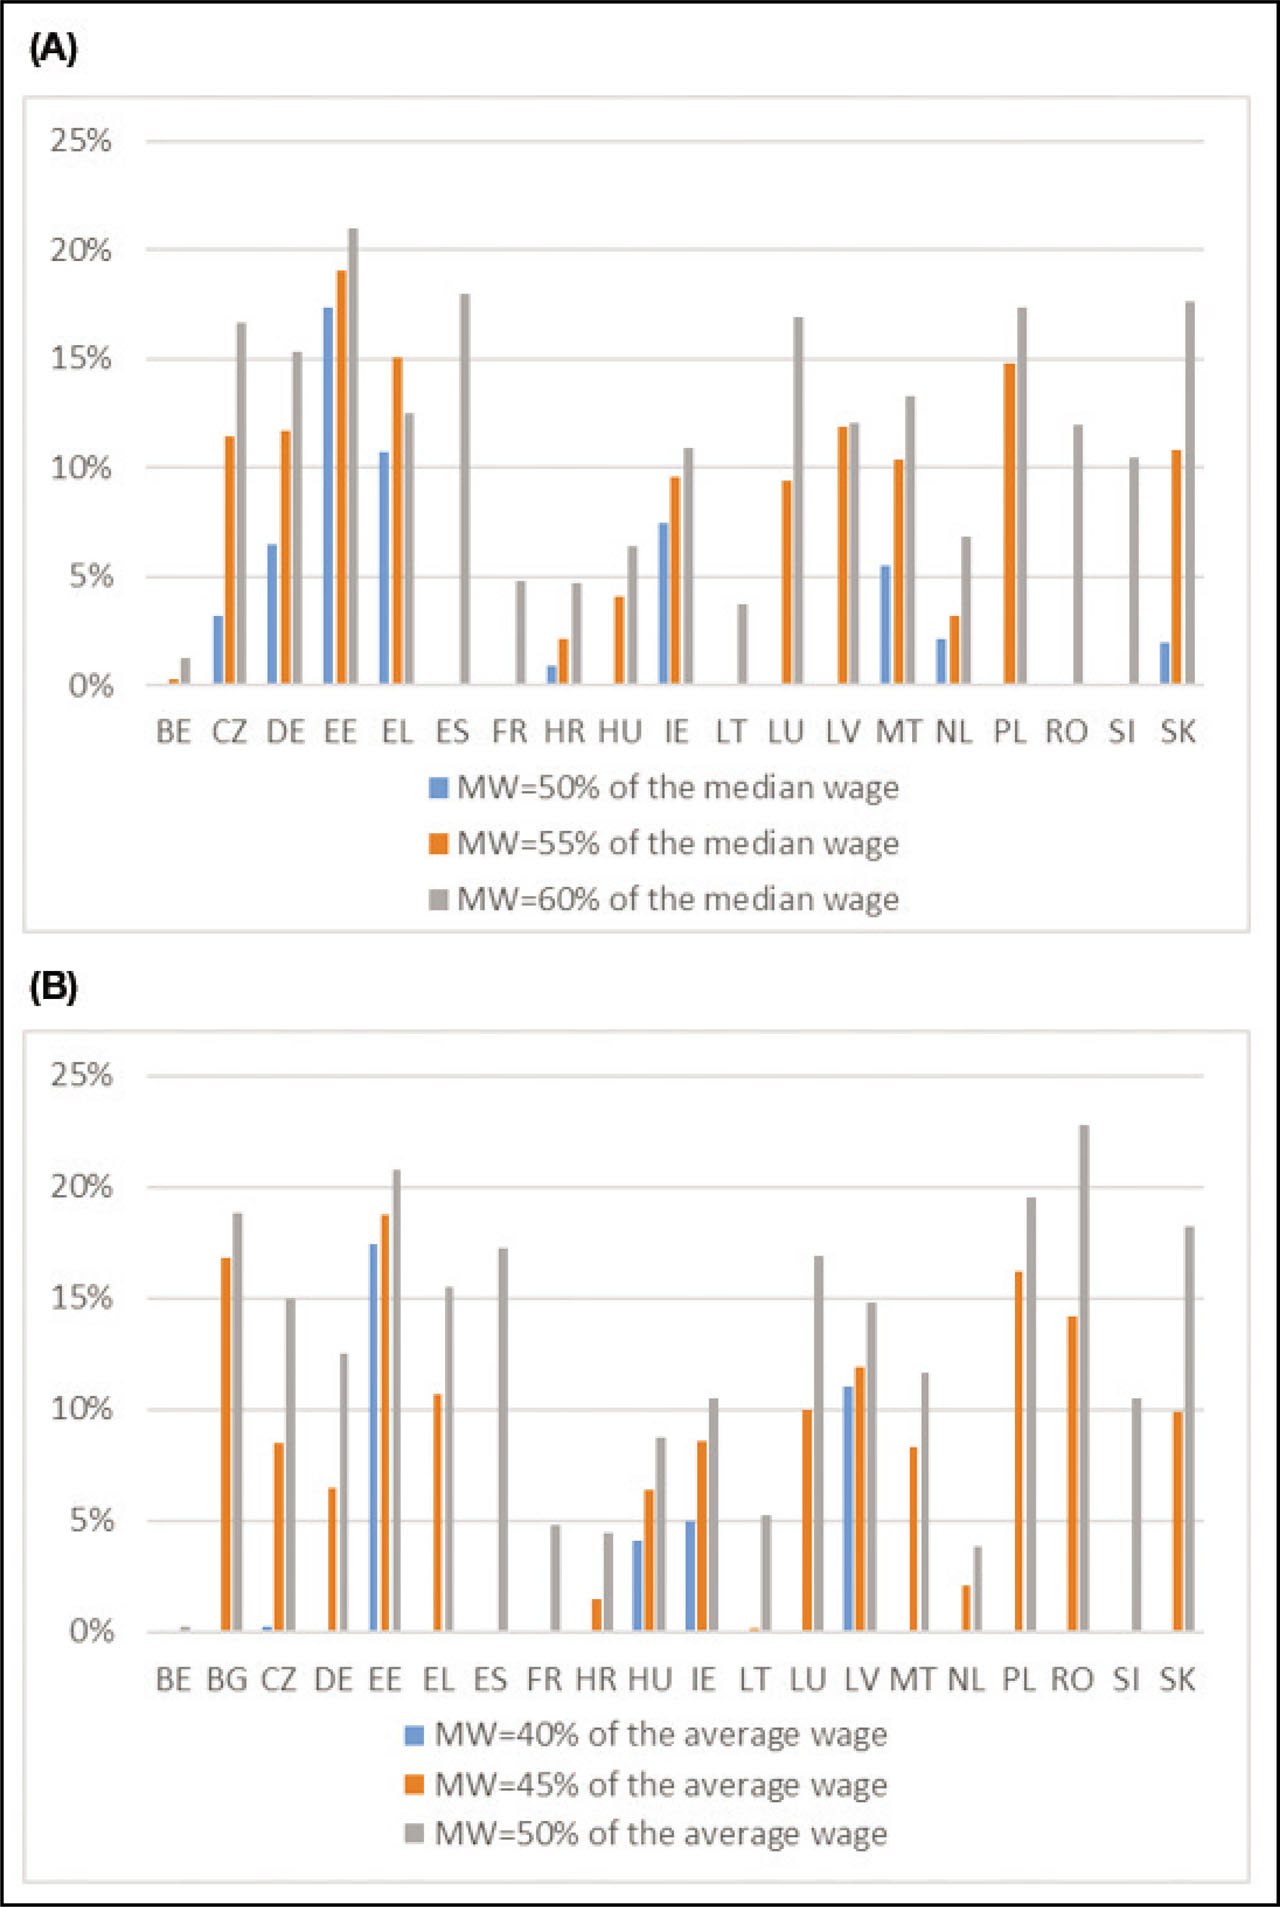
Figure A7
Reduction in wage inequality in simulated HMW scenarios, D5/D1 indicator.
(A) Scenarios of MWs as a proportion of the median wage. (B) Scenarios of MWs as a proportion of the average wage.
Notes: EUROMOD simulations. The baseline scenario reflects MWs in 2019. Countries are sorted alphabetically. Countries with actual MWs above the hypothetical scenarios are excluded. The D5/D1 indicator is obtained by comparing the median (D5) divided by the first decile (D1) of the earnings distribution. BE, Belgium; BG, Bulgaria; CZ, Czech Republic; DE, Germany; EE, Estonia; EL, Greece; ES, Spain; FR, France; HMW, hypothetical MW; HR, Croatia; HU, Hungary; IE, Republic of Ireland; LT, Lithuania; LU, Luxembourg; LV, Latvia; MS, Member States; MT, Malta; MW, minimum wage; NL, The Netherlands; PL, Poland; PT, Portugal; RO, Romania; SI, Slovenia; SK, Slovakia.
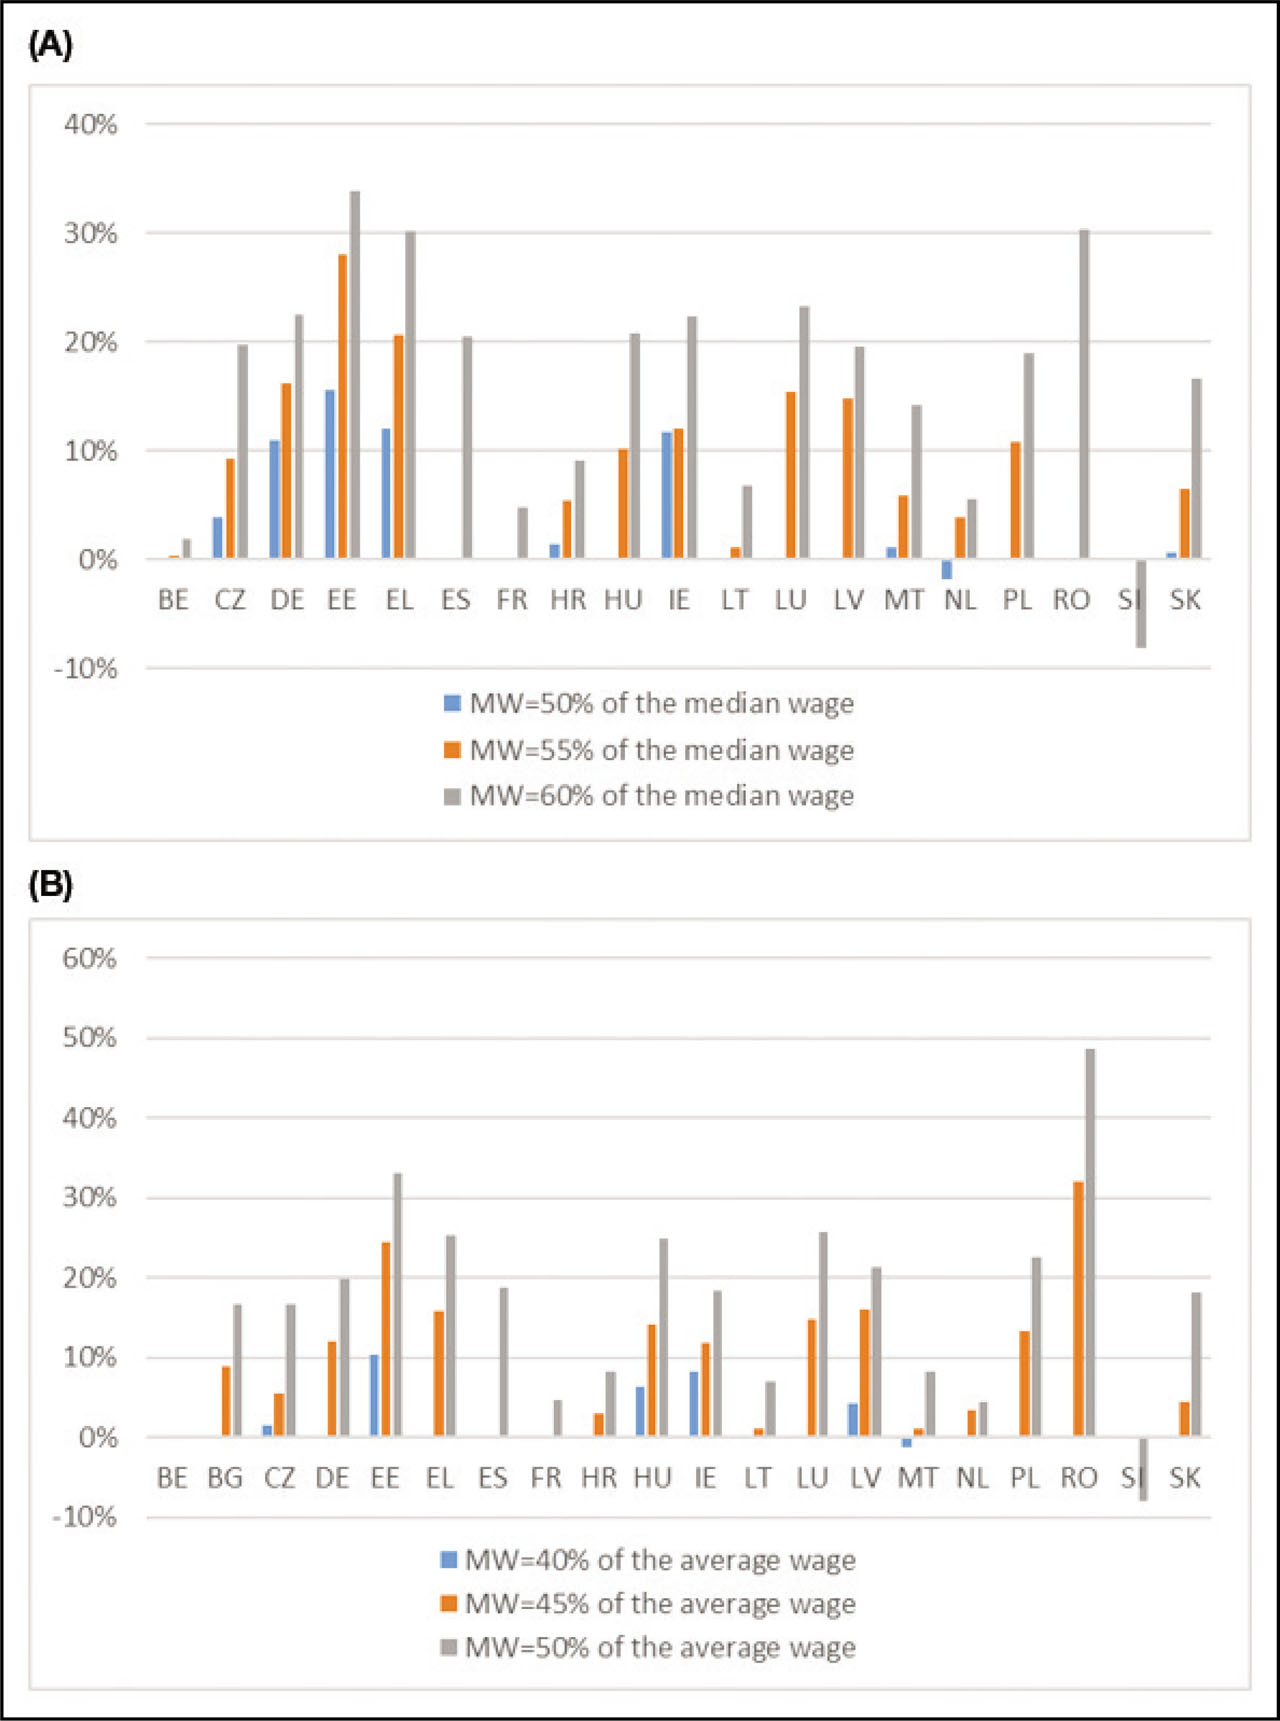
Figure A8
Reduction in in-work poverty in simulated HMW scenarios.
(A) Scenarios of MWs as a proportion of the median wage. (B) Scenarios of MWs as a proportion of the average wage.
Notes: EUROMOD simulations. The baseline scenario reflects MWs in 2019. Countries are sorted alphabetically. Countries with actual MWs above the hypothetical scenarios are excluded. BE, Belgium; BG, Bulgaria; CZ, Czech Republic; DE, Germany; EE, Estonia; EL, Greece; ES, Spain; FR, France; HMW, hypothetical MW; HR, Croatia; HU, Hungary; IE, Republic of Ireland; LT, Lithuania; LU, Luxembourg; LV, Latvia; MS, Member States; MT, Malta; MW, minimum wage; NL, The Netherlands; PL, Poland; PT, Portugal; RO, Romania; SI, Slovenia; SK, Slovakia.
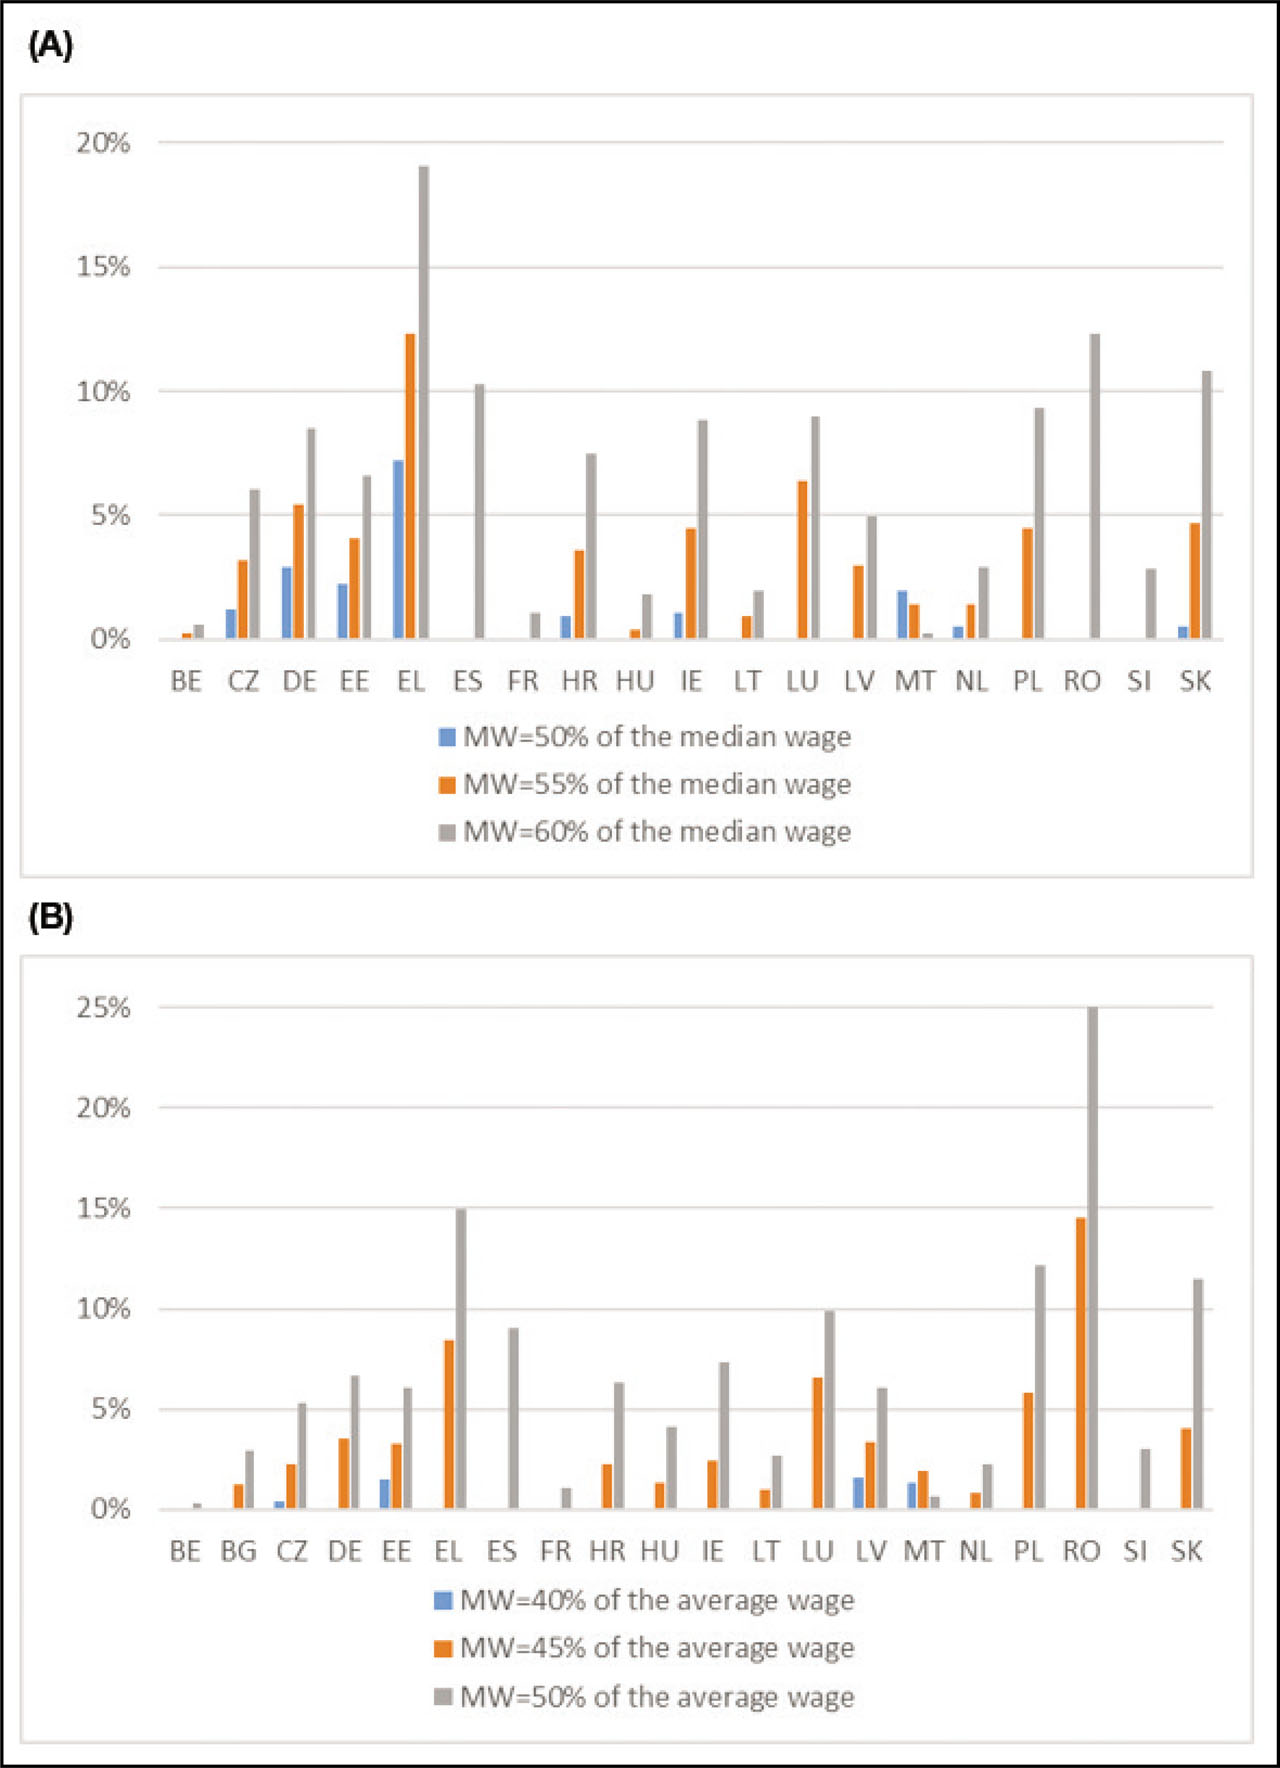
Figure A9
Reduction in the gender pay gap in simulated HMW scenarios.
(A) Scenarios of MW as a proportion of the median wage. (B) Scenarios of MW as a proportion of the average wage.
Notes: EUROMOD simulations. The baseline scenario reflects MW in 2019. Countries are sorted alphabetically. Countries with actual MW above the hypothetical scenarios are excluded. The gender pay gap is the difference between average gross hourly wages of male and female employees as a percentage of male wages, unadjusted for individual characteristics. BE, Belgium; BG, Bulgaria; CZ, Czech Republic; DE, Germany; EE, Estonia; EL, Greece; ES, Spain; FR, France; HMW, hypothetical MW; HR, Croatia; HU, Hungary; IE, Republic of Ireland; LT, Lithuania; LU, Luxembourg; LV, Latvia; MS, Member States; MT, Malta; MW, minimum wage; NL, The Netherlands; PL, Poland; PT, Portugal; RO, Romania; SI, Slovenia; SK, Slovakia.
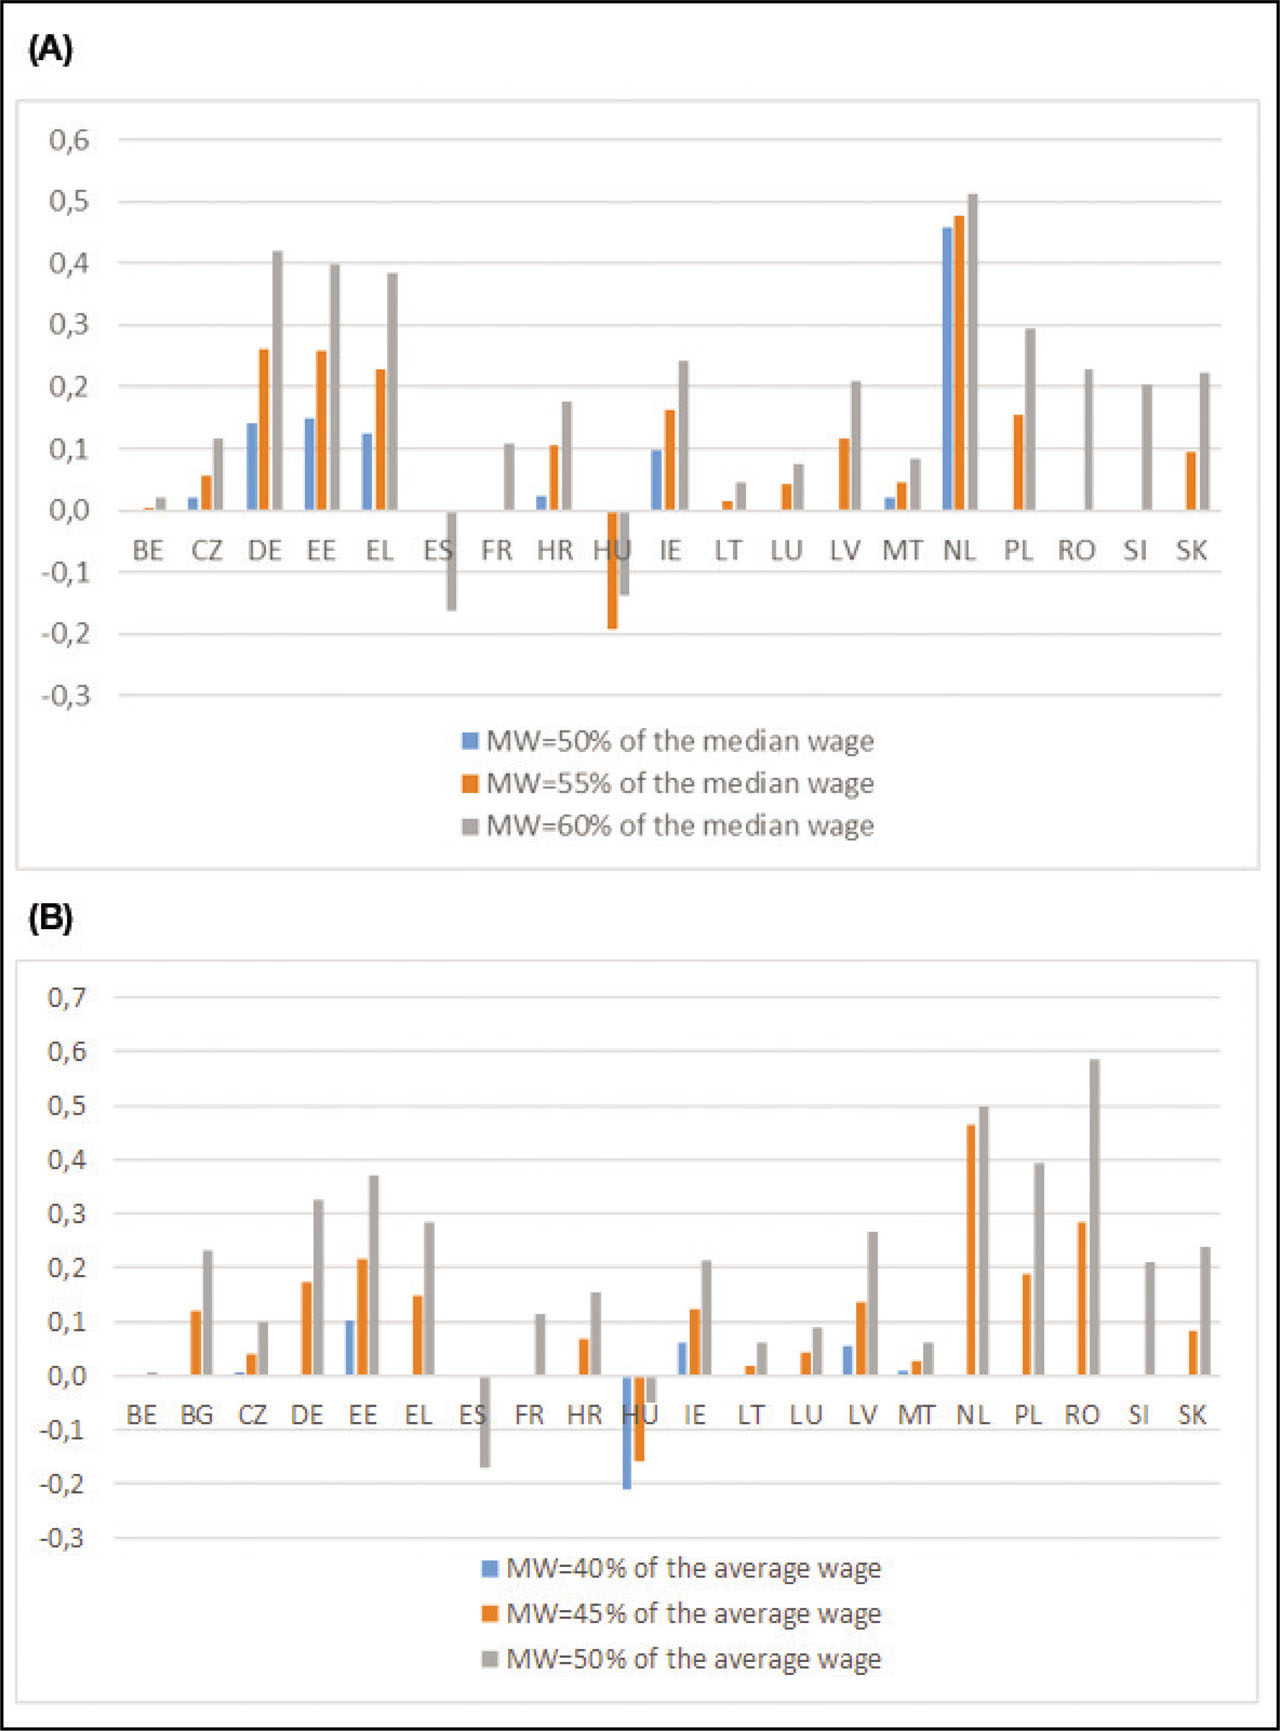
Figure A10
Impact on public budgets (change in fiscal balance as a percentage of GDP).
(A) Changes in fiscal balance when MWs are set as a proportion of the median wage. (B) Changes in fiscal balance when MWs are set as a proportion of the average wage.
Notes: EUROMOD simulations. Positive numbers reflect improvements in the public fiscal balance. Countries are sorted alphabetically. Countries with MWs above 60% of the median wage are excluded. BE, Belgium; BG, Bulgaria; CZ, Czech Republic; DE, Germany; EE, Estonia; EL, GDP, gross domestic product; Greece; ES, Spain; FR, France; HR, Croatia; HU, Hungary; IE, Republic of Ireland; LT, Lithuania; LU, Luxembourg; LV, Latvia; MS, Member States; MT, Malta; MW, minimum wage; NL, The Netherlands; PL, Poland; PT, Portugal; RO, Romania; SI, Slovenia; SK, Slovakia.
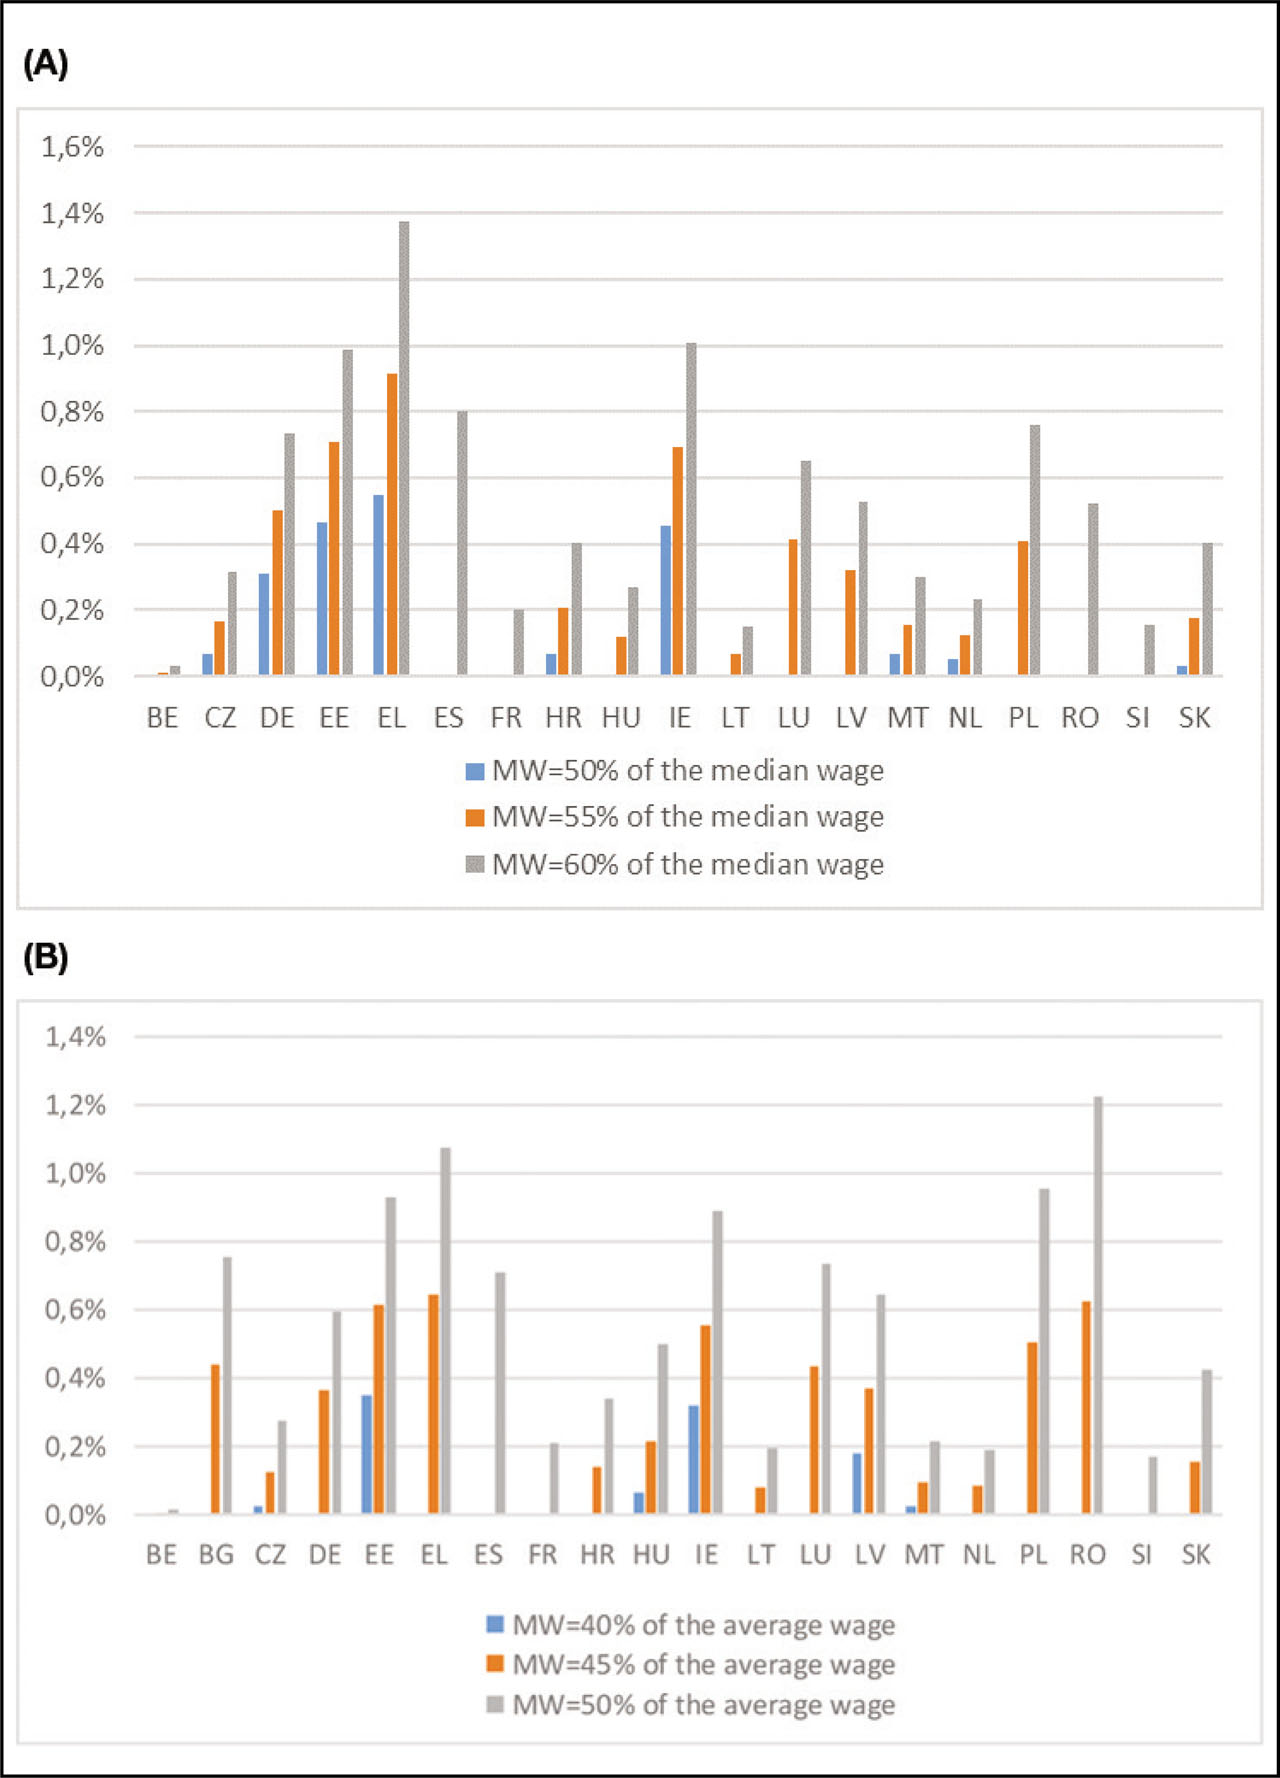
Figure A11
Estimation of possible negative employment effects in simulated HMW scenarios.
(A) Scenarios of MWs as a proportion of the median wage. (B) Scenarios of MWs as a proportion of the average wage.
Notes: EUROMOD simulations. The baseline scenario reflects MWs in 2019. Countries are sorted alphabetically. Countries with actual MWs above the hypothetical scenarios are excluded. BE, Belgium; BG, Bulgaria; CZ, Czech Republic; DE, Germany; EE, Estonia; EL, Greece; ES, Spain; FR, France; HMW, hypothetical MW; HR, Croatia; HU, Hungary; IE, Republic of Ireland; LT, Lithuania; LU, Luxembourg; LV, Latvia; MS, Member States; MT, Malta; MW, minimum wage; NL, The Netherlands; PL, Poland; PT, Portugal; RO, Romania; SI, Slovenia; SK, Slovakia.
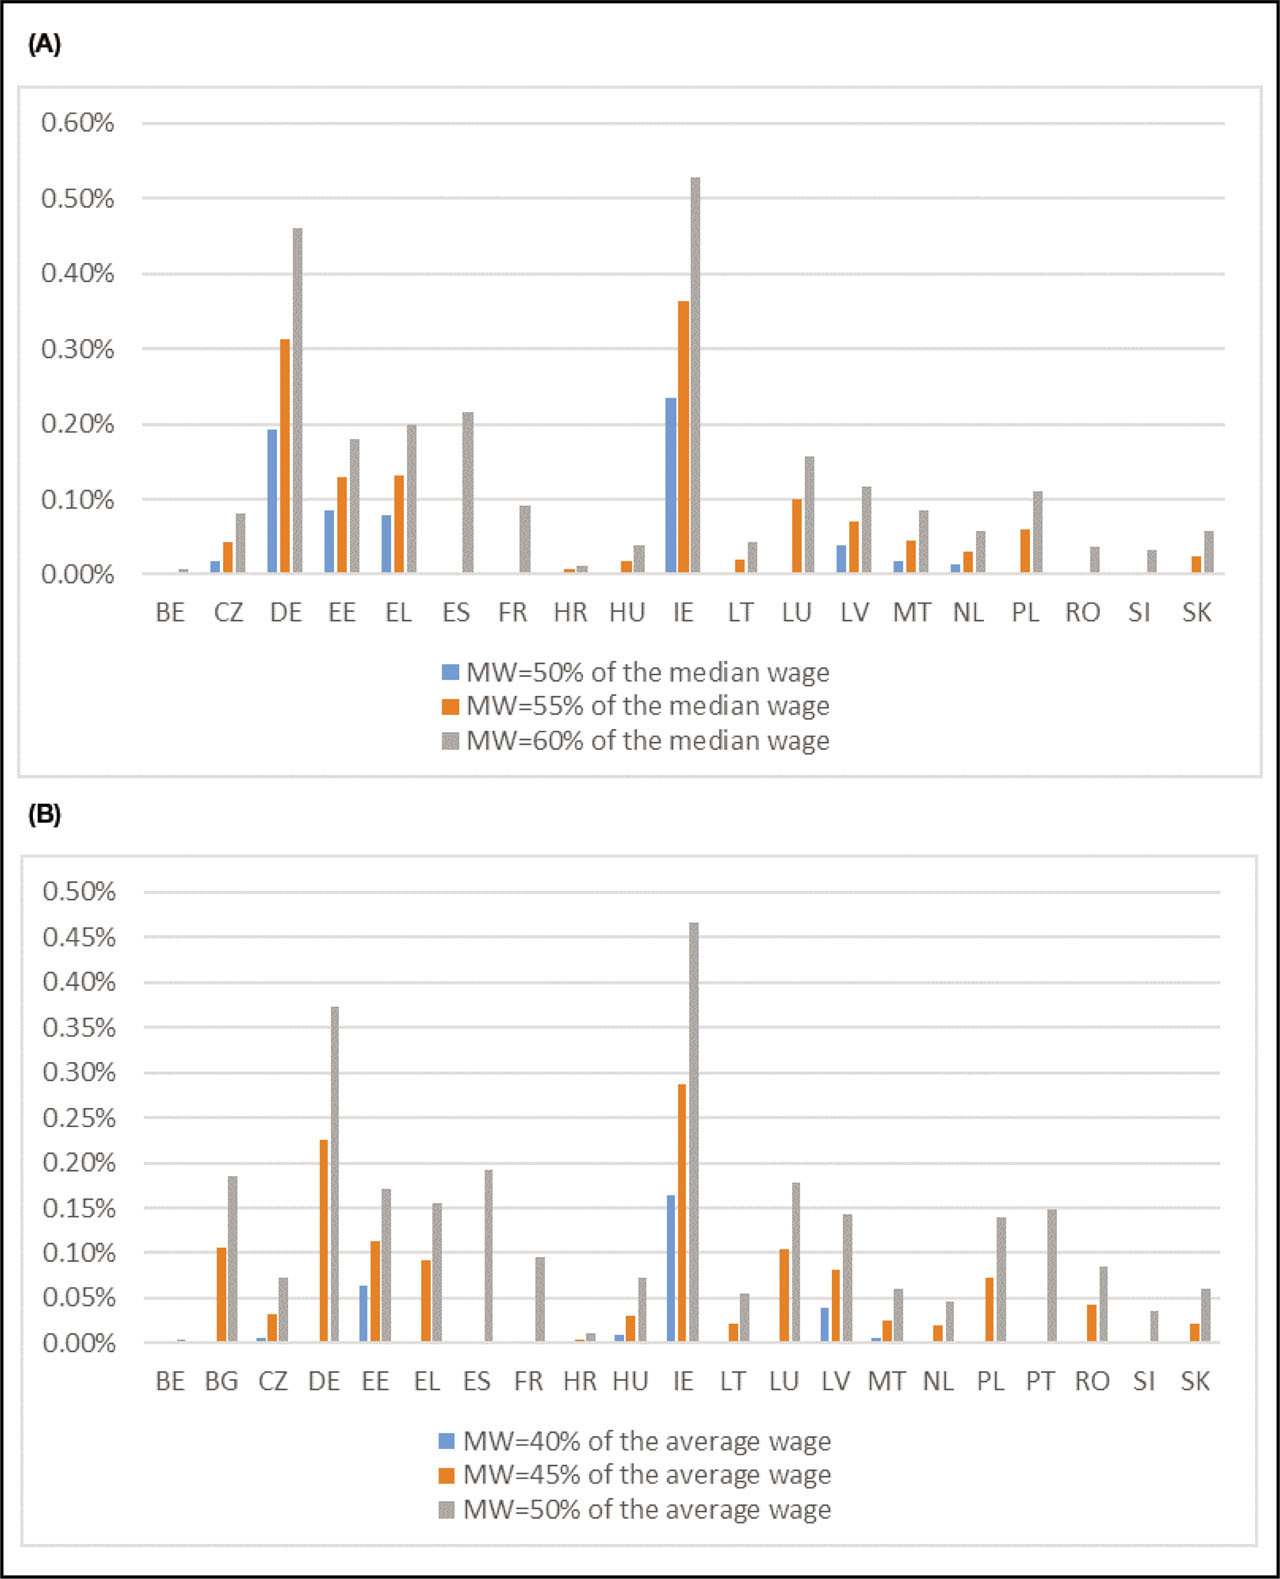
Figure A12
Estimation of possible positive labor supply effects in simulated HMW scenarios (%).
(A) Scenarios of MWs as a proportion of the median wage. (B) Scenarios of MWs as a proportion of the average wage.
Notes: EUROMOD simulations using EUROLAB. The baseline scenario reflects MWs in 2019. Countries are sorted alphabetically. Countries with actual MWs above the hypothetical scenarios are excluded. BE, Belgium; BG, Bulgaria; CZ, Czech Republic; DE, Germany; EE, Estonia; EL, Greece; ES, Spain; FR, France; HMW, hypothetical MW; HR, Croatia; HU, Hungary; IE, Republic of Ireland; LT, Lithuania; LU, Luxembourg; LV, Latvia; MS, Member States; MT, Malta; MW, minimum wage; NL, The Netherlands; PL, Poland; PT, Portugal; RO, Romania; SI, Slovenia; SK, Slovakia.
Appendix B
Data and Methodology
B.1. Source of median and average wage statistics
Median and average wages used in this analysis have been provided by Eurostat. Eurostat calculates both the average and the median wage based on earnings surveys. In particular, the latest available wave of the Structure of Earnings Survey (SES, referring to 2014 earnings) has been used to extrapolate median and average wages in 2019. The derived medians and means have been extrapolated using the wage component of the labor cost index (LCI) data, published in the dataset ‘lc_lci_r2_a’ of Eurobase. The final ratios have been calculated as the monthly gross minimum wage (MW) in force on July 1, 2019 divided by the median/mean monthly earnings estimated for the reference year 2019.
The basis of the calculations are monthly gross earnings in national currency. These include non-regular revenues such as bonuses and overtime. The corresponding figures are published in the dataset ‘earn_ses_monthly’ of Eurobase.
The indicators shown in this impact assessment are based on the earnings of full-time workers, similarly to the definition used by the OECD.
B.2. Calculation of hourly earnings and hourly MWs
To simulate the impacts of a HMW, the individuals who earn a lower wage than the HMW need to be identified in the data. To do this, the actual wage observed in the data needs to be compared to the HMW. The comparison can be done based on the hourly or the monthly wage. In order to better account for various working patterns and different levels of working hours, this paper applies HMWs to hourly wages. Hence, we have to convert both the wages observed in the microdata (expressed in yearly terms) and the HMW levels (expressed in monthly terms) to hourly levels. To convert the HMW from monthly to hourly levels, we divide HMW by the average number of weeks in a calendar month (4.345 weeks) and the observed median hours worked by full-time workers (which differ by country; see Table B1 in Appendix).28 To obtain the gross hourly wage of an individual in the data, the reported yearly gross employment income is divided by the number of months the individual worked in 2016, the number of weeks in an average calendar month, and the number of usual weekly working hours.
Table B1
Median number of hours worked by full-time employees
| Country | Median working hours |
|---|---|
| BE | 38 |
| FR | 38 |
| IE | 39 |
| All other 18 EU Member States with SMWs | 40 |
[i] Note: People working >30 h/week are defined as full-time employees.
[ii] Source: EUROMOD input data based on EU-SILC 2017.
[iii] BE, Belgium; EU, European Union; EU-SILC, European Statistics on Income and Living Conditions; FR, France; IE, Republic of Ireland; SMWs, statutory MWs.
The calculation of hourly wages faces three main challenges when using the European Statistics on Income and Living Conditions (EU-SILC) data and EUROMOD. These difficulties are related to: (1) the time mismatch in reporting of working time and earnings in EU-SILC data, (2) the measurement error in reported working hours, months of work, or annual earnings, and (3) the discrepancy in growth rates of average wages and SMWs. In Appendix, Sections B.3 to B.5, we describe the nature of each shortcoming and its implication for our analysis. Additionally, we outline the methodology used to mitigate the impact of each shortcoming for our analysis.
B.3. Imputation of missing weekly working hours
EU-SILC data have the shortcoming that earnings and working hours, which are both needed to calculate the hourly wage, refer to different time periods. More specifically, information on earnings (as well as months worked) refer to the year previous to the survey, while the reference period of weekly working hours is the time of the interview.29 Accordingly, in the data used for this analysis (i.e., in the EU-SILC 2017), information on income and months worked per year refer to 2016, while the information on usual weekly working hours refers to the survey year 2017.30 This time mismatch can lead to missing information, particularly for individuals who worked in 2016 but not in 2017. They may report a positive income earned through a certain number of months during 2016, but they cannot reveal any information on weekly working hours recorded at the time of the interview in 2017. In order to keep these individuals in the analysis, we need to impute the number of usual hours worked in 2016.
The missing information on working hours is imputed based on information on months in employment. EU-SILC provides information on the number of months in part-time employment (variable PL074) and the number of months in full-time employment (variable PL073). Following the method proposed by Brandolini et al. (2010), we impute working hours based on gender-specific median hours of part-time and full-time workers, respectively.
In particular, the method of imputation of working hours uses information from the EU-SILC on gender-specific median hours and workers’ history of full-time and part-time employment to assign a value of working hours to employees without reported values. In particular, the formula of adjusted working hours of an individual i is the following:
where WHi refers to weekly working hours; Mediangi (HPT) and Mediangi (HFT) refer to the median weekly working hours of workers who declare themselves as part-time and full-time workers, respectively; the index gi refers to the gender of individual i, indicating that the medians are calculated for men and women separately, and the medians of part-time and full-time working hours are therefore country-gender specific; MPTi and MFTi refer to individual i's number of months in part-time and full-time employment (in the income year 2016); and Mi refers to the total number of months in employment of both part-time and full-time work. To give an example: let us assume that in a certain country the median full-time working hours of men is 40 and the median part-time working hours of men is 20. Under such a situation, if a male individual reported to have worked part-time for 6 months and full-time for 6 months, he would be assigned 30 weekly working hours.31The advantage of this approach is that it uses the information on months worked full-time and part-time in the income year, rather than relying on information in the survey year. Furthermore, we are able to derive hourly wages of individuals who changed their activity status from being employed in 2016 to unemployed or inactive in 2017. Since individuals in unstable employment are more likely to earn relatively low wages, potential beneficiaries of MW policies are likely to be overrepresented among them. Hence, the imputation method allows us to include in the analysis individuals who are likely to be the beneficiaries by MW policies. The approach has, however, a shortcoming as the imputation of hours can produce a bias in countries where atypical employment (e.g., Minijobs in Germany) is very common, therefore leaving no space for working hour agreements outside the standard working hour schedule.
B.4. Outlier detection and correction
The time mismatch between the information on earnings and months worked on the one hand, and usual working hours on the other hand, may cause a measurement error in calculating hourly wages if individuals change the number of working hours from one year to the other. Furthermore, earning data comprise all types of labor income and do not distinguish between main jobs and second jobs or between formal versus informal employment. Another limitation may come from survey non-response bias or self-reporting errors (Angel et al., 2019). All of these factors can introduce errors in the calculation of hourly wages, which is our main variable of interest.
In general, the presence of measurement error in hourly wages increases the variance of the wage distribution and therefore the incidence of low wages. This may lead to an overestimation of the effects of HMW increases. Figure B1 illustrates the potential impact of measurement error of wages on our impact assessment. It shows two wage distributions: the “true” distribution of hourly wages and the distribution with measurement errors. The measurement error increases the variance of the distribution and leads to wider tails.32 The vertical line indicates the level of the hourly HMW. The area on the left of the vertical line defines the share of HMW receivers. As shown in Figure B1, this share is higher in the case of the distribution with a measurement error, where the red area indicates the amount of overestimation of MW receivers due to measurement error. For this reason, we have applied an outlier detection procedure.
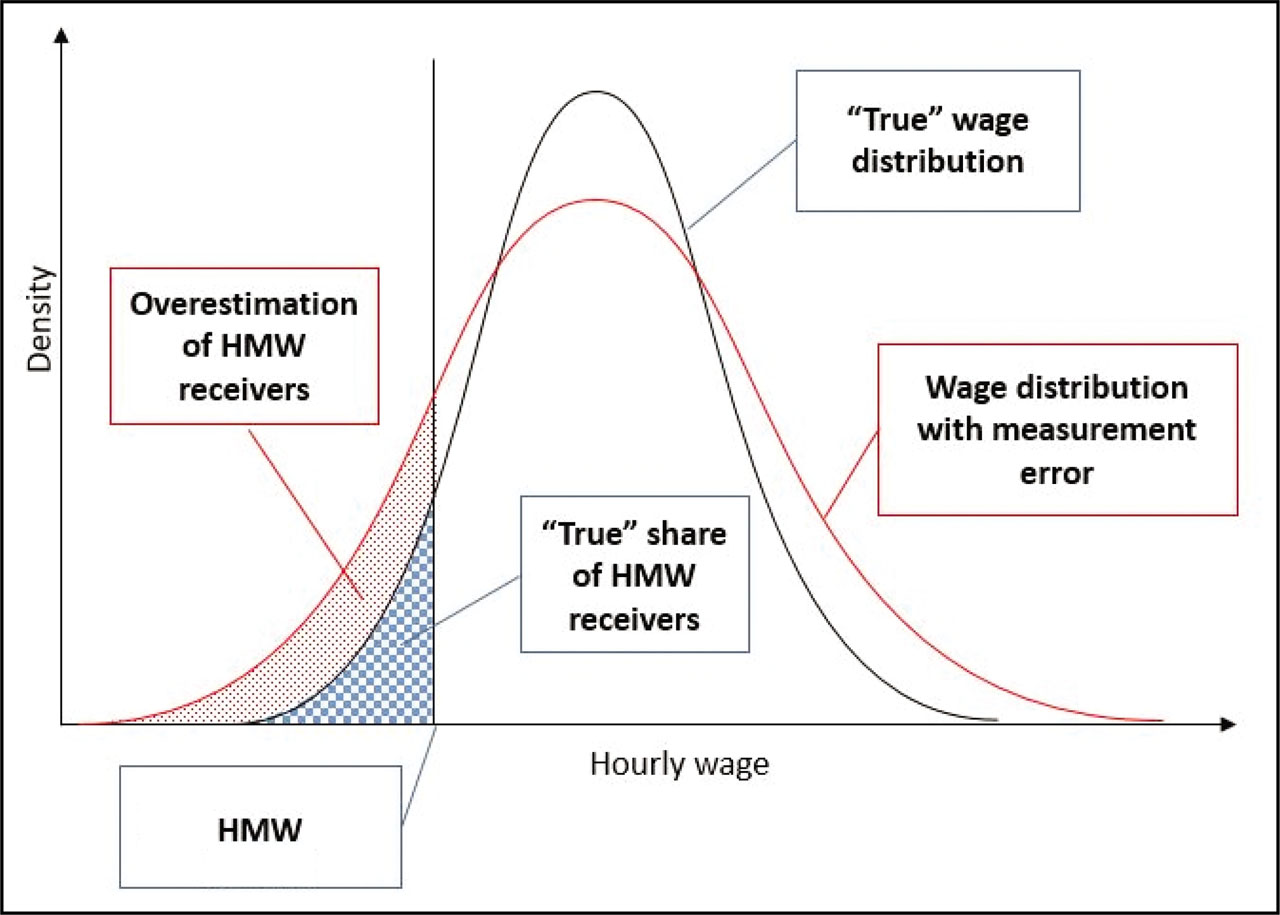
Figure B1
Distribution of gross hourly wages.
HMW, hypothetical MW.
An outlier is identified based on the interquartile range (IQR) of log(hourly wage). The method is based on the logarithm of hourly wages, and it assumes that hourly wages follow a log-normal distribution. The IQR is the distance between the 25% percentile and the 75% percentile of the wage distribution. We identify outliers as observations smaller than the median minus 1.5 times the IQR:
where Outlieri indicates whether the hourly wage of individual i is an outlier, HWi refers to hourly wage, and Median(HW) refers to the median hourly wage in the sample.33 Finally, the wages of individuals identified as outliers based on their very low level of hourly wages are not increased to the level of the new HMWs in the simulations.It is important to note that some individuals have hourly wages that are somewhat below the SMW in the baseline but high enough not to qualify as outliers. In the simulations, their wages are increased to the new HMW.34 This choice is consistent with increased compliance and a reduced use of exemptions from and variations in the SMW. This may imply some overestimation of the impacts of the MW for the group of sub-MW earners, but this possible effect is limited by the outlier correction.
B.5. Accounting for different evolution of MW growth and average wage growth
As mentioned above, the data used in this study cover earnings in 2016. However, the considered HMW scenarios are assessed against a baseline based on fiscal regimes in 2019. To account for the changes in earnings during the period between 2016 and 2019, incomes are uprated according to income-specific indices, as is the standard practice in EUROMOD simulations.35 In particular, in most countries, EUROMOD uses the average growth rate of employment income to uprate earnings.
Increasing wages by the average growth rate assumes that there is no heterogeneity in wage growth along the wage distribution. This is, however, often not the case. In particular, a challenge for our analysis arises when average wage growth differs from the actual increase in SMWs over the same period. In fact, as shown in Table B2 in Appendix, in some countries there was a difference between 2016 and 2019. This is the case for instance in Spain, where average nominal wages increased by 3% between 2016 and 2019, while the monthly SMW increased by 37% (from 765 EUR to 1,050 EUR36). In 2016, the year when income data were recorded, the MW level was therefore much lower than in 2019. If wages were uprated by 3%, a Spanish MW worker, earning a monthly gross income of 765 EUR in 2016, would appear to earn just 788 EUR in 2019. The Spanish example shows how wages in the bottom part of wage distribution might be underestimated when earnings are uprated by the average wage growth. This has direct consequences for our analysis because it could overestimate the potential effect of a HMW.
Table B2
Difference in growth between SMWs and average wages from 2016 to 2019
| Country | (A) Nominal growth of SMW 2016–2019 (%) | (B) Average nominal wage growth 2016–2019 (%) | Difference between (A) and (B) (%) |
|---|---|---|---|
| Belgium | 4 | 7 | −3 |
| Bulgaria | 33 | 28 | 5 |
| Czechia | 44 | 24 | 20 |
| Germany | 8 | 9 | −1 |
| Estonia | 26 | 22 | 4 |
| Greece | 11 | 4 | 7 |
| Spain | 37 | 3 | 34 |
| France | 4 | 10 | −6 |
| Croatia | 22 | 14 | 8 |
| Hungary | 32 | 43 | −12 |
| Ireland | 7 | 10 | −3 |
| Lithuania | 46 | 66 | −20 |
| Luxembourg | 9 | 8 | 1 |
| Latvia | 16 | 26 | −10 |
| Malta | 5 | 12 | −7 |
| Netherlands | 6 | 5 | 2 |
| Poland | 27 | 19 | 8 |
| Portugal | 13 | 8 | 6 |
| Romania | 59 | 79 | −20 |
| Slovenia | 12 | 9 | 3 |
| Slovakia | 28 | 18 | 10 |
[i] SMWs, statutory MW.
To tackle this issue, we increase the hourly wages below the SMW in 2019 using the growth rate of the SMW and not the average wage growth. In order not to distort the aggregated wage statistics, we do this uprate by adjusting the working time of the workers rather than changing the yearly gross wage. An example for the correction of working hours would be the following: let us suppose that a full-time Spanish worker reports earning the MW in force in 2016, that is, 765 EUR. In 2019, under the assumption that this worker has not experienced any change in employment status, and he is still earning the MW, his wage should be 37% higher. In such case, we increase the income by the nominal wage growth rate of 3% but reduce the hours of work by 34%, from 40 h/week to 30 h/week. In this way, the hourly wage would correspond to the hourly MW in force in 2019.37
In contrast, some countries (such as Hungary, Latvia, Lithuania, and Romania) experienced a higher growth in wages overall than in the SMW. In fact, in these countries, the increase of average wages between 2016 and 2019 was at least 10% higher than the growth in the MW in these countries (Table B.2 in Appendix above). Hence, an across-the-board uprating of wages by the average rate of wage growth might lead to overestimated increases at the bottom of the wage distribution and a potential underestimation of the impact of HMW increases. To account for the potential underestimation, the wages of employees earning at (or close to) the SMW level should be uprated with a lower uprating factor than the one used in EUROMOD. However, it is difficult to determine an earnings range in which we should apply lower uprating factors. The divergence in growth rates of average wages and SMW is also relatively small, much smaller than in the case of Spain, where it was 34%. We therefore do not change uprating factors of wages in such case. As a result, our estimates of the impact of MW reforms for countries like Hungary, Latvia, Lithuania, and Romania might be slightly underestimated and can be considered conservative.