
Figure 1
Descriptive Statistics for the Principal Sample
| Residents | Non-residents | Difference (Residents minus non-Residents) | |
|---|---|---|---|
| Student Variables | |||
| Math z-score | −0.076 [0.062] | −0.010 [0.046] | −0.065 |
| Reading z-score | −0.075 [0.057] | −0.022 [0.038] | −0.053 |
| Black | 0.487 [0.050] | 0.370 [0.040] | 0.117* |
| Hispanic | 0.367 [0.048] | 0.452 [0.038] | −0.085 |
| Other race | 0.042 [0.010] | 0.069 [0.017] | −0.027 |
| Female | 0.489 [0.004] | 0.497 [0.003] | −0.007 |
| Special Education | 0.150 [0.005] | 0.145 [0.004] | 0.005 |
| Grade Average Enrollment | 61.599 [4.269] | 70.345 [3.695] | −8.746 |
| Principal variables | |||
| Asian | 0.000 [0.000] | 0.014 [0.014] | −0.014 |
| Black | 0.015 [0.015] | 0.010 [0.010] | 0.005 |
| Hispanic | 0.425 [0.062] | 0.350 [0.044] | 0.075 |
| Multiple race | 0.143 [0.044] | 0.167 [0.041] | −0.024 |
| Female | 0.754 [0.052] | 0.587 [0.050] | 0.167** |
| Birth Year | 1977.436 [0.717] | 1971.143 [0.579] | 6.293*** |
| Proportion with the job title: acting | 0.034 [0.020] | 0.049 [0.021] | −0.015 |
| Proportion with the job title: interim | 0.524 [0.064] | 0.671 [0.047] | −0.147* |
| Proportion with the job title: contract | 0.441 [0.064] | 0.280 [0.044] | 0.161** |
| Number of observations | 23,356 | 41,465 | |
TWFE event-study estimates
| Levels | Gains | ||||
|---|---|---|---|---|---|
| Math | Reading | Math | Reading | ||
| Pre-period | Resident*(t=−5) | 0.0087 (0.0431) | 0.0034 (0.0274) | 0.0477* (0.0270) | 0.0285 (0.0175) |
| Resident*(t=−4) | 0.0258 (0.0404) | 0.0286 (0.0246) | 0.0576** (0.0284) | 0.0459** (0.0206) | |
| Resident*(t=−3) | 0.0154 (0.0213) | 0.0244 (0.0217) | 0.0322 (0.0266) | 0.0230 (0.0171) | |
| Resident*(t=−2) | 0.0212 (0.0267) | 0.0236 (0.0169) | 0.0298 (0.0199) | 0.0270 (0.0183) | |
| Post-period | Reference period (t=−1) | ||||
| Resident*(t=0) (dropped) | |||||
| Resident*(t=1) | 0.0541** (0.0267) | 0.0501** (0.0201) | 0.0779*** (0.0215) | 0.0528*** (0.0172) | |
| Resident*(t=2) | 0.0782* (0.0411) | 0.0584** (0.0241) | 0.0759*** (0.0255) | 0.0357*** (0.0154) | |
| Sample Size | 440968 | 440968 | 352705 | 351864 | |
Gardner (2022) two-stage event-study estimates (controlling for period before)
| Levels | Gains | ||||
|---|---|---|---|---|---|
| Math | Reading | Math | Reading | ||
| Pre-period | Resident*(t=−5) | −0.0052 (0.0154) | −0.0121 (0.0105) | 0.0090 (0.0086) | 0.0005 (0.0057) |
| Resident*(t=−4) | 0.0098 (0.0135) | 0.0094 (0.0087) | 0.0179* (0.0105) | 0.0159* (0.0073) | |
| Resident*(t=−3) | −0.0017 (0.0097) | 0.0034 (0.0097) | −0.0075 (0.0104) | −0.0074 (0.0073) | |
| Resident*(t=−2) | 0.0045 (0.0147) | 0.0043 (0.0097) | −0.0095 (0.0101) | −0.0014 (0.0078) | |
| Post-period | Reference period (t=−1) | ||||
| Resident*(t=0) (dropped) | |||||
| Resident*(t=1) | 0.0435 (0.0321) | 0.0333 (0.0252) | 0.0433*** (0.0157) | 0.0258** (0.0126) | |
| Resident*(t=2) | 0.0687 (0.0436) | 0.0438 (0.0287) | 0.0418** (0.0197) | 0.0097 (0.0114) | |
| Sample Size | 440968 | 440968 | 352705 | 351864 | |
Gardner (2022) two-stage event-study estimates
| Levels | Gains | ||||
|---|---|---|---|---|---|
| Math | Reading | Math | Reading | ||
| Pre-period | Resident*(t=−5) | −0.0048 (0.0155) | −0.0116 (0.0106) | 0.0101 (0.0086) | 0.0001 (0.0057) |
| Resident*(t=−4) | 0.0108 (0.0142) | 0.0109 (0.0090) | 0.0210* (0.0108) | 0.0183** (0.0085) | |
| Resident*(t=−3) | −0.00004 (0.0102) | 0.0061 (0.0083) | −0.0021 (0.0104) | −0.0033 (0.0074) | |
| Resident*(t=−2) | 0.0070 (0.0131) | 0.0084 (0.0091) | −0.0013 (0.0099) | 0.0048 (0.0083) | |
| Post-period | Reference period (t=−1) | ||||
| Resident*(t=0) (dropped) | |||||
| Resident*(t=1) | 0.0451 (0.0305) | 0.0374 (0.0240) | 0.0516*** (0.0153) | 0.0321*** (0.0122) | |
| Resident*(t=2) | 0.0714* (0.0427) | 0.0481* (0.0277) | 0.0503** (0.0195) | 0.0165 (0.0111) | |
| Sample Size | 440968 | 440968 | 352705 | 351864 | |
Gardner (2022) two-stage event-study estimates (principal remains there 3 years)
| Levels | Gains | ||||
|---|---|---|---|---|---|
| Math | Reading | Math | Reading | ||
| Pre-period | Resident*(t=−5) | 0.0076 (0.0198) | 0.0011 (0.0126) | 0.0117 (0.0119) | 0.0005 (0.0069) |
| Resident*(t=−4) | 0.0074 (0.0157) | 0.0019 (0.0098) | 0.0116 (0.0106) | 0.0049 (0.0067) | |
| Resident*(t=−3) | −0.0085 (0.0139) | 0.0038 (0.0119) | −0.0011 (0.0129) | 0.0053 (0.0096) | |
| Resident*(t=−2) | 0.0071 (0.0183) | 0.0031 (0.0129) | −0.0031 (0.0139) | 0.0025 (0.0127) | |
| Post-period | Reference period (t=−1) | ||||
| Resident*(t=0) (dropped) | |||||
| Resident*(t=1) | 0.0466 (0.0520) | 0.0616 (0.0413) | 0.0519* (0.0269) | 0.0541*** (0.0210) | |
| Resident*(t=2) | 0.1007 (0.0660) | 0.0787* (0.0467) | 0.0654** (0.0276) | 0.0247 (0.0165) | |
| Sample Size | 229918 | 229918 | 183850 | 183468 | |
TWFE event-study estimates (school has 3 post-period years)
| Levels | Gains | ||||
|---|---|---|---|---|---|
| Math | Reading | Math | Reading | ||
| Pre-period | Resident*(t=−5) | −0.0047 (0.0434) | 0.0043 (0.0303) | 0.0297 (0.0268) | 0.0190 (0.0202) |
| Resident*(t=−4) | 0.0028 (0.0399) | 0.0151 (0.0269) | 0.0386 (0.0262) | 0.0304 (0.0201) | |
| Resident*(t=−3) | 0.0019 (0.0318) | 0.0129 (0.0245) | 0.0282 (0.0249) | 0.0176 (0.0200) | |
| Resident*(t=−2) | 0.0090 (0.0241) | 0.0148 (0.0186) | 0.0207 (0.0242) | 0.0216 (0.0231) | |
| Post-period | Reference period (t=−1) | ||||
| Resident*(t=0) (dropped) | |||||
| Resident*(t=1) | 0.0347 (0.0304) | 0.0490** (0.0239) | 0.0606** (0.0236) | 0.0528** (0.0212) | |
| Resident*(t=2) | 0.0667* (0.0392) | 0.0540** (0.0243) | 0.0630** (0.0248) | 0.0284* (0.0168) | |
| Sample Size | 385322 | 385322 | 308109 | 307332 | |
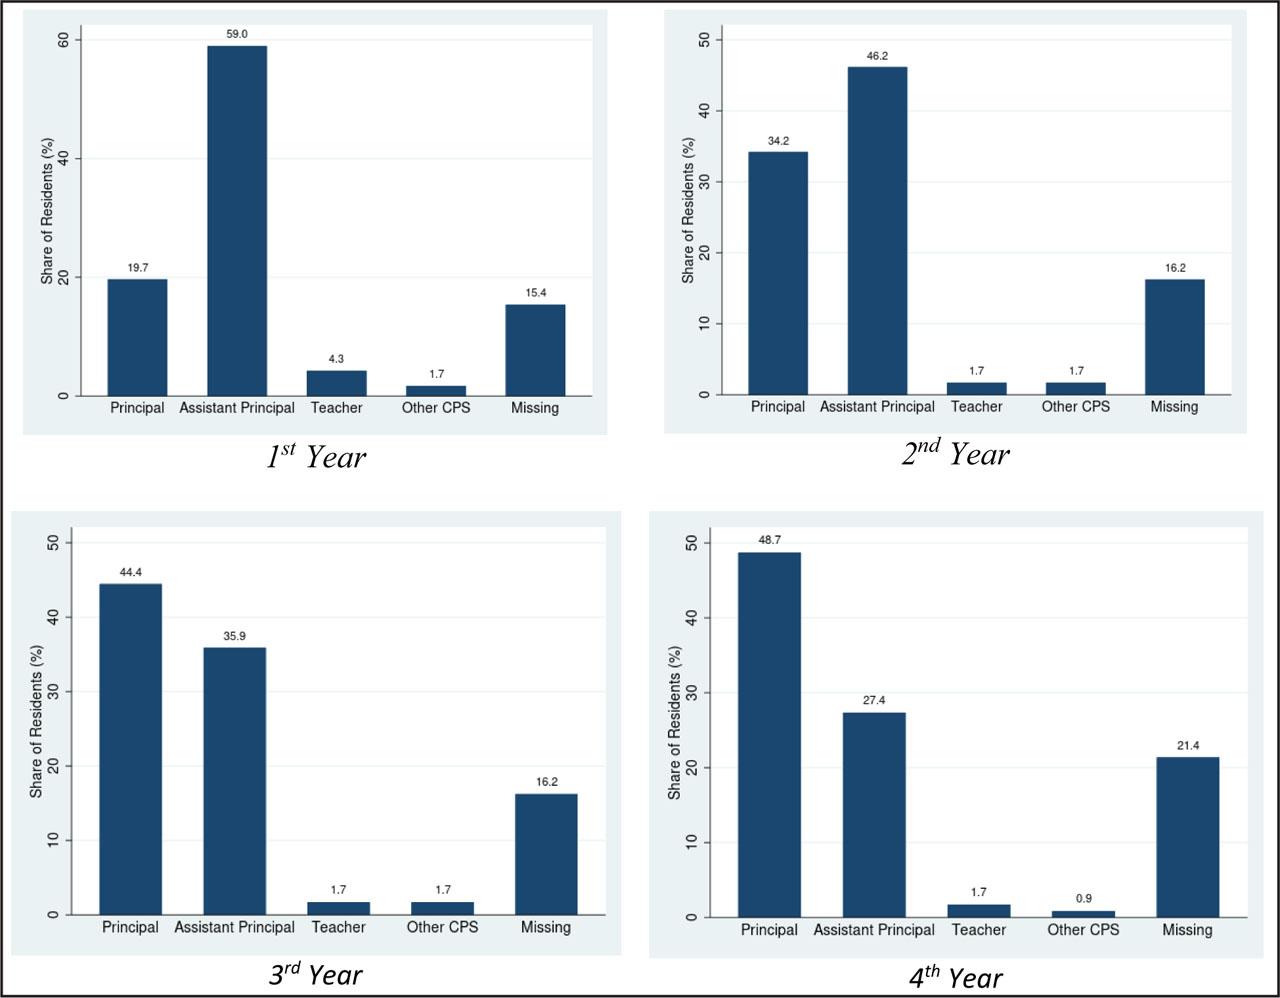
Number of Residency-program Graduates by Cohort of Program Completion, and Number of First-year Elementary School Principals and Assistant Principals by Year and Residency-Program Participation Status
| First-year principals | First-year assistant principals | ||||
|---|---|---|---|---|---|
| Residency program graduates | Residency program participants | Non-participants | Residency program participants | Non-participants | |
| 2013 | 63 | ||||
| 2014 | 65 | 5 | 36 | 18 | 70 |
| 2015 | 63 | 18 | 25 | 19 | 68 |
| 2016 | 39 | 18 | 23 | 17 | 40 |
| 2017 | 35 | 15 | 27 | 12 | 25 |
| 2018 | 14 | 15 | 6 | 28 | |
| Total | 265 | 70 | 126 | 72 | 231 |
Resident-Versus Non-Resident-Principal Transition Rates, by Destination and Period Examined
| Transition in any year (2014–2017) | Transition following the 1st year | |||||
|---|---|---|---|---|---|---|
| Any destination | ||||||
| Resident Principal | 0.130* (0.068) | 0.110 (0.070) | 0.071 (0.083) | −0.00017 (0.050) | 0.0018 (0.052) | −0.028 (0.060) |
| Mean Turnover | 0.30 | 0.30 | 0.30 | 0.10 | 0.10 | 0.10 |
| Sample Size | 184 | 184 | 184 | 184 | 184 | 184 |
| Multinomial Logit Estimates (relative to no transition) | ||||||
| Transition within CPS | ||||||
| Resident Principal | 2.65*** (0.77) | 2.65*** (0.77) | 3.30** (1.38) | 2.15* (1.18) | 2.40** (1.18) | 2.20 (1.80) |
| Transition out of CPS | ||||||
| Resident Principal | −0.10 (0.42) | −0.16 (0.44) | −0.55 (0.60) | −1.33 (0.86) | −1.36 (0.96) | −2.39** (1.18) |
| Sample Size | 184 | 184 | 184 | 184 | 184 | 184 |
| Student Controls | N | Y | Y | N | Y | Y |
| Principal Controls | N | N | Y | N | N | Y |
TWFE control coefficients
| Mathematics | Reading | |||
|---|---|---|---|---|
| Levels | Gains | Levels | Gains | |
| Student Black | −0.5523*** | −0.1834*** | −0.3968*** | −0.1482*** |
| 0.0346 | 0.0112 | 0.0368 | 0.0111 | |
| Student Hispanic | 0.3420*** | −0.1112*** | −0.327*** | −0.1047*** |
| 0.0261 | 0.0083 | 0.0297 | 0.0094 | |
| Student Other Race | 0.0989* | 0.0532** | −0.0816*** | −0.0061 |
| 0.0569 | 0.0210 | 0.0279 | 0.0113 | |
| Student Female | −0.0434*** | −0.0061*** | 0.1095*** | 0.0312*** |
| 0.0051 | 0.0019 | 0.0046 | 0.0019 | |
| Student Special Education | −0.0975 | −0.2951*** | −1.2028*** | −0.3671*** |
| 0.0175 | 0.0088 | 0.0145 | 0.0076 | |
| Sample Size | 440968 | 352705 | 440968 | 351864 |
TWFE event-study estimates (principal remains there 3 years)
| Levels | Gains | ||||
|---|---|---|---|---|---|
| Math | Reading | Math | Reading | ||
| Pre-period | Resident*(t=−5) | 0.0178 (0.0602) | 0.0055 (0.0395) | 0.0436 (0.0396) | 0.0113 (0.0277) |
| Resident*(t=−4) | 0.0181 (0.0549) | 0.0085 (0.0344) | 0.0436 (0.0391) | 0.0176 (0.0264) | |
| Resident*(t=−3) | 0.0021 (0.0446) | 0.0114 (0.0341) | 0.0291 (0.0365) | 0.0185 (0.0303) | |
| Resident*(t=−2) | 0.0163 (0.0372) | 0.0099 (0.0283) | 0.0286 (0.0368) | 0.0140 (0.0319) | |
| Post-period | Reference period (t=−1) | ||||
| Resident*(t=0) (dropped) | |||||
| Resident*(t=1) | 0.0526 (0.0426) | 0.0622* (0.0341) | 0.0767** (0.0350) | 0.0614** (0.0292) | |
| Resident*(t=2) | 0.1004* (0.0561) | 0.0777* (0.0394) | 0.0861** (0.0331) | 0.0331 (0.0246) | |
| Sample Size | 229918 | 229918 | 183850 | 183468 | |
Gardner (2022) two-stage event-study estimates (school has 3 post-period years)
| Levels | Gains | ||||
|---|---|---|---|---|---|
| Math | Reading | Math | Reading | ||
| Pre-period | Resident*(t=−5) | −0.0035 (0.0153) | −0.0031 (0.0105) | 0.0046 (0.0091) | 0.0009 (0.0062) |
| Resident*(t=−4) | 0.0021 (0.0129) | 0.0057 (0.0089) | 0.0131 (0.0091) | 0.0114 (0.0073) | |
| Resident*(t=−3) | −0.00007 (0.0115) | 0.0028 (0.0093) | 0.0041 (0.0108) | −0.0006 (0.0076) | |
| Resident*(t=−2) | 0.0072 (0.0141) | 0.0053 (0.0101) | −0.0007 (0.0108) | 0.0047 (0.0098) | |
| Post-period | Reference period (t=−1) | ||||
| Resident*(t=0) (dropped) | |||||
| Resident*(t=1) | 0.0417 (0.0363) | 0.0502* (0.0286) | 0.0437** (0.0183) | 0.0416*** (0.0147) | |
| Resident*(t=2) | 0.0721* (0.0438) | 0.0494* (0.0291) | 0.0439** (0.0197) | 0.0124 (0.0116) | |
| Sample Size | 385322 | 385322 | 308109 | 307332 | |
Gardner (2022) two-stage event-study estimates (school covariates)
| Enrollment | Black | Hispanic | Other | Female | Special Education | ||
|---|---|---|---|---|---|---|---|
| Pre-period | Resident*(t=−5) | −0.2652 (0.7526) | 0.0093*** (0.0031) | −0.0054* (0.0033) | 0.0015 (0.0010) | 0.0022 0.0022 | 0.0001 0.0019 |
| Resident*(t=−4) | −0.0998 (0.4900) | 0.0039** (0.0019) | −0.0034 (0.0023) | 0.0017 (0.0011) | −0.0004 0.0016 | 0.0004 0.0017 | |
| Resident*(t=−3) | −0.1110 (0.3483) | −0.0006 (0.0011) | −0.0015 (0.0011) | 0.0006 (0.0007) | 0.0015 0.0017 | −0.0005 0.0013 | |
| Resident*(t=−2) | 0.2523 (0.4461) | −0.0038* (0.0022) | 0.0029 (0.0023) | −0.0009 (0.0006) | 0.0012 0.0018 | −0.0007 0.0015 | |
| Pos | Reference period (t=−1) | ||||||
| Resident*(t=0) (dropped) | |||||||
| Resident*(t=1) | −1.1356 (1.2912) | −0.0155** (0.0058) | 0.0131** (0.0066) | −0.0039 (0.0029) | 0.0019 0.0045 | −0.0047 0.0041 | |
| Resident*(t=2) | −2.1136 (1.1582) | −0.0152* (0.0081) | 0.0185** (0.0091) | −0.0051 (0.0037) | 0.0027 0.0055 | −0.0052 0.0048 | |
| Sample Size | 440968 | 440968 | 440968 | 440968 | 440968 | 440968 | |