
Figure 1

Figure 2
Figure 3
Figure 4

Figure 5
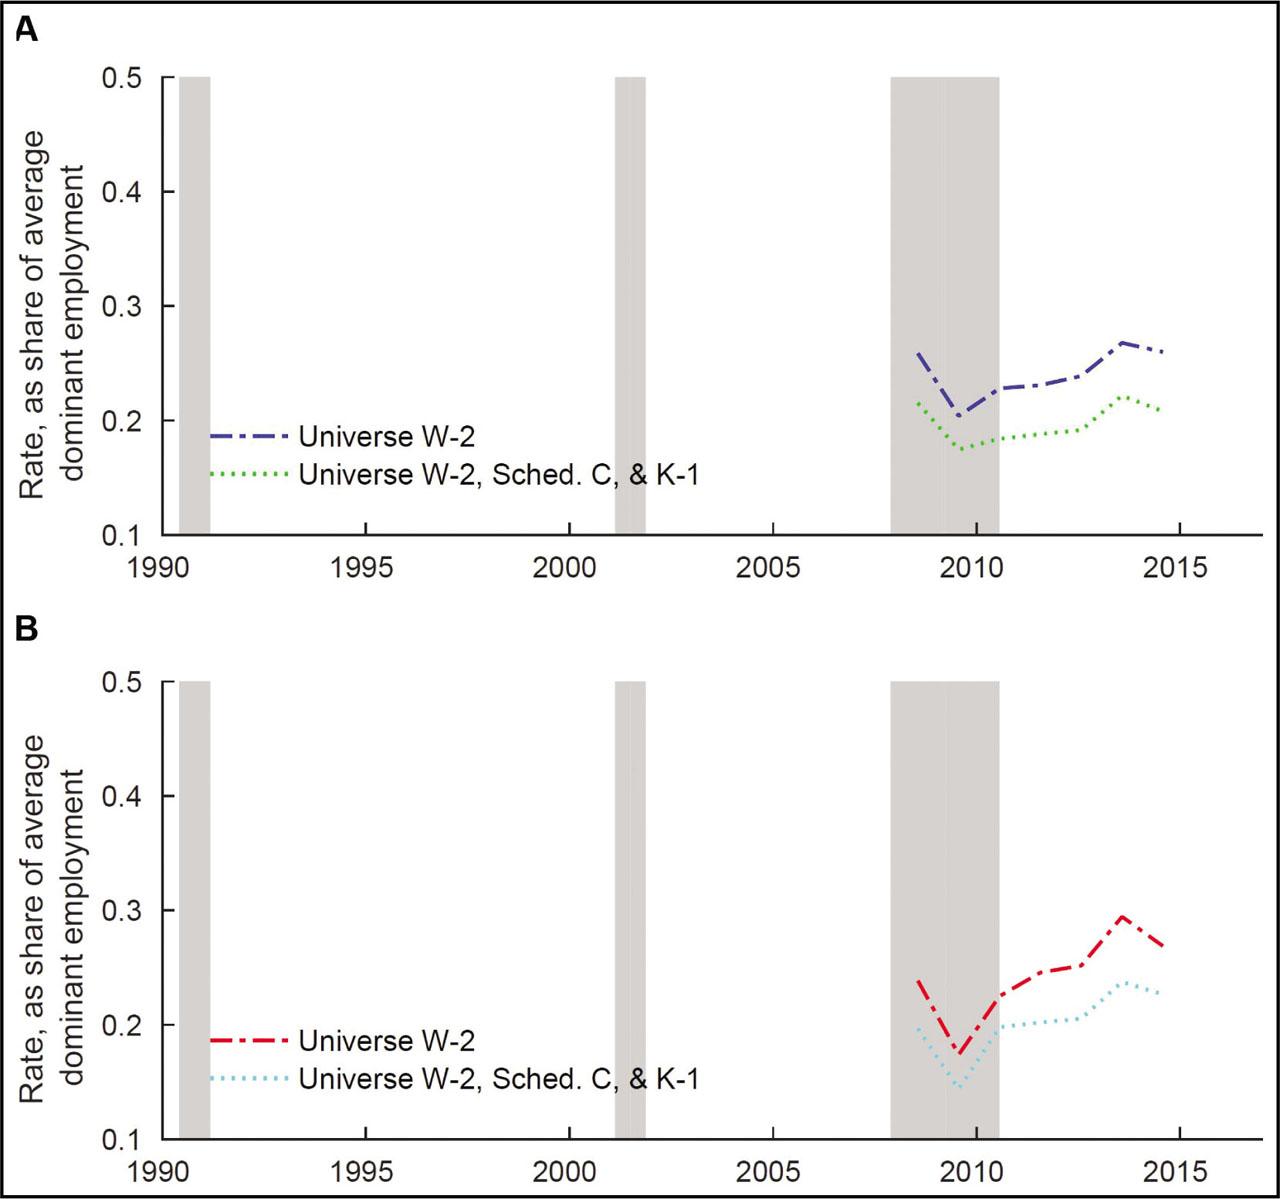
Figure 6
Figure B1
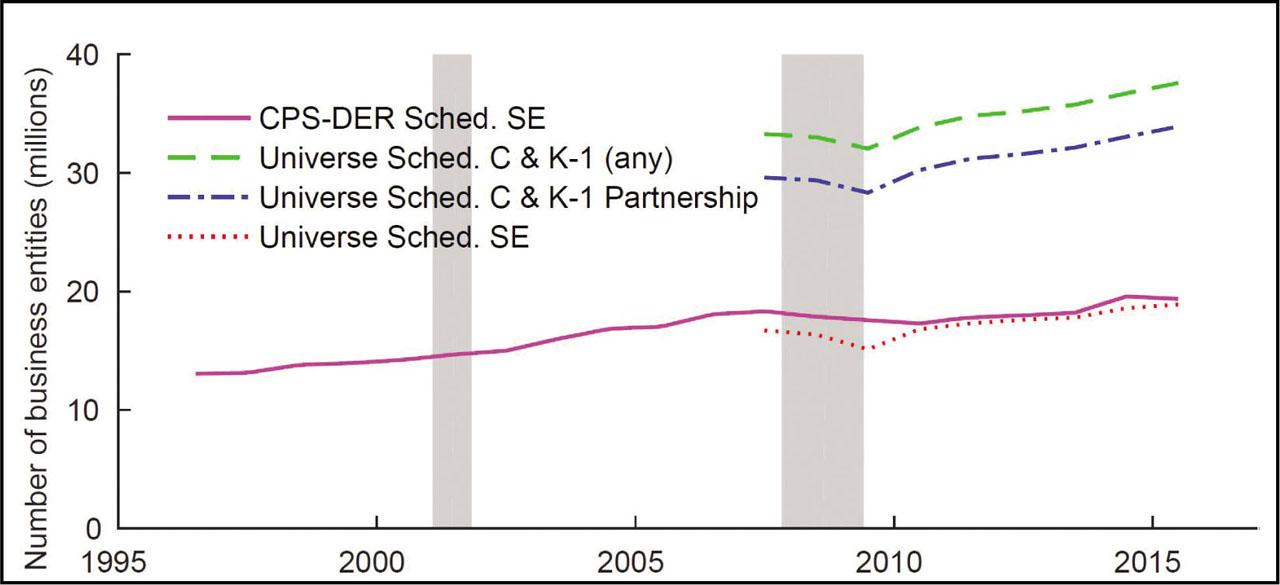
Figure D1

Figure E1
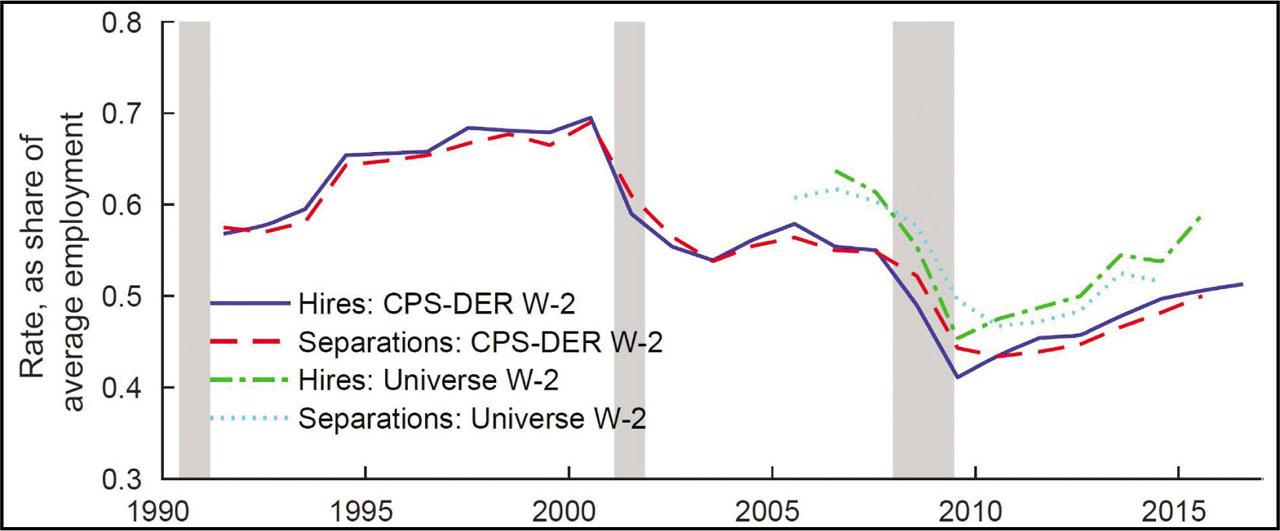
Figure E2
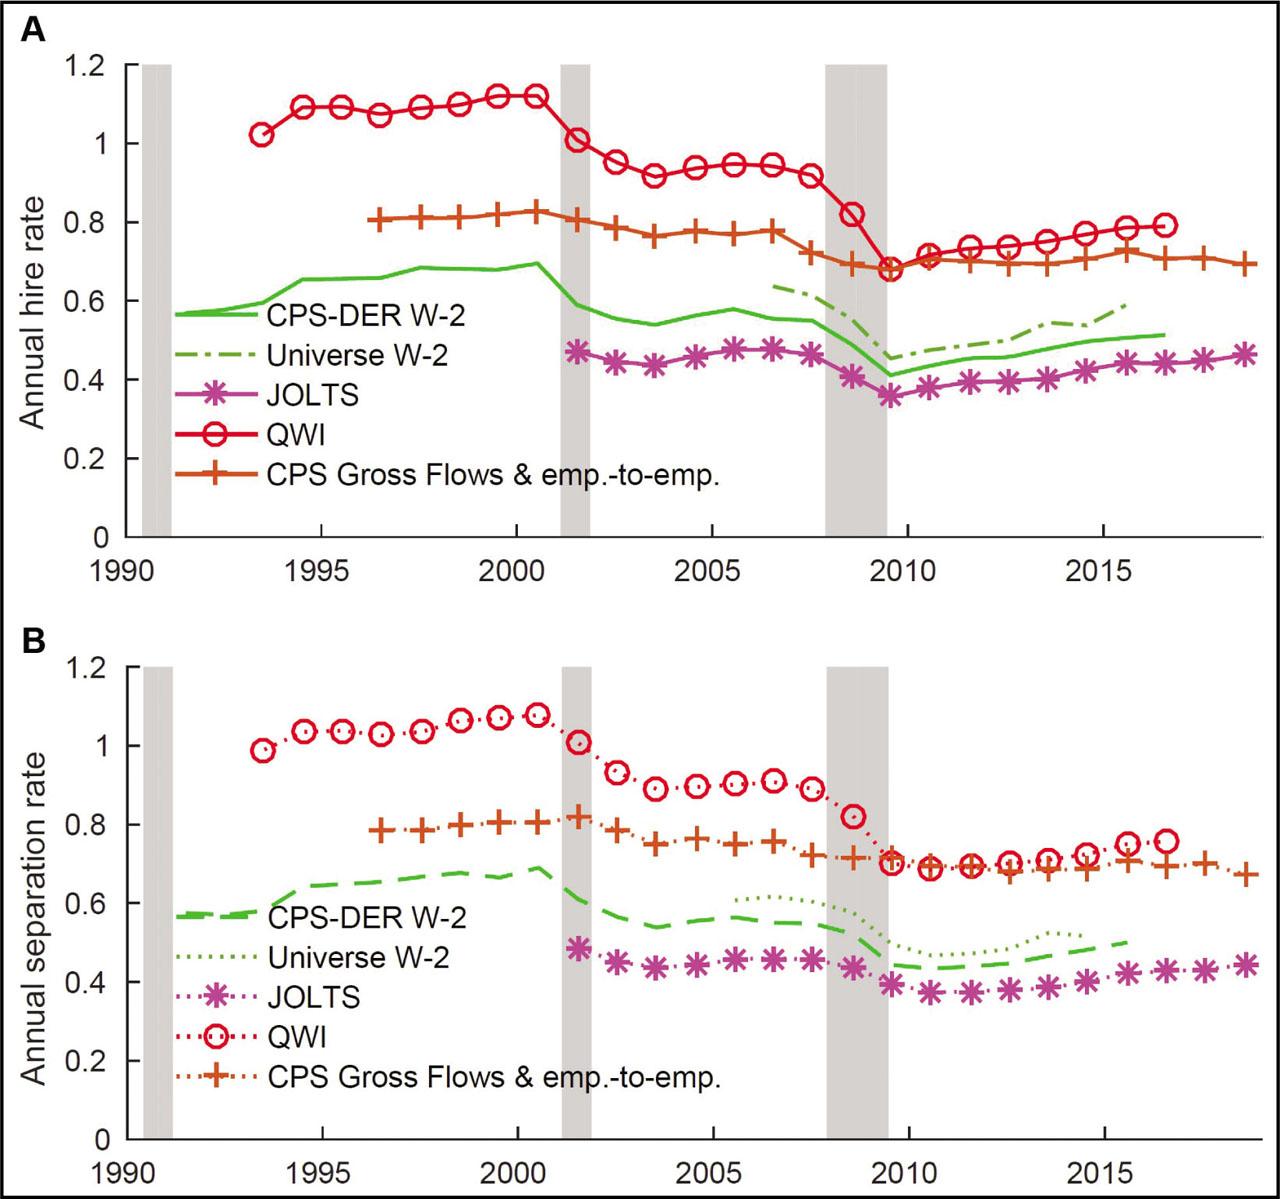
Figure E3
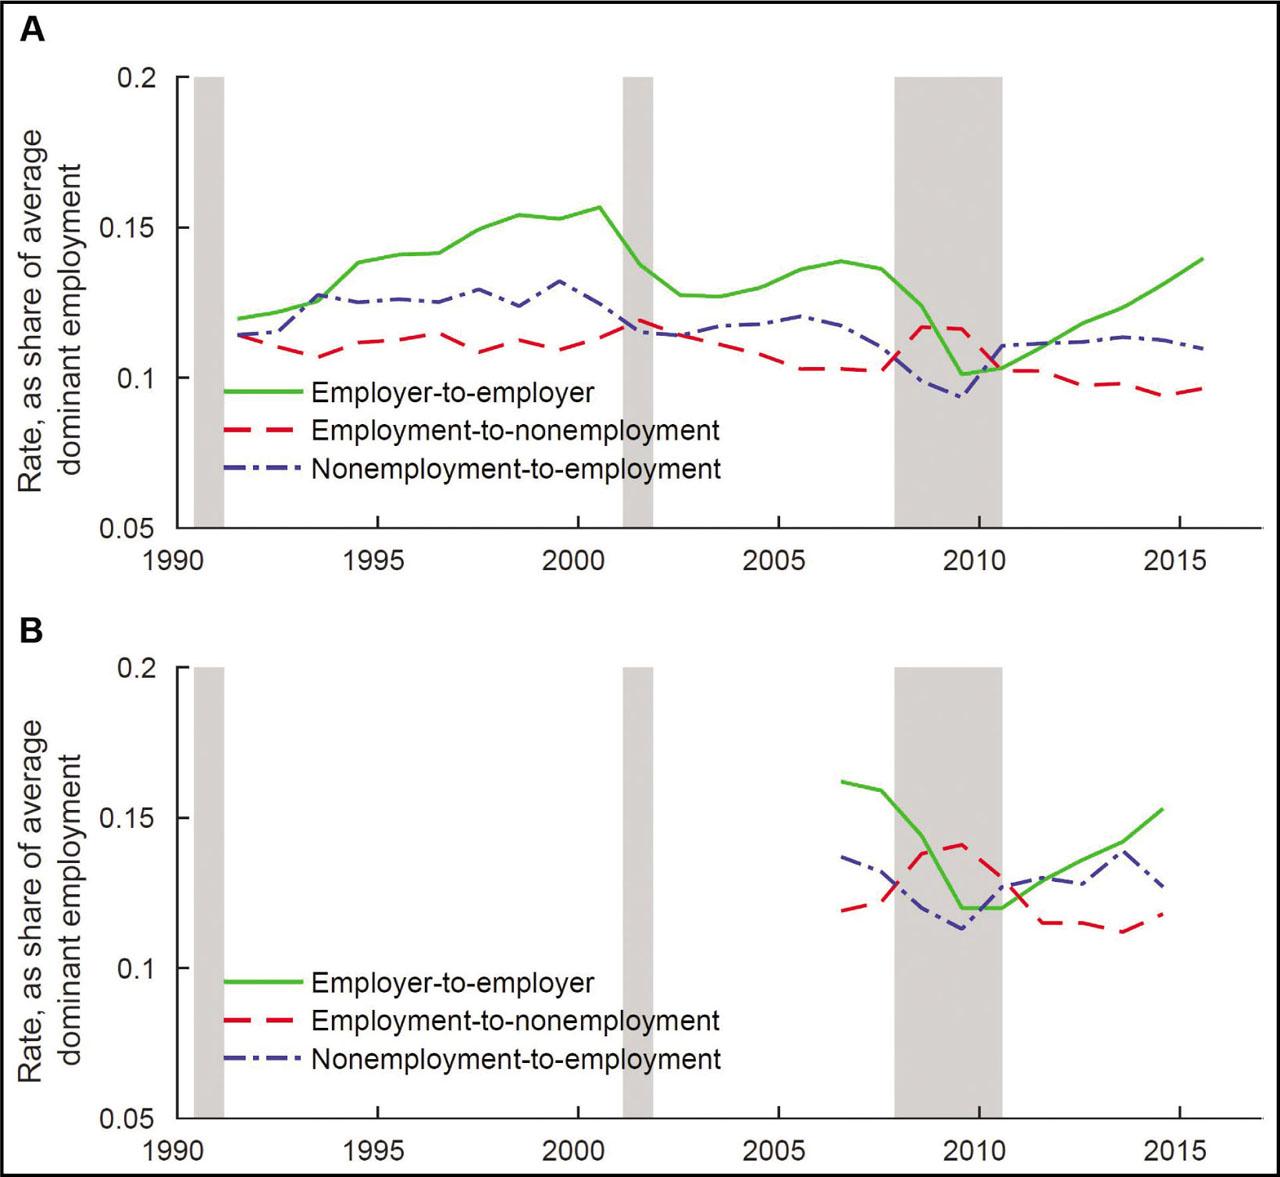
Figure E4
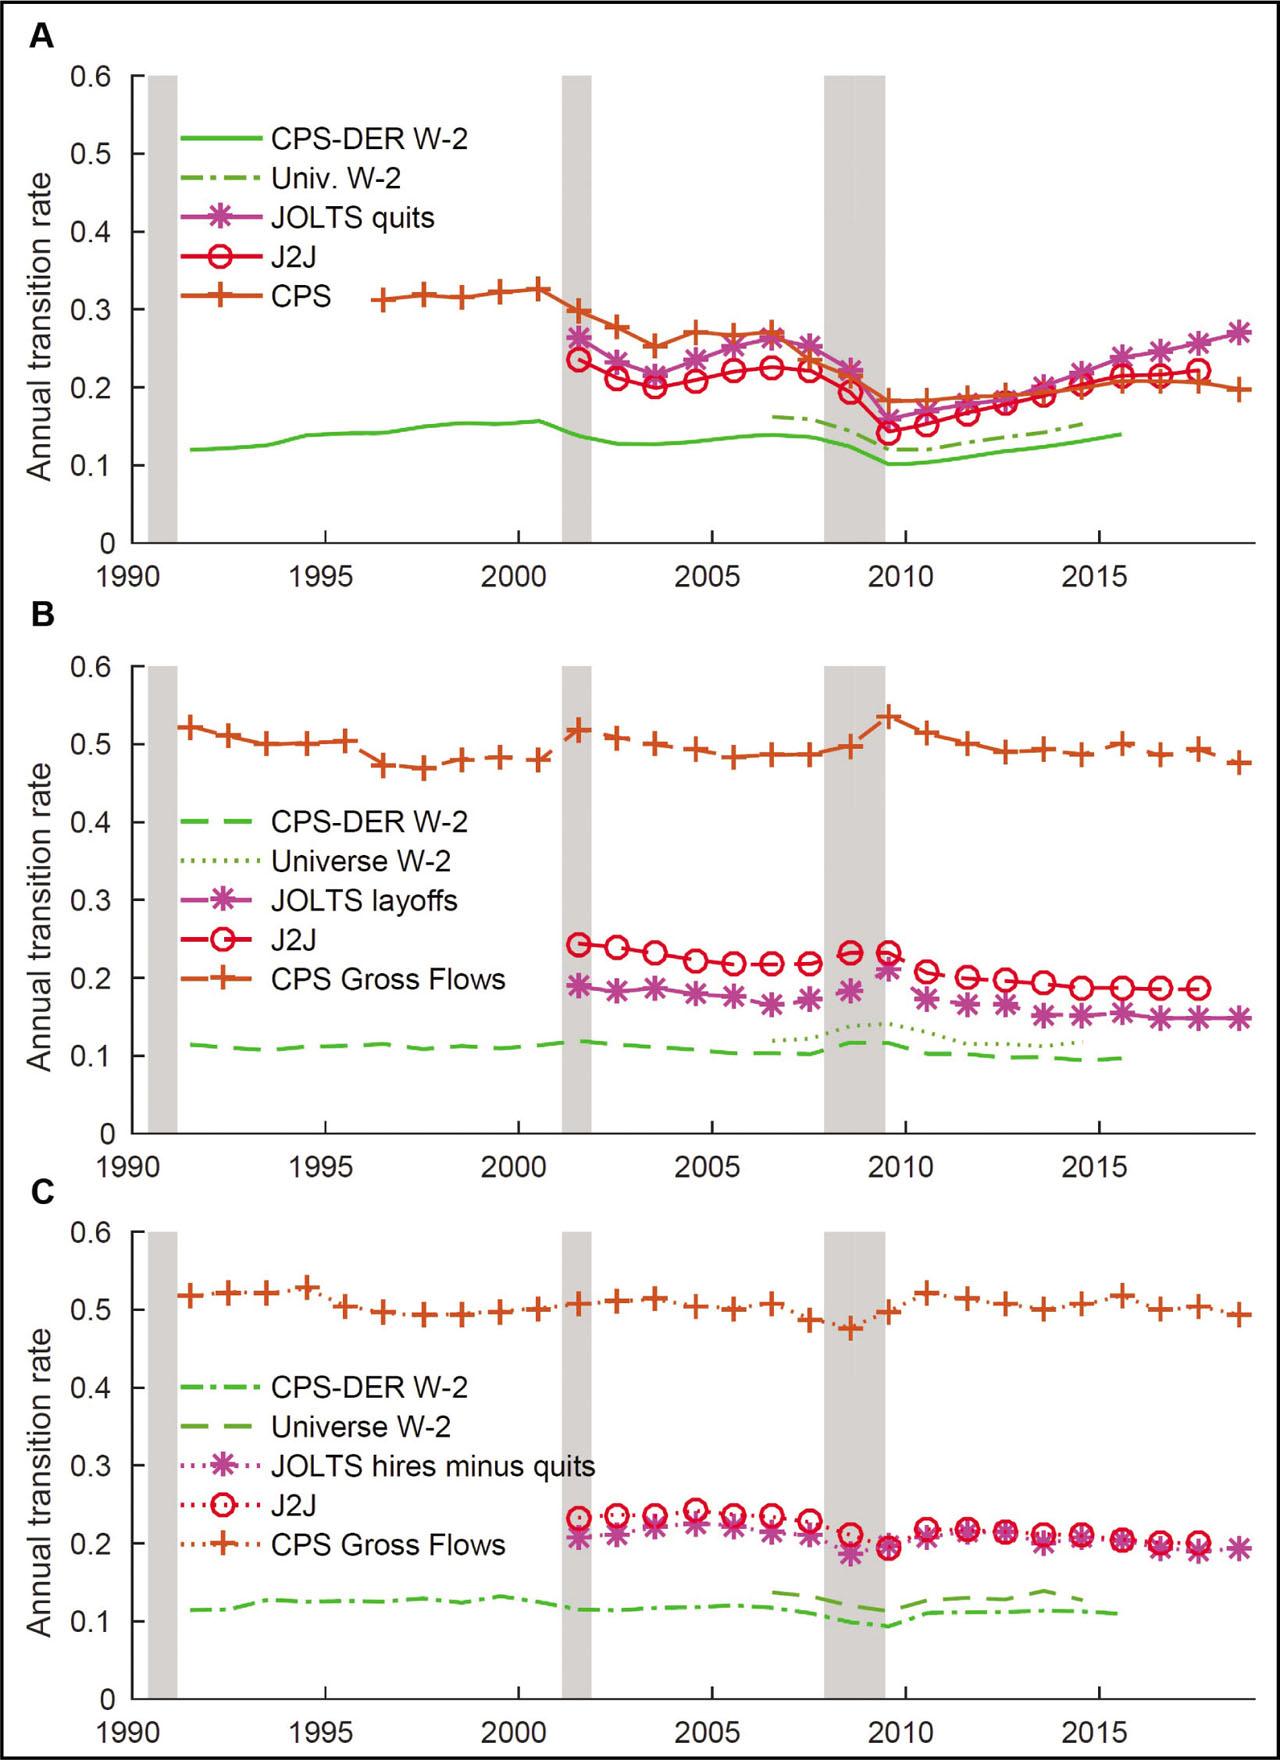
Figure E5
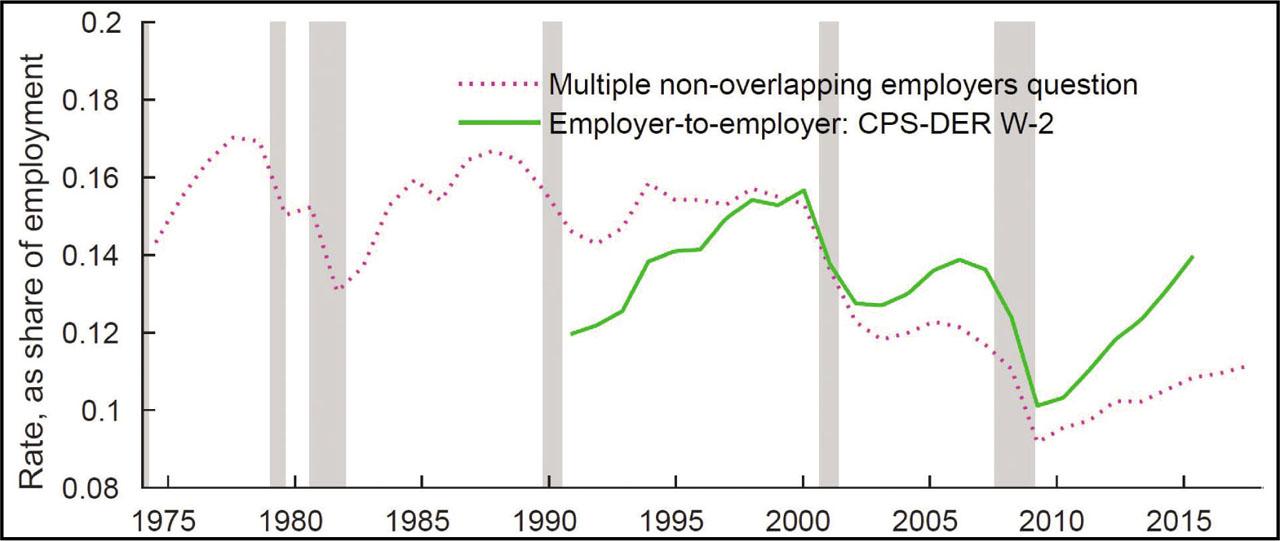
Figure F1
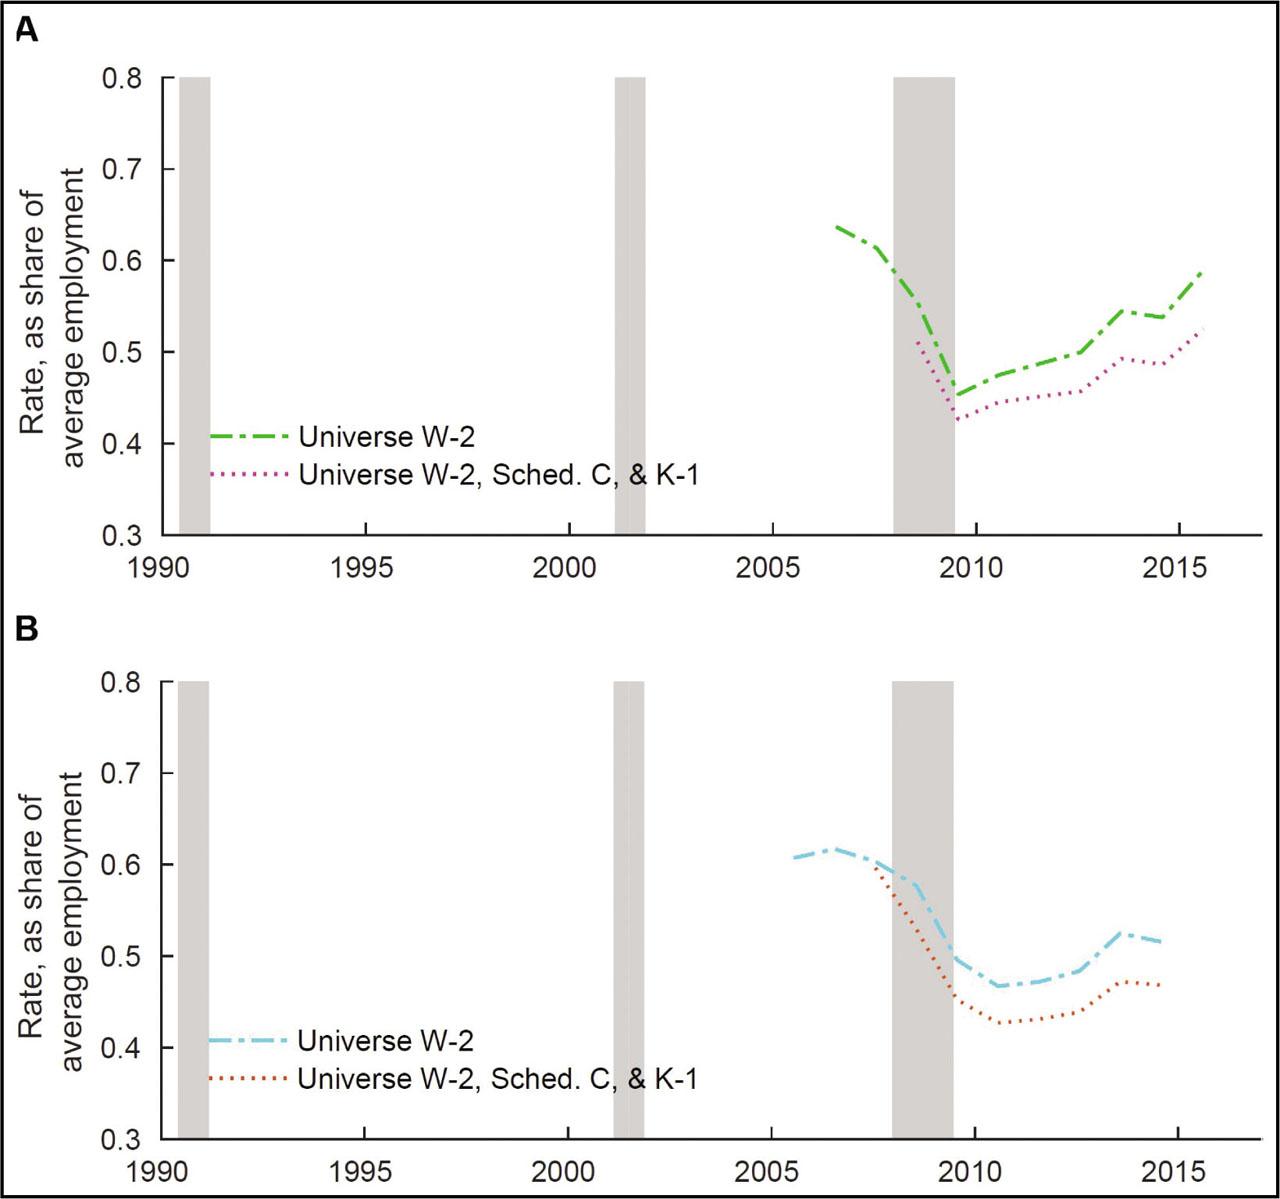
Figure F2
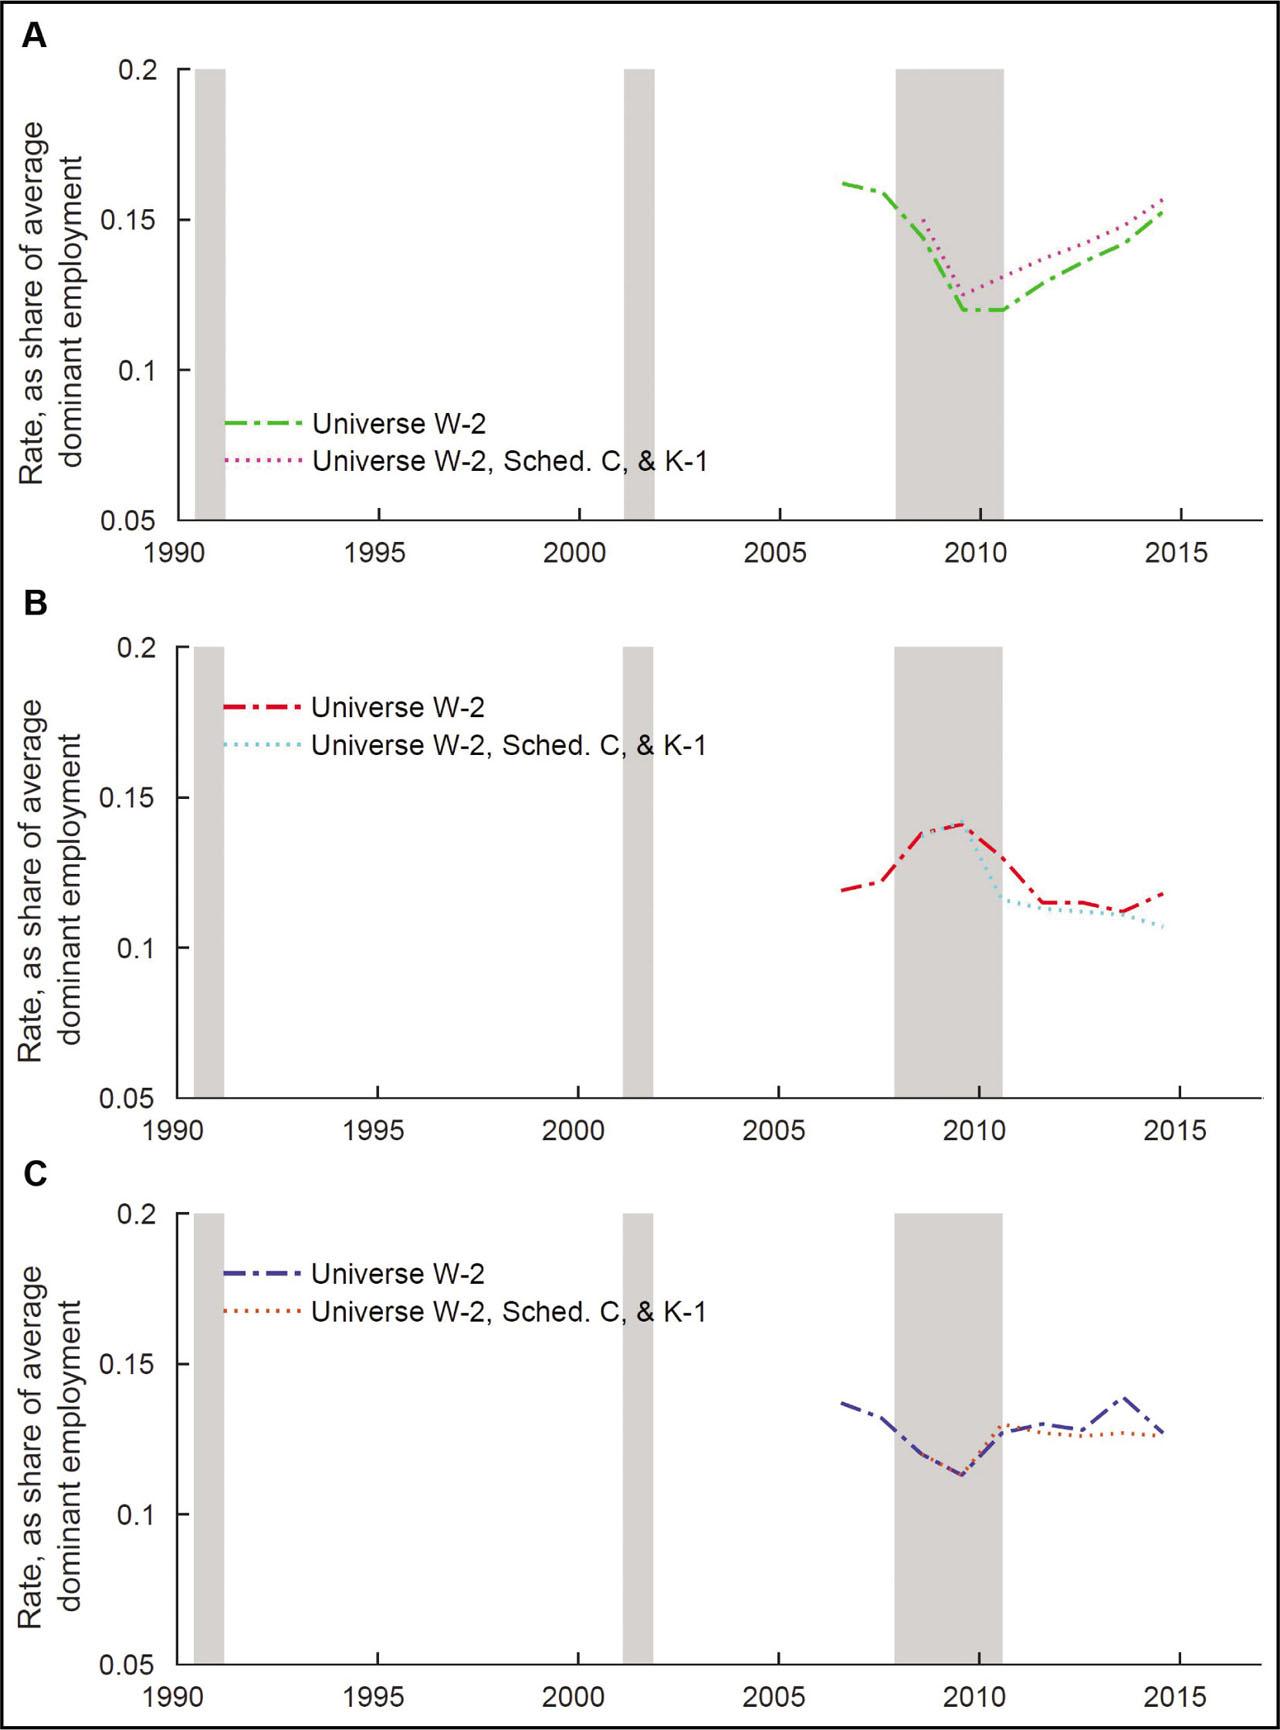
Figure F3
Number of industries worked regressed on BI
| Total industries | ||||
|---|---|---|---|---|
| Intercept | 1.258*** (0.000) | 1.258*** (0.000) | ||
| BI | 0.444*** (0.001) | 0.431*** (0.001) | 0.384*** (0.001) | 0.392*** (0.002) |
| BI*BI dom | 0.163*** (0.002) | 0.116*** (0.002) | ||
| Worker fixed effects | N | Y | N | Y |
| R2 | 0.053 | 0.406 | 0.055 | 0.407 |
Regression of total number of jobs (including BI) on BI
| CPS-DER | Universe | CPS-DER | Universe | |
|---|---|---|---|---|
| Intercept | 1.495*** (0.000) | 1.490*** (0.001) | ||
| BI | 0.117*** (0.001) | 0.567*** (0.001) | 0.404*** (0.001) | 0.748*** (0.001) |
| Worker fixed effects | N | N | Y | Y |
| R2 | 0.003 | 0.026 | 0.323 | 0.757 |
Number of wage and salary jobs worked regressed on BI
| CPS-DER | Universe | |||
|---|---|---|---|---|
| Intercept | 1.420*** (0.000) | 1.409*** (0.000) | ||
| Ever BI | 0.074*** (0.000) | 0.081*** (0.001) | ||
| Ever BI* BI | −0.143*** (0.001) | −0.101*** (0.001) | −0.088*** (0.001) | 0.013*** (0.001) |
| Ever BI* BI*BI dom | −1.002*** (0.001) | −0.818*** (0.001) | −1.010*** (0.002) | −0.817*** (0.001) |
| Worker fixed effects | N | Y | N | Y |
| R2 | 0.096 | 0.446 | 0.151 | 0.652 |
Measured decline in reallocation (percentage points) including vs_ including self-employed: 1994 vs_ 2014
| Reallocation Measure | Decline in W-2 | Decline in W-2 & Schedule SE | Difference | Percent offset (%) |
|---|---|---|---|---|
| Hires | 15.7 | 14.4 | 1.3 | 8.3 |
| Separations | 16.1 | 14.7 | 1.4 | 8.7 |
| Employer-to-employer | 0.7 | 0.6 | 0.2 | 23.8 |
| Employment-to-nonemployment | 1.8 | 1.7 | 0.1 | 4.1 |
| Nonemployment-to-employment | 1.3 | 1.1 | 0.2 | 15.6 |
| Secondary/short-duration hires | 13.9 | 12.8 | 1.1 | 7.4 |
| Secondary/short-duration separations. | 13.8 | 12.6 | 1.2 | 8.9 |
Administrative records data on U_S_ wage and salary and BI
| Legal designation | Tax Form/Info. Return | Files Schedule SE? | Survey-based data | Universe data |
|---|---|---|---|---|
| Employee | W-2 Wage and Salary Statement | N/A | Social Security Administration MEF, DER extract, 1991–2015 | W-2 Records 2005–2015 |
| Sole proprietorship | 1040 Schedule C Profit or Loss from Business | If total self-employment income >$400 | Social Security Administration MEF, DER extract, 1991–2015 | Census nonemployer and employer Business Registers 2007–2015 |
| Partnership | Schedule K1: Partner's Share of Income, Deductions, Credits, etc. | If total self-employment income >$400 | Social Security Administration MEF, DER extract, 1991–2015 | Schedule K1 filings 2007–2015 |
| S corporation | Schedule K1: Partner's Share of Income, Deductions, Credits, etc. | No | N/A | Schedule K1 filings 2007–2015 |
| C corporation | Outside the scope of our analysis | No | N/A | N/A |
Regression of total number of jobs worked on BI, by dominant earnings
| CPS-DER | Universe | CPS-DER | Universe | |
|---|---|---|---|---|
| Intercept | 1.456*** (0.000) | 1.409*** (0.000) | ||
| Ever BI | 0.077*** (0.001) | 0.081*** (0.001) | ||
| Ever BI * BI | 0.829*** (0.001) | 1.251*** (0.001) | 0.899*** (0.002) | 1.805*** (0.002) |
| Ever BI * BI * BI dom | −1.002*** (0.001) | −1.080*** (0.001) | −0.818*** (0.002) | −0.841*** (0.002) |
| Worker fixed effects | N | N | Y | Y |
| R2 | 0.028 | 0.074 | 0.351 | 0.768 |
Regression of number of wage and salary jobs worked on BI Intercept from any wage and salary employer in the year_
| CPS-DER | Universe | CPS-DER | Universe | |
|---|---|---|---|---|
| Intercept | 1.495*** (0.000) | 1.490*** (0.001) | ||
| BI | −0.883*** (0.001) | −0.757*** (0.002) | −0.596*** (0.001) | −0.313*** (0.001) |
| Worker fixed effects | N | N | Y | Y |
| R2 | 0.148 | 0.146 | 0.421 | 0.618 |
Share of business owners who receive wage and salary payments
| Schedule C Sole Proprietors | Form K1 Partnerships | Form K1 S Corps. | |
|---|---|---|---|
| W-2 Data | |||
| Share of owners: (%) | |||
| Owners of EIN firms in W-2 | 7.4 | 1.1 | 40.4 |
| Owners of employer firms in W-2 | 12.5 | 11.2 | 70.3 |
| Owners of employer firms, top 3 | 10.3 | 7.9 | 59.7 |
| Share of firms: (%) | |||
| Any owner of EIN firms in W-2 | 7.5 | 3.8 | 48.8 |
| Any owners of employer firms in W-2 | 13.2 | 24.3 | 84.8 |
| Any owners of employer firms, top 3 | 11.0 | 20.2 | 78.5 |
| LEHD Data | |||
| Share of owners: (%) | |||
| Owners of EIN firms in UI | 7.3 | 1.1 | 39.4 |
| Owners of employer firms in UI | 12.3 | 9.3 | 69.0 |
| Owners of employer firms, top 3 | 9.8 | 6.9 | 59.4 |
| Share of firms: (%) | |||
| Any owner of EIN firms in UI | 7.8 | 4.5 | 48.6 |
| Any owners of employer firms in UI | 13.6 | 26.5 | 83.0 |
| Any owners of employer firms, top 3 | 10.8 | 22.4 | 77.0 |
Share of owners who receive wage & salary payments: first year, single establishment
| Schedule C Sole Proprietors | Form K1 Partnerships | Form K1 S Corps. | |
|---|---|---|---|
| W-2 Data | |||
| Share of owners: (%) | |||
| Owners of employer firms in W-2 | 16.1 | 14.3 | 61.5 |
| Owners of employer firms, top 3 | 13.9 | 11.4 | 57.1 |
| Share of firms: (%) | |||
| Any owners of employer firms in W-2 | 17.0 | 26.9 | 74.6 |
| Any owners of employer firms, top 3 | 14.6 | 23.5 | 71.1 |
| LEHD Data | |||
| Share of owners: (%) | |||
| Owners of employer firms in UI | 15.5 | 13.8 | 59.6 |
| Owners of employer firms, top 3 | 13.5 | 11.3 | 55.4 |
| Share of firms: (%) | |||
| Any owners of employer firms in UI | 16.4 | 27.2 | 72.7 |
| Any owners of employer firms, top 3 | 14.2 | 23.8 | 69.3 |