
1. Introduction
Recent empirical research has documented a multi-decade decline in the fluidity of the U.S. economy, including a fall in the business start-up rate, declining flows of workers between primary jobs, and, most notably, a decline in the flows of workers to and from jobs that are short-term or secondary sources of earnings (Hyatt and Spletzer, 2013; Davis and Haltiwanger, 2014; Decker et al., 2014). This declining fluidity has troubling implications for the aggregate economy, since productivity tends to rise when new businesses enter and more productive businesses expand (Foster et al., 2001). It also matters for the outcomes of individual workers, since they benefit from opportunities to increase their earnings when they find better jobs (Topel and Ward, 1992). Moreover, there is a strong empirical relationship between labor reallocation rates and aggregate wage growth (Faberman and Justiniano, 2015).
Over the course of these same decades, the number of business income (BI) recipients has increased dramatically. This is in part due to the rise of the “gig economy” where individuals work through an online platform rather than in a traditional employer–employee relationship (Abraham et al., 2018b; Katz and Krueger, 2019). Recent studies have also documented a steady shift away from self-employment being an individual's primary source of earnings, as workers increasingly use it to supplement their earnings from wage and salary work (Jackson et al., 2017; Collins et al., 2019).
In this paper, we explore the connection between these two phenomena – specifically, the decline in hires and separations of wage and salary workers and the rise in the share of the workforce generating earnings through self-employment. We find that a small but nontrivial amount of the missing labor market fluidity can be found among the self-employed, who are omitted from most reallocation series. This relationship is especially important among marginal jobs that are short in duration or provide a secondary source of income. Our results suggest that the “gig economy” provides many entry-level and side jobs through which workers transition rapidly. The omission of the self-employed from most published labor reallocation statistics is therefore a significant limitation.
Using a combination of U.S. survey data and administrative tax records, we document the rise of self-employment in the U.S. in recent decades. We find that nearly one-in-five income recipients in the U.S. received BI in 2014 – underscoring the importance of the growing literature on self-employment and the rise of the “gig” economy. We also use these administrative tax records to document that the share of income recipients who receive BI rose 15% between 1991 and 2016, which is consistent with the earlier work by others, including Jackson et al. (2017) and Abraham et al. (2018a), on the rising share of the population with BI.
By linking information at the worker-level on wage and salary jobs and self-employment, we are able to follow workers as they flow between different employers. We also track their movements between wage and salary jobs and self-employment, and as they take on or discontinue stopgap or secondary work. We use our linked data to show that self-employed workers tend not to receive wage and salary income from their owned businesses. This finding has two important implications. First, there is a small literature, starting with Agarwal et al. (2016) and Kerr and Kerr (2017), that attempts to identify business founders, owners, and entrepreneurs as a firm's top wage and salary earners (using matched employer–employee records). Our finding that self-employed individuals rarely receive wage and salary income from their owned business cautions against such an interpretation. Second, our result that BI recipients are mostly absent from U.S. matched employer–employee data indicates that the self-employed are, by and large, omitted from existing studies of labor market fluidity including, e.g., Hyatt and Spletzer (2013) and Davis and Haltiwanger (2014).
Next, we use these linkages to compute the rates of entry into and exit from BI receipt and show how the dynamics of self-employment jobs compare to flows in and out of wage and salary work. We find that transition rates into and out of self-employment have been lower than hire and separation rates for wage and salary jobs, implying that self-employment is more stable than the typical wage and salary job.1 We also find differing patterns of cyclicality across subgroups of the self-employed – but as a whole, entry and exit from BI receipt has been less cyclical than hire and separation rates of wage and salary employees. As the cyclicality of labor reallocation has been shown to amplify business cycles (Chodorow-Reich and Wieland, 2020), our finding that entry into and exit from BI receipt is relatively acyclical suggests that self-employment may help dampen business cycle shocks. Finally, we observe a modest trend increase in transition rates into and out of BI receipt, especially during the early 2000s – which is in stark contrast to the dramatic declines in hire and separation rates of wage and salary workers.
These facts provide new insight into the dynamics of this growing segment of the U.S. workforce and imply that incorporating BI receipt into labor reallocation measures should lead to smaller measured declines in recent decades. We find that incorporating self-employment transitions into our labor reallocation measures has a substantial impact on hire and separation rates, reducing the measured declines by 1.3 and 1.4 percentage points respectively (accounting for 8.3% and 8.7% of the observed declines using only wage and salary earnings). However, this reduction primarily works through dampening the measured high volatility among wage and salary jobs observed before the Great Recession and especially before 2000. Measures of hire and separation rates post 2007 are largely unaffected by the inclusion of transitions to and from self-employment. We find much smaller offsetting effects (in the range of 0.1 to 0.2 percentage points) for employer-to-employer transitions as well as transitions into and from nonemployment. This implies that the decline in labor reallocation measured by a broad range of studies including Hyatt and Spletzer (2013) and Davis and Haltiwanger (2014) is a real phenomenon, and not the result of these studies’ omission of the dramatic rise in self-employment over this period.
We further find that most of the offsetting effect of including BI recipients in hire and separation rates can be attributed to jobs that are secondary sources of income, or short in duration. Among such jobs, inclusion of BI recipients offsets 1.1 and 1.2 percentage points of the measured decline in the incidence of hires and separations, respectively. Given that these secondary and short-duration jobs had the most dramatic measured declines among measures of labor reallocation (Hyatt and Spletzer, 2017; Hall and Schulhofer-Wohl, 2018; Pries and Rogerson, 2019), this finding suggests that the increase in the population receiving BI has played a role in the long-run decline in marginal wage and salary jobs.
We next explore the relationship between BI receipt and the number of wage and salary jobs worked. We find evidence that self-employment jobs displace wage and salary jobs, but this occurs primarily for workers who derive the majority of their earnings from self-employment. Self-employment jobs that supplement a worker's wage and salary earnings do not appear to displace secondary wage and salary jobs for these same workers. Further, these differing degrees of crowding out have remained fairly constant over time.
We also explore to what extent the rising prevalence of self-employment may be thought of as true reallocation of labor as opposed to reclassification of work. Put differently, we estimate how much of the growth in self-employment represents a redefinition of firm boundaries, as the tasks are reassigned from wage and salary employees to self-employed contractors, vs. a reallocation of labor to new tasks, as self-employed workers take up tasks that are distinct from the work they had previously done as wage and salary employees. To do this, we identify the number of distinct industries in which an individual works in each year (whether wage and salary or self-employment). To the extent that self-employment represents only a redefinition of firm boundaries, we can expect that the number of industries in which an individual works in a given year will be unaffected by whether the individual is a wage and salary employee or self-employed. Instead, we find that for years in which individuals received BI, they tended to work in 0.43 to 0.44 more industries in that year relative to years they only received wage and salary income (a 34% increase in the number of industries worked in the year). This finding suggests that BI recipients tend to work in new industries rather than the same industries from which they receive wage and salary payments.2 These results indicate that the rise in BI receipt has resulted in greater labor reallocation and thus is likely to be productivity enhancing.
2. Data
There are no standard definitions for the terms “self-employment” and “business ownership.” A wide spectrum of work arrangements may appropriately be captured by these labels, and nuanced language is needed to communicate delineations between some of these types of jobs. This lack of uniformity poses a challenge for surveys that seek to elicit information about the nature of these work arrangements from respondents. For this reason, workers who receive only secondary self-employment earnings are more likely to not report these earnings on surveys. Workers who receive payments from a business as a contract worker but in all other ways appear similar to other wage and salary workers are more likely to misclassify these earnings in survey responses (Abraham et al., 2020).
We use tax reports of self-employment and business ownership earnings to measure participation in these non-traditional work activities for the U.S. In this section, we identify the tax (administrative records) data sources we use to count these jobs and to explore the relationship between BI and labor market fluidity. Using these data, we demonstrate that earnings from the vast majority of these “jobs” are not present in administrative records covering wage and salary jobs and are thus not included in conventional measures of labor market fluidity. In this section, we also define the employment and fluidity measures we use throughout this paper.
2.1. Administrative reporting of wage and salary, self-employment, and business ownership activity and income
Each year, each tax-paying U.S. business reports annual earnings associated with each wage and salary worker on Form W-2, Wage and Tax Statement. For this analysis, we use the universe of W-2 earnings records in each year beginning in 2005. Among business owners and other self-employed, however, the scope of covered activity and the type of information collected each year by the U.S Internal Revenue Service (IRS) varies with the legal form of organization of the business entity. This information is summarized in Table 1.
Table 1
Administrative records data on U.S. wage and salary and BI
| Legal designation | Tax Form/Info. Return | Files Schedule SE? | Survey-based data | Universe data |
|---|---|---|---|---|
| Employee | W-2 Wage and Salary Statement | N/A | Social Security Administration MEF, DER extract, 1991–2015 | W-2 Records 2005–2015 |
| Sole proprietorship | 1040 Schedule C Profit or Loss from Business | If total self-employment income >$400 | Social Security Administration MEF, DER extract, 1991–2015 | Census nonemployer and employer Business Registers 2007–2015 |
| Partnership | Schedule K1: Partner's Share of Income, Deductions, Credits, etc. | If total self-employment income >$400 | Social Security Administration MEF, DER extract, 1991–2015 | Schedule K1 filings 2007–2015 |
| S corporation | Schedule K1: Partner's Share of Income, Deductions, Credits, etc. | No | N/A | Schedule K1 filings 2007–2015 |
| C corporation | Outside the scope of our analysis | No | N/A | N/A |
[i] DER, Detailed Earnings Record; MEF, Master Earnings File; SE, Self-Employment Tax.
The vast majority of self-employed (whether or not they consider themselves business owners) operate as sole proprietors. In addition to owners of conventional businesses, this legal form of organization covers freelancers, contract workers, “gig” workers, etc. Each year, these sole proprietors report their receipts, expenses, and profits on IRS Form 1040 Schedule C Profit or Loss from Business. Information from these Schedule C filings is maintained at the U.S Census Bureau in the Nonemployer and Employer Business Registers. Using these data, we are able to identify business owners beginning in 2007.
Owners of partnerships and S corporations are issued an information report by the business called a Schedule K1 that identifies the owner's ownership share of business profits in a given year and thus their associated ownership earnings. These pass-through entities covered by Schedule K1 may have multiple owners. We include information on these entities linked to their owners for years 2007 through 2015.
In each year, sole proprietors and partners who receive (from all combined ownership activity) net annual earnings above $400 are also required to file a Schedule Self-Employment Tax (SE) with the IRS. The Master Earnings File (MEF) database maintained by the Social Security Administration contains information on BI from Schedule SE filings as well as information on wage and salary earnings from each Form W-2 a person has received during the year. Note that the MEF lacks identifiers for the businesses that Schedule SE filers own. Therefore, the only distinction we can make is whether or not an individual receives BI, not the dynamics associated with the particular businesses that they own.3
2.2. Data sources
We measure the relationship between BI and labor market fluidity using two administrative records datasets. First, we use survey responses linked with administrative records data. Specifically, we use Current Population Survey (CPS) records enhanced with longitudinal administrative records providing information on years 1990–2016. These administrative records data cover wage and salary jobs as well as self-employment spells for sole proprietors and partners.4 Our second data source consists of universe-level administrative records. W-2 wage and salary job records provide information starting in 2005.5 Administrative BI records provide information on all sole proprietors, partnerships, and S corporations (but excluding C corporations) starting in 2007. Using the survey-based dataset, we obtain a much longer time series. The universe-level data allows us to consider a broader population of owners, as well as to distinguish between sole proprietors, partnerships, and S corporations. We describe each of our two datasets below.
2.2.1. Current Population Survey-Detailed Earnings Record (CPS-DER)
Our first dataset is the Annual Social and Economic (ASEC) Supplement to the CPS linked with administrative records on wage and salary earnings, as well as BI. In each year, sole proprietors and partners who receive (from all combined ownership activity) net annual earnings above $400 are required to file a Schedule SE with the IRS. The MEF database maintained by the Social Security Administration contains information on BI from Schedule SE filings as well as information on wage and salary earnings from each Form W-2 a person has received during the year. Our analysis uses an extract (referred to as the Detailed Earnings Record [DER]) that includes MEF records for each CPS respondent for whom a Protected Identification Key (PIK), a person-level longitudinal identifier, is available. Note that the CPS-DER lacks identifiers for the businesses that Schedule SE filers own. Therefore, the only distinction we can make is whether or not an individual receives BI, not the dynamics associated with the particular businesses that they own.
By using the sample weights from the CPS-ASEC in combination with DER administrative information for the same year, our dataset can be used to estimate population-level characteristics of Schedule SE recipients as well as W-2 jobholders in each year. It is worth noting that this linked dataset provides information (including weights) for only those CPS respondents who have received a PIK and are therefore linkable with administrative records data sources. Because not all respondents receive a PIK, we create sample weights that adjust for the likelihood of receiving a PIK.6 Although the DER includes the entire W-2 and Schedule SE history of CPS respondents (back to 1978), we only select jobs observed in the DER in the CPS reference year. This selection ensures that the survey-weighted sample is representative of the U.S. population. Because we produce statistics on entry and exit from wage and salary work and business ownership, for each wage and salary job and self-employment spell observed in the DER in the relevant year, we also include information on that job or spell from the preceding and following year. We use CPS-ASEC responses from 1991 to 2016, linked with administrative records from 1990 through 2016.
2.2.2. Universe-level W-2, Schedule C, and Schedule K1 records
We construct our second dataset from universe-level sources of wage and salary earnings and BI for several legal forms of organization. We use the universe of W-2 records for wage and salary jobs starting in 2005. We obtain sole proprietor ownership spells from the U.S. Census Bureau nonemployer and employer business registers. For partnerships and S corporations, which are required to file with the IRS an annual Schedule K1 form for income tax purposes, we obtain the universe of Schedule K1 data filings from 2007 through 2015.7 Among sole proprietors, we have access to information on the owner (from the legally mandated annual income tax filings of the sole proprietor via the 1040 Schedule C form) from 2007 through 2015. For pass-through entities covered by Schedule K1, each entity may have multiple owners. We have access to information on these entities linked to their owners from 2007 through 2015.8
Our universe-level dataset offers several advantages over the CPS-DER. First, it is universe-level data rather than a sample of the population. Second, it includes S corporations and distinguishes between sources of BI (by legal entity). Third, by obtaining ownership information directly from tax reports, we gain a wealth of information on the entities they own and operate. If an individual has multiple businesses, each with a distinct EIN, then ownership is considered separately for each business. This contrasts with the CPS-DER, which pools together all sole proprietor and partnership earnings for the person in a calendar year and so does not allow this distinction. Fourth, we obtain information on sole proprietors and owners of partnerships who did not file a Schedule SE. Finally, the business identifiers in our universe-level data, along with the universal coverage of wage and salary payments for these businesses, allow us to assess the extent to which business owners receive wage and salary payments.
2.3. Do business owners receive wage and salary payments?
To determine whether BI payments are indeed omitted from wage and salary records, we now examine how often business owners receive wage and salary payments from the businesses they own. To do so, we merge our universe-level business ownership data with the W-2 wage and salary records based on the EIN of the employer and the PIK of the owner. A match on EIN and PIK indicates that, in addition to the BI, the owner also receives wage and salary payments from the owned business.
As shown in Table 2, relatively few business owners received wage and salary income from their businesses. Only 7.4% of sole proprietors and 1.1% of the owners of partnerships received wage and salary income from their businesses. The owners of S corporations were more frequently employees of the businesses that they own, with 40.4% of the owners of S corporations receiving wage and salary income from their owned business. These results indicate that most business owners are not present in employer-reported wage and salary records – and thus BI recipients are generally omitted from labor reallocation statistics. This is because during our time series, sole proprietors and partners were legally prohibited from receiving wage and salary payments. In contrast, the owners of S and C corporations who perform substantial services for their businesses were legally required to receive wage and salary compensation.
Table 2
Share of business owners who receive wage and salary payments
| Schedule C | Form K1 | Form K1 | |
|---|---|---|---|
| Sole Proprietors | Partnerships | S Corps. | |
| Owners of EIN firms in W-2 (%) | 7.4 | 1.1 | 40.4 |
[i] Notes: Authors’ calculations of universe-level W-2, Schedule C, and Schedule K1 records. Percentages indicate the share of businesses owners who receive a W-2 record of the wage and salary income from a business of a particular legal form that they own. EIN, Employer Identification Number.
The results of this exercise have two important implications. First, these findings have important implications for the small literature that, starting with Agarwal et al. (2016) and Kerr and Kerr (2017), assumes that business owners can be found among the higher-earning employees in U.S. matched employer–employee data.9 We find that most BI recipients do not receive wage and salary payments. If the owner of a business does not receive wage and salary payments, selecting that business's high-earning employees will not identify its owner.
Second, these results demonstrate that BI recipients are omitted from most U.S. labor reallocation statistics. Most such measures are derived from employer reports of their payroll data.10 Declines in these statistics are the focus of Hyatt and Spletzer (2013) and Davis and Haltiwanger (2014).
2.4. Measuring labor market transitions
We construct individual-level annual measures of employment, hires, and separations using the concepts developed by Abowd et al. (2009).11 If an individual has no earnings from an employer in one year but positive earnings in the next, we infer a hire in the second year. Similarly, if an individual has positive earnings from an employer in one year, but has no earnings from that employer in the next, we infer a separation in the first year.
Following Hyatt et al. (2014), we also construct annual measures of worker transitions into and out of employment, as well as transitions between dominant employers from one year to the next. We identify a worker's dominant employer at the start of a given year as the employer that: (1) paid the worker positive earnings in both the current and previous year (indicating that the worker was employed at the start of the current year), and (2) paid the highest cumulative earnings, over those two years, among the set of firms that employed the worker at the start of the current year. If an individual's dominant start-of-year employer changes from one year to the next, then we infer an employer-to-employer transition. If a person is employed at the beginning of a year but not at its end, we infer a employment-to-nonemployment transition. Finally, if a person is employed at the end of a year but not at its beginning, we infer a nonemployment-to-employment transition.
3. BI Receipt in the U.S.
We now measure how prevalent BI receipt is in the U.S., and how this has evolved over time. To do so, we consider all income recipients, and what share of them receives BI. The results in this section show that a substantial and growing share of the U.S. population are BI recipients.
We categorize workers into one of three types of employment based on their receipt of wage and salary income and/or BI in a given year. Our first category of income recipients consists of workers who only have wage and salary income. Our second category consists of individuals who only receive BI. Our third category consists of those individuals who receive both BI and wage and salary income. Our calculations here exclude the nonemployed, so these three shares sum to 100% in each year and are exhaustive of the population with positive wage and salary income or BI.
We measure the trends in BI receipt over time. Figure 1A shows that the share of individuals receiving any BI in the CPS-DER records rose 15% between 1991 and 2016. The share with only wage and salary income fell from 90.1% in 1991 to 88.5% in 2016, which corresponded with an increase in the share with any BI from 9.9% to 11.5%.
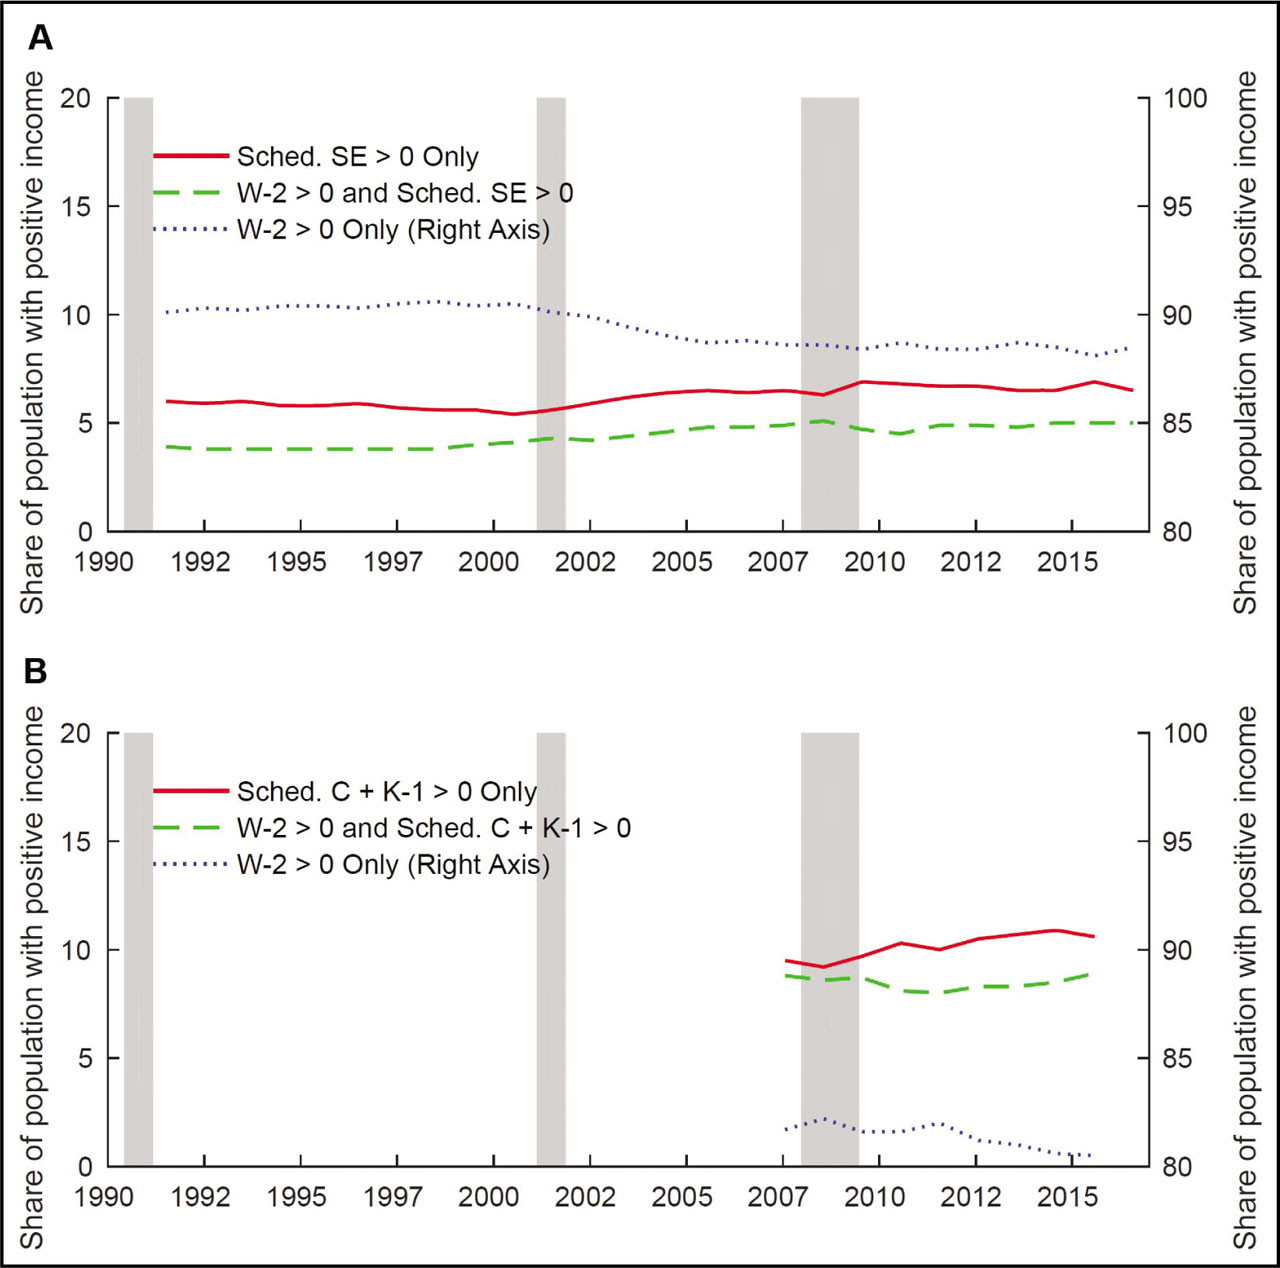
Figure 1
Shares of the population with income in a calendar year, by income source.
Notes: A: CPS-DER W-2 and Schedule SE. B: Universe W-2 and Schedules C and K-1. Authors’ calculations of the CPS-DER W-2 and Schedule SE records, as well as universe-level W-2, Schedule C, and Schedule K1 records. Schedule C covers sole proprietors, and K1 covers partnership and S corporation income. Wage and salary income comes from W-2 records. CPS-DER, Current Population Survey-Detailed Earnings Record; SE, Self-Employment Tax.
A larger fraction of the population received BI in the universe-level data than in the CPS-DER. As shown in Figure 1B, according to the universe-level W-2 and BI records, 19.6% of income recipients received some BI in 2014. Furthermore, BI was the sole source of income for 10.9%. In the CPS-DER (see Figure 1A), a smaller share (11.5%) of income recipients had BI in 2014. The higher share of the population with positive BI in the universe-level data is likely due to the fact that our CPS-DER sample only includes sole proprietors and owners of partnerships who file a Schedule SE. The CPS-DER thus excludes owners of S corporations as well as sole proprietors and owners of partnerships who earn less than $400 in BI or who file a 1040 Schedule C (Profit of Loss from Owned Business) but who do not report self-employment earnings on Schedule SE for any other reason.
Many new BI recipients rely on this income exclusively and the majority of self-employment jobs have since 1991 been workers who have no other source of earnings. This group has grown modestly over time, especially during times of economic downturn. This pattern is consistent with workers who may be detached from or who may not be engaging in traditional wage and salary work, finding stopgap or entry-level work more readily from self-employment. It is worth noting that, following the recession in the early 2000s as well as the great recession, the rise in the share of workers who receive only BI rises and does not return to pre-recession levels. Overall, however, this group has declined as a proportion of all self-employment (the share of individuals with only BI grew from 6.0% of all income recipients in 1991 to 6.5% in 2016 but declined as a proportion of all self-employment from over 60% in 1991 to about 54% in 2014).12 A key take-away of Figure 1A is that many BI recipients also receive wage and salary income. As a proportion of all self-employed, this group has grown from 38% of the self-employed in 1991 to over 43% in 2014.
The broad result of increasing BI receipt echoes earlier findings of Abraham et al. (2018b) and Katz and Krueger (2019). It is important to note that these seemingly modest changes of a couple of percentage points in the share of the population that receives BI reflect important changes in employment and the number of business entities in the U.S. in recent decades. Each percentage point increase in the share of this population corresponds with more than one million new BI recipients, and roughly as many new business entities.13 This finding has important implications for studies that emphasize the decline in the employer business entry rate – which almost exclusively rely on data from the Business Dynamics Statistics (BDS) (Decker et al., 2014; Sedláček and Sterk, 2017; Pugsley and Şahin, 2018). Data from the U.S. Census Bureau (2006, 2019) indicates that the total number of nonemployer business entities increased from 19.5 million in 2004 to 24.8 million in 2016, a proportional increase of about 24%. BDS aggregates for those same years indicate slower growth in the number of employer business entities: from 5.0 million to 5.2 million, a much more modest change of only about 4%. A complete picture of total employment and business dynamism in the U.S. needs to consider both employer and nonemployer businesses.
4. Transition Rates: Wage and Salary, and BI
We now consider the transition dynamics of wage and salary employees as well as BI recipients. This is an important first step because this paper is the first to use federal income tax records to measure labor reallocation rates. We calculate hire and separation rates following the definitions in Abowd et al. (2009). We also calculate entry and exit rates for BI recipients, and this is the first study to consider how these entry and exit rates evolve over time. As described above in Section 2.4, these are defined analogously to hire and separation rates. We present hire and separation rate time series that are consistent with published estimates. We also show that BI receipt is more stable and less cyclical than the typical wage and salary job.
We measure transition rates into and out of BI receipt, and compare these with hire and separation rates for wage and salary employees in Figure 2. The hire and separation rates in Figure 2A show the “stair-step” pattern noted by Hyatt and Spletzer (2013), with strong declines during and after the 2001 and 2007–2009 recessions, and only a modest recovery in the expansions that follow them.14 The universe-level data in Figure 2B confirms strong declines in both the hire and separation rates during and after the 2007–2009 recession.
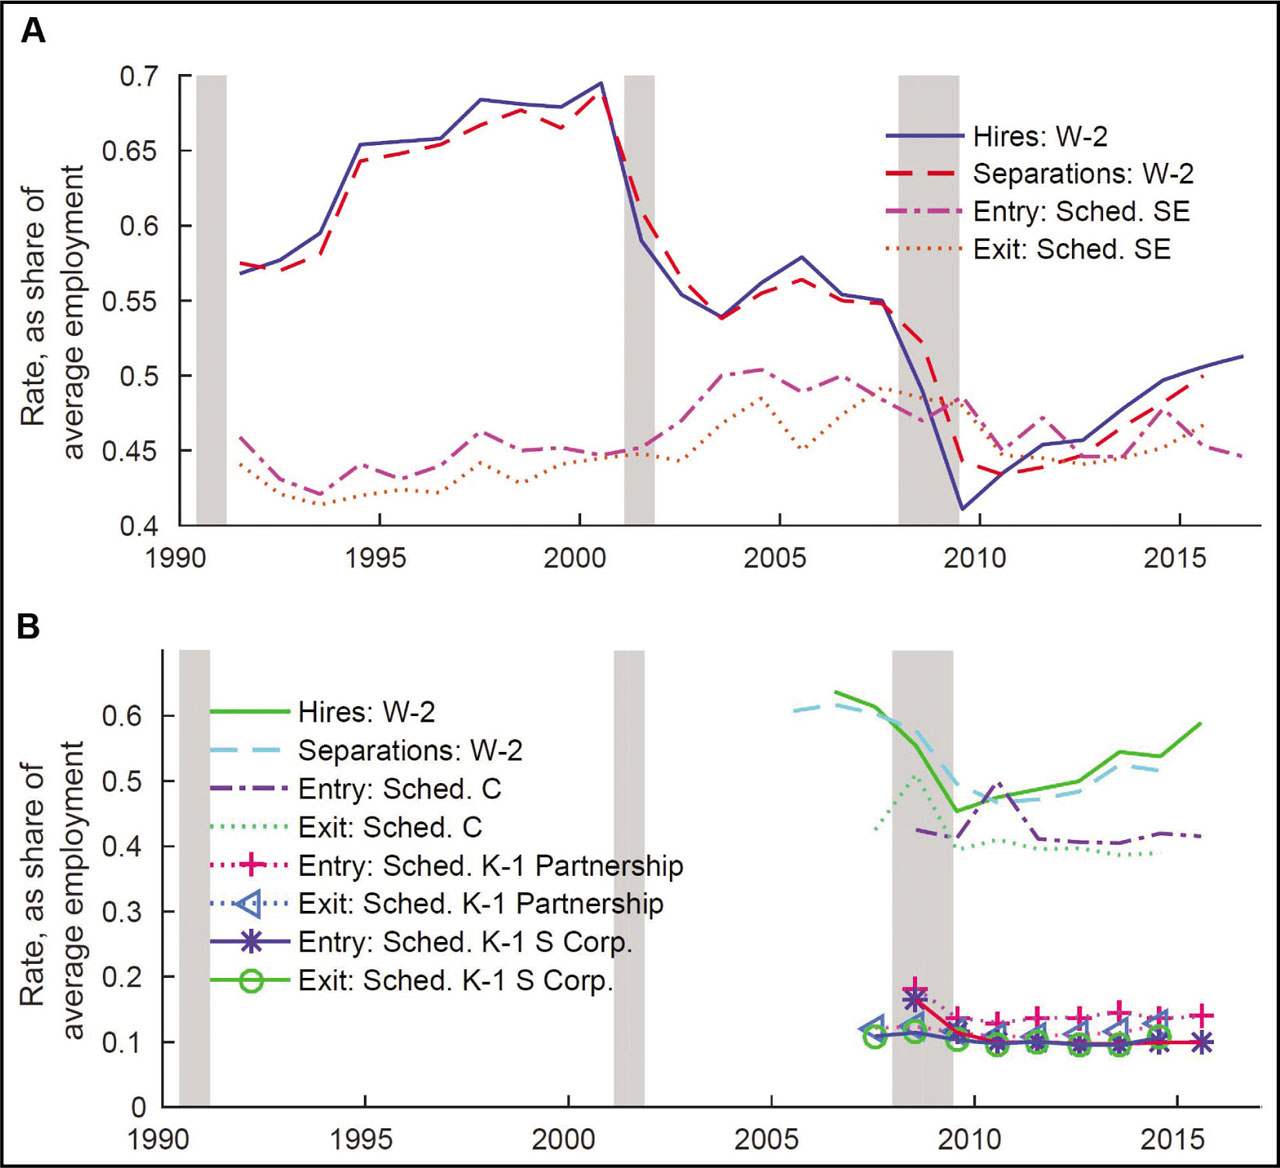
Figure 2
Hire and separation rates vs. BI entry and exit rates.
Notes: A: CPS-DER W-2 and Schedule C. B: Universe W-2 and Schedules C and K-1. Authors’ calculations of CPS-DER W-2 and Schedule SE records, as well as universe-level W-2, Schedule C, and Schedule K1 records. Entry indicates zero BI in the previous year and positive BI in the current year. Exit indicates positive BI in the current year but zero BI in the subsequent year. Denominators for each rate are the average of total number of owners of the given entity type at the beginning and end of the year. BI, business income; CPS-DER, Current Population Survey-Detailed Earnings Record; SE, Self-Employment Tax.
Figure 2A shows three facts which indicate that incorporating BI receipt into our measures of hire and separation rates should result in series that are lower in magnitude, exhibit less cyclicality, and have less of a trend decline. First, prior to the 2007–2009 recession, the wage and salary hire and separation rates were consistently higher than BI entry and exit rates, and this difference peaked at 24.8 percentage points immediately prior to the 2001 recession. Second, BI entry and exit rates were less cyclical than wage and salary hire and separation rates. Third, BI entry and exit rates did not show evidence of trend declines. The entry rate was virtually unchanged from 45.9% in 1991 to 44.6% in 2016. The exit rate increased slightly from 42.9% in 1990 to 46.7% in 2015.
Using universe-level BI records, we find that the rate of BI entry and exit differed substantially by legal form of organization. Figure 2B shows that sole proprietor businesses had entry and exit rates between 38% and 52%, whereas the BI entry and exit rates for partnerships and S corporations were about two to four times lower (ranging from 9% to 19%).15
These findings provide guidance on how omitting the self-employed and business owners affects measured labor reallocation rates. The hire and separation rates derived from our W-2 data are similar to most published data series and therefore are consistent with the findings of Hyatt and Spletzer (2013) and Davis and Haltiwanger (2014) on changes in the hire and separation rates in recent decades. Our findings on stable BI entry and exit rates contrast with the evidence presented by Decker et al. (2014) and Pugsley and Şahin (2018) on the declining entry and exit rates of specifically employer businesses. Overall, our results indicate that including BI transitions should lower the magnitude and cyclicality of labor reallocation rates. We explore this in the following section.
5. Implications for the Long-Run Trend in Labor Market Fluidity
We now assess the implications of excluding BI recipients from measures of labor market fluidity. To do so, we first compute standard measures of labor reallocation using wage and salary payments alone. We then recompute these labor reallocation measures treating the receipt of BI as though it were a wage and salary job. To the extent that BI receipt captures labor conducted by the recipient on behalf of the owned business, this allows us to measure the effect of using more inclusive definitions of labor reallocation.16
The following exercises demonstrate that increasing BI receipt explains a small but nontrivial share of declining hires and separations. We further show that this offsetting effect occurs mainly among jobs that are secondary sources of income, or short in duration. The employer-to-employer transition rate is relatively unaffected by including or excluding BI recipients. These findings imply that self-employment, including that associated with the rise of the “gig economy,” is an increasingly important opportunity for temporary employment.
5.1. Hire and separation rates
We now include BI recipients when we calculate hire and separation rates. For comparison, we also show hire and separation rates using W-2 data alone. Figure 3 shows results using the CPS-DER. Because BI recipients constituted only 6–9% of consecutive-year employment in the CPS-linked records, the more inclusive hire (Figure 3A) and separation (Figure 3B) series mimic those created using only W-2 records of wage and salary income.17
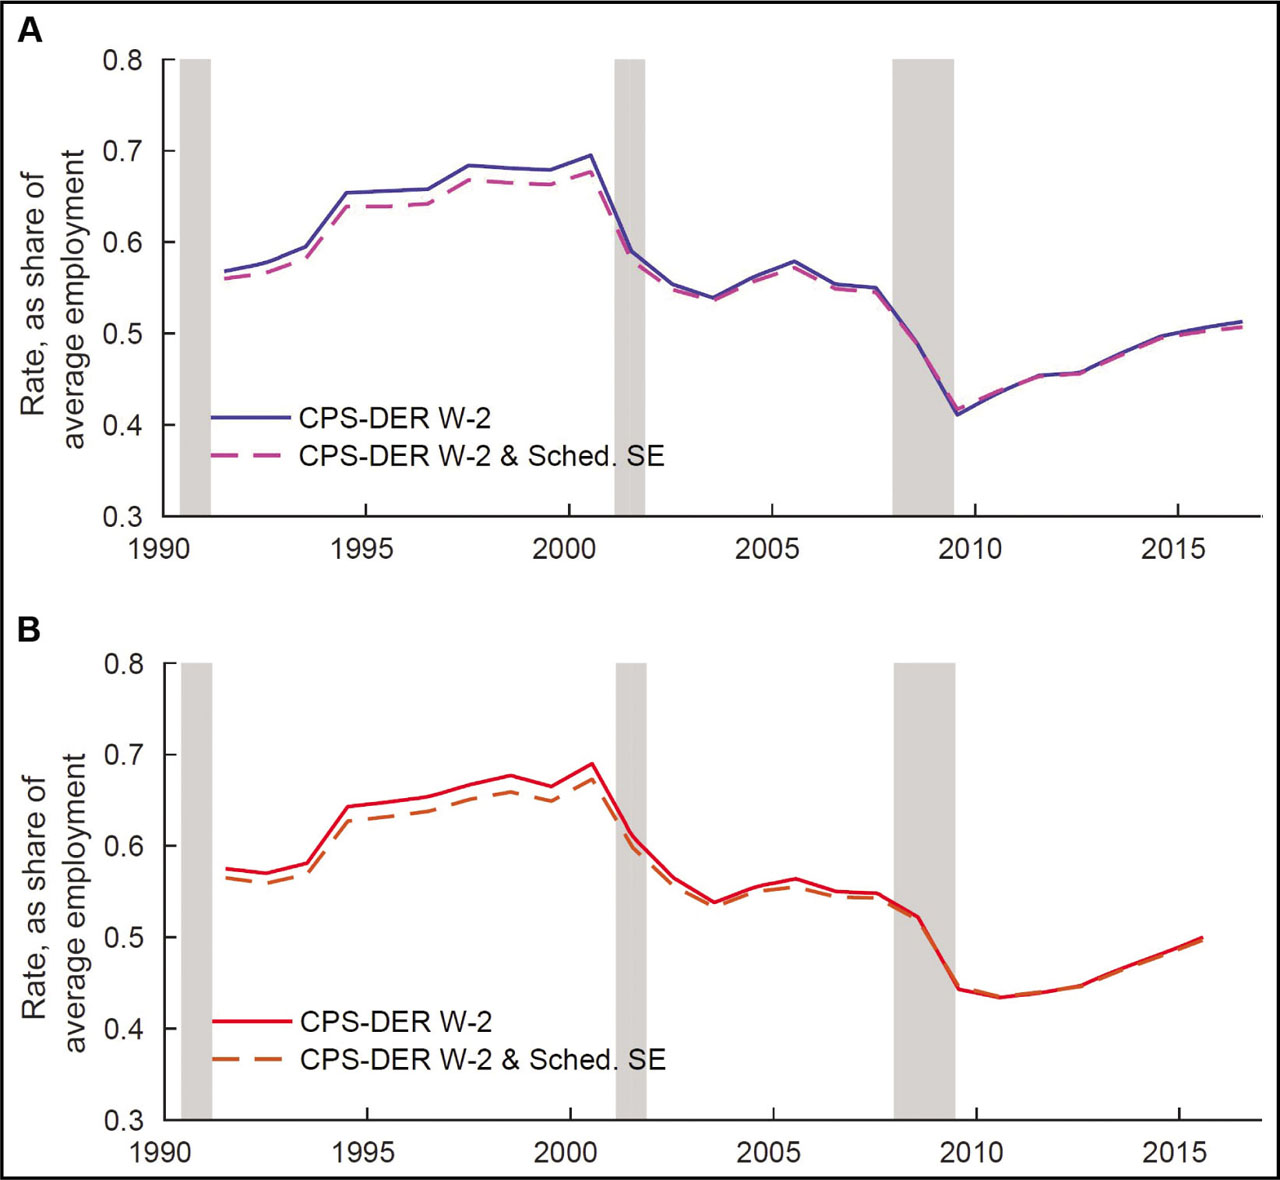
Figure 3
Hires and separations.
Notes: A: Hires. B: Separations. Authors’ calculations of CPS-DER W-2 and Schedule SE records, as well as universe-level W-2, Schedule C, and Schedule K1 records. CPS-DER, Current Population Survey-Detailed Earnings Record; SE, Self-Employment Tax.
Because BI entry and exit rates were lower than wage and salary hire and separation rates up until the 2007–2009 recession, the more inclusive hire and separation rates tended to be lower than those that relied on the W-2 wage and salary records only. The differences between these hire and separation rates were largest in the 1990s, peaking in 2000 at 1.8 percentage points. As the wage and salary hire and separation rates fell during the 2001 and the 2007–2009 recessions, the relative acyclicality of the BI entry and exit rates caused the gap between the combined and W-2 only hire and separation rates to shrink – such that from 2008 onward the difference never exceeded 0.6 percentage points. Including BI receipt in the calculation of hire and separation rates also reduces the measured decline from 1990 to 2016, since the large gap observed in the 1990s between the BI entry and exit rates vs. the W-2 hire and separation rates had largely disappeared by 2009.18
5.2. Employer-to-employer and nonemployment transitions
In Figure 4, we consider how including BI can affect the employer-to-employer transition rate, as well as the rate at which workers transition into and out of nonemployment. We find that including BI has little effect on these reallocation rates.19
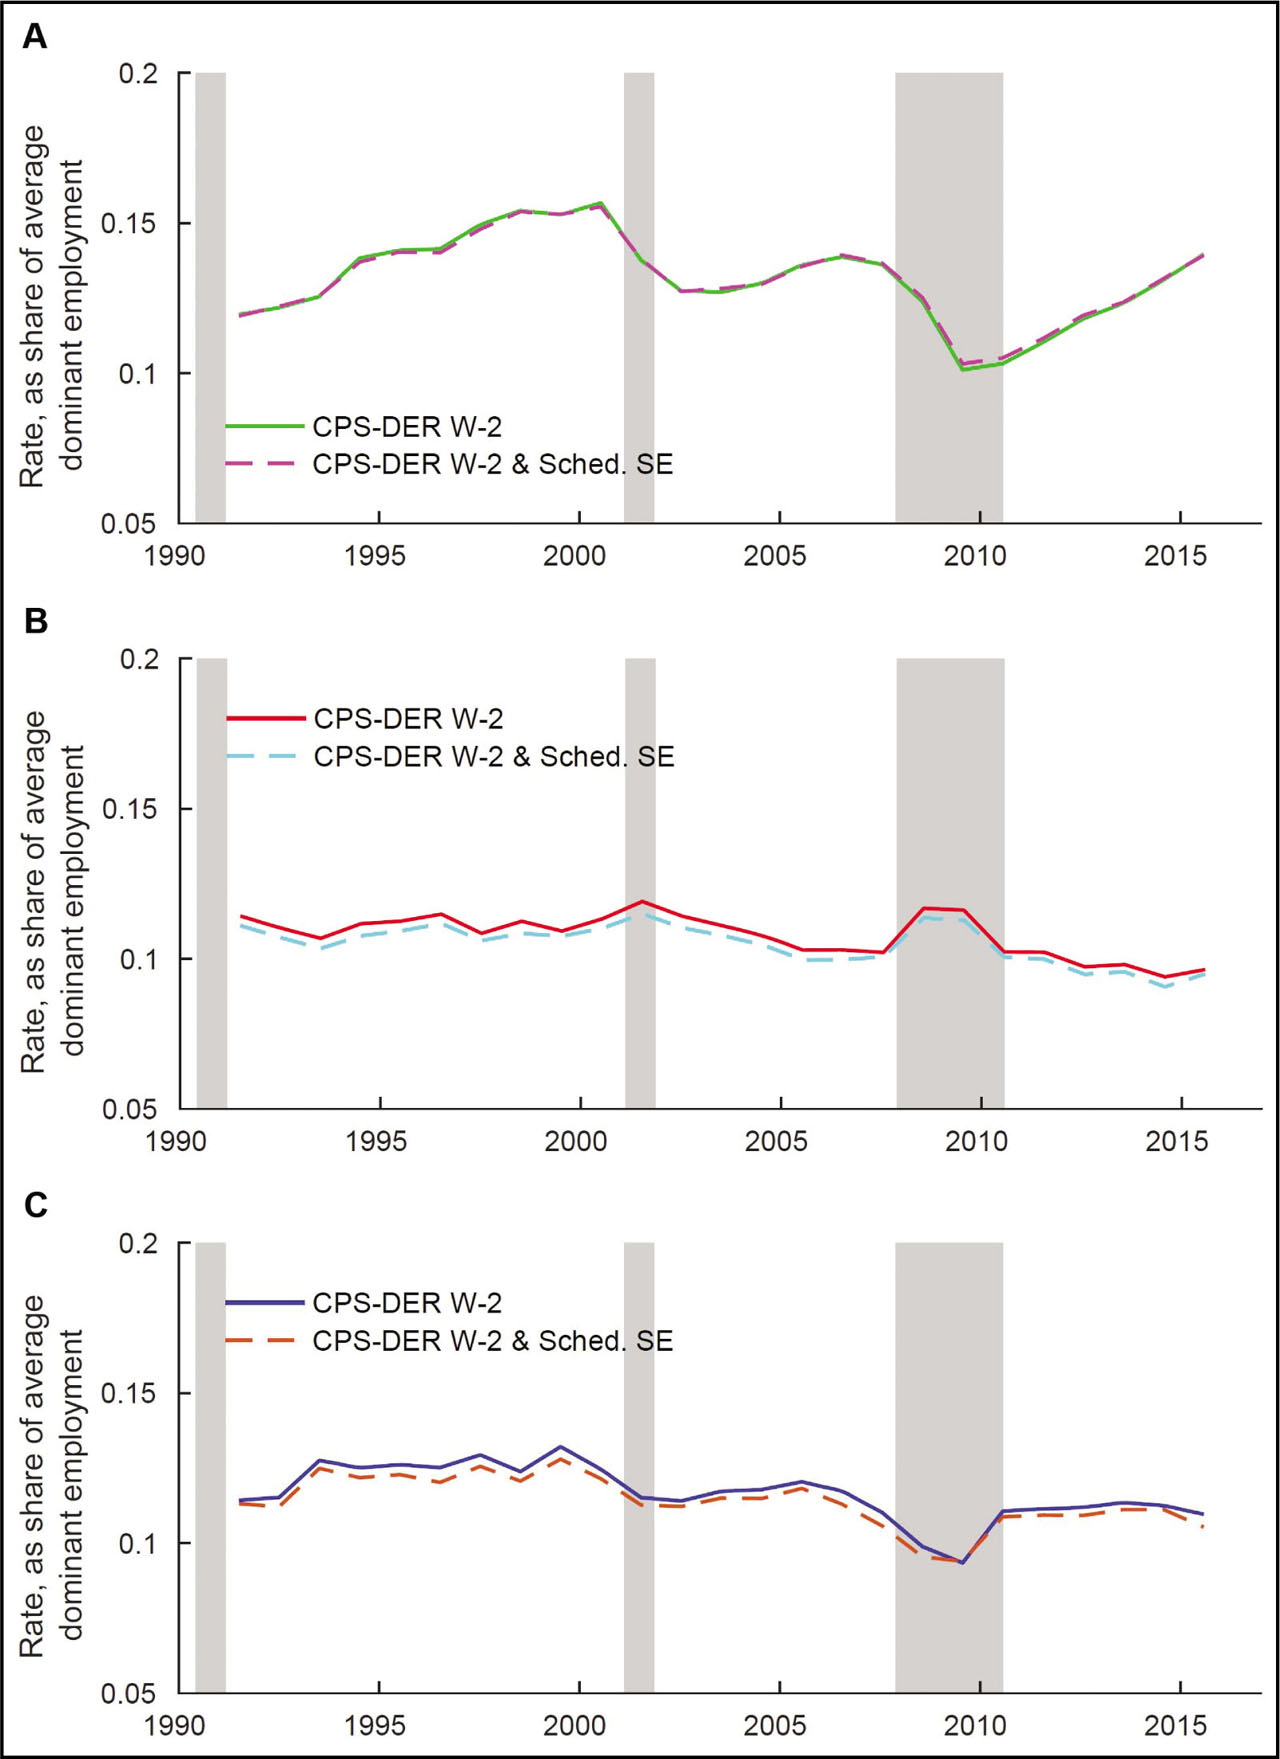
Figure 4
Employer-to-employer and nonemployment transitions.
Notes: A: Employer-to-employer. B: Employment-to-nonemployment. C: Nonemployment-to-employment. Authors’ calculations of CPS-DER W-2 and Schedule SE records, as well as universe-level W-2, Schedule C, and Schedule K1 records. CPS-DER, Current Population Survey-Detailed Earnings Record; SE, Self-Employment Tax.
The employer-to-employer transition rate evolved in a basically identical manner whether we include or exclude the self-employed, as shown in Figure 4A. In the CPS-DER, differences between the employer-to-employer transition rate using W-2 data alone, relative to that which includes BI recipients, were at most 0.2 percentage points. As a result, the long-term evolution of the employer-to-employer transition rates including and excluding BI recipients are also virtually identical. Both series increase by about 2.0% from 1991 to 2015.
Results for employment-to-nonemployment transitions are shown in Figure 4B. Again, the rates are similar whether including or excluding BI recipients. In the CPS-DER, transition rates including only wage and salary employment to nonemployment were consistently higher than those same transition rates that include BI recipients, by 0.1 to 0.5 percentage points. Such evidence is consistent with transitions between wage and salary work and self-employment being omitted from employer-reported administrative records. Using employer-reported administrative records alone, such moves may appear to be into or from nonemployment.
Results for nonemployment-to-employment transitions, shown in Figure 4C, tell a broadly similar story. Transition rates excluding BI recipients were almost always higher than those that include them, by as much as 0.6 percentage points (the exception is 2009, when they were lower by less than 0.1 percentage point).
5.3. Secondary and short-duration jobs
The decline in labor reallocation rates in recent decades was concentrated among jobs that provided secondary income or were short in duration. Hire and separation rates capture transitions into and out of all wage and salary jobs. The dominant employer-based measures of worker reallocation, on the other hand, capture only transitions to or from an individual's dominant employer as of the start of the year. Thus, these dominant employer-based measures of worker reallocation omit both of the following: (1) coincident, but lower earning jobs (“secondary jobs”); and (2) jobs that start and end within the same calendar year (“short-duration jobs”). As formalized by Hyatt and Spletzer (2013), the residual between the hire and separation rates and these dominant employer-based measures are precisely these secondary and short-duration jobs.20
We plot these transitions in Figure 5, both using W-2 data alone, as well as using data on BI. The results are similar to those in Figure 3. Secondary and short-duration jobs followed the “stair-step” pattern noted by Hyatt and Spletzer (2013). These jobs declined during the 2001 recession, were stable between 2002 and 2006, and then declined again during the 2007–2009 recession. Secondary and short-duration jobs were the main driving force in the stair-step pattern in overall hires and separations, consistent with the findings of Hyatt and Spletzer (2017). Including BI recipients in the calculation of secondary and short-duration hires and separations lowers labor reallocation rates by nearly a percentage point in the 1990s, but by only 0.2 to 0.3 percentage points in more recent years. This differential shows that the inclusion of BI recipients has a substantial offsetting effect on the measured decline in the hire and separation rates for secondary and short-duration jobs.
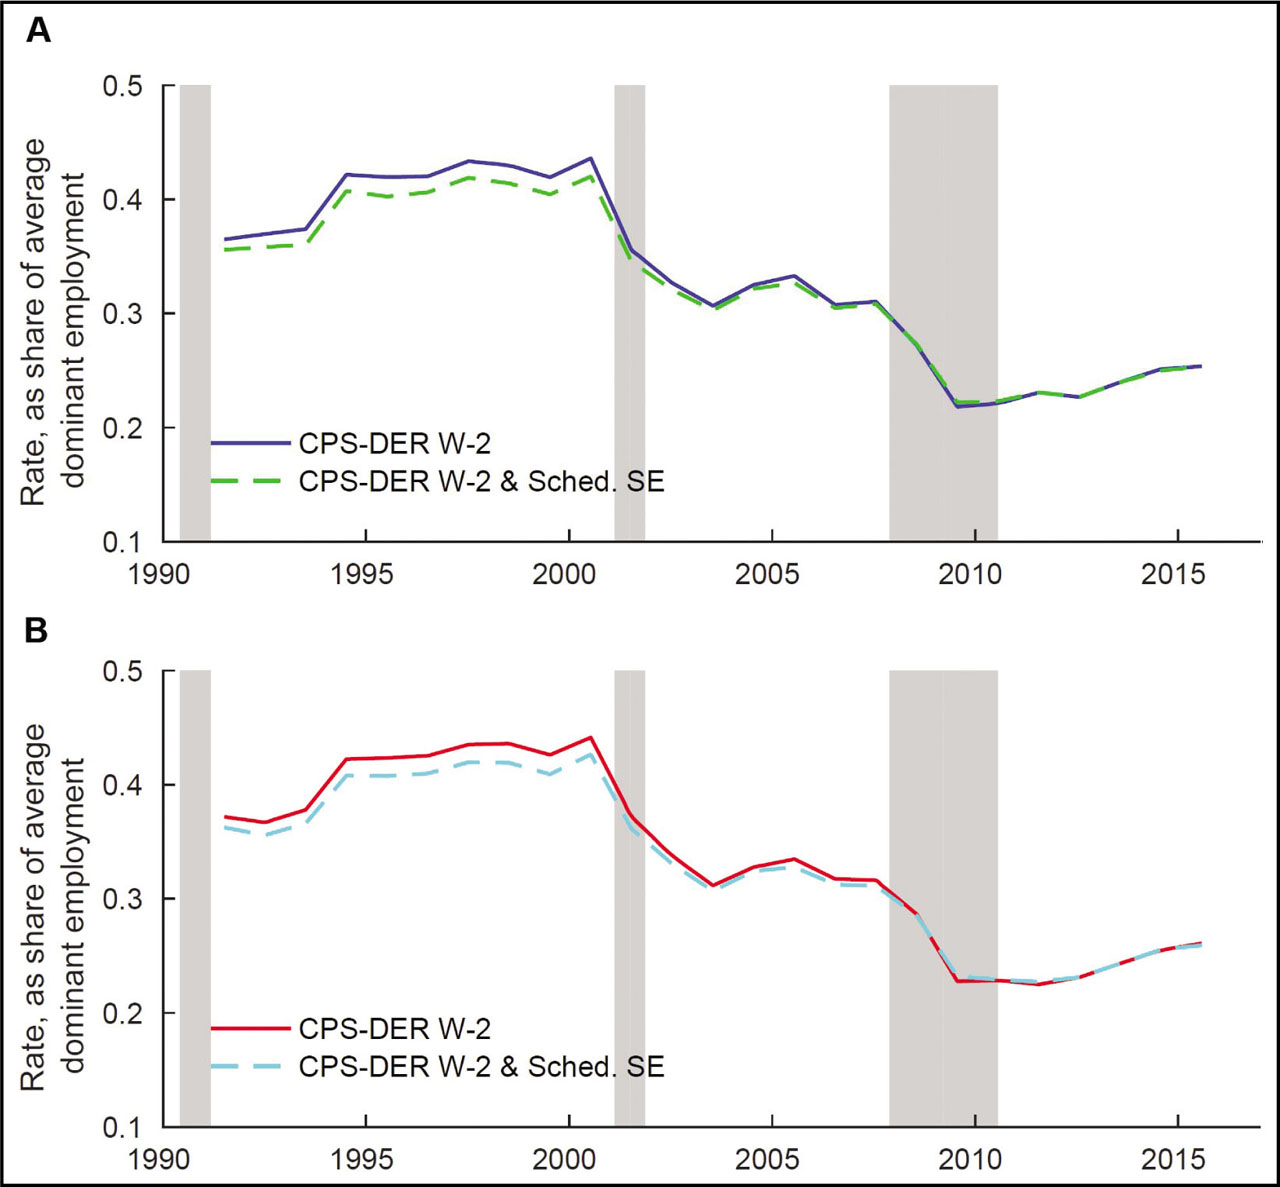
Figure 5
Secondary and short-duration job hires and separations.
Notes: A: Hires. B: Separations. Authors’ calculations of CPS-DER W-2 and Schedule SE records. CPS-DER, Current Population Survey-Detailed Earnings Record; SE, Self-Employment Tax.
5.4. BI dynamics and labor market fluidity
The inclusion or exclusion of business owner income affects the empirical measures that are used to assess changes in labor market fluidity and the extent of its decline. We summarize our findings in Table 3, which considers our results from the CPS-DER for the years 1994 and 2014. We choose these particular years to assess the trend decline in labor market fluidity for three reasons. First, 1991 was a recession year, and so its low transition rate is likely due to cyclical factors rather than any trend change. Second, 2015 is the last year which can be calculated given available data, and so is most likely to be subject to revision with updates to the administrative records data. Third, the increase in the transition rates from 1993 to 1994 was the largest in most of our labor reallocation time series. These large increases were also coincident with a redesign of the CPS, and so may not have been driven by economic conditions.
Table 3
Measured decline in reallocation (percentage points) including vs. including self-employed: 1994 vs. 2014
| Reallocation Measure | Decline in W-2 | Decline in W-2 & Schedule SE | Difference | Percent offset (%) |
|---|---|---|---|---|
| Hires | 15.7 | 14.4 | 1.3 | 8.3 |
| Separations | 16.1 | 14.7 | 1.4 | 8.7 |
| Employer-to-employer | 0.7 | 0.6 | 0.2 | 23.8 |
| Employment-to-nonemployment | 1.8 | 1.7 | 0.1 | 4.1 |
| Nonemployment-to-employment | 1.3 | 1.1 | 0.2 | 15.6 |
| Secondary/short-duration hires | 13.9 | 12.8 | 1.1 | 7.4 |
| Secondary/short-duration separations. | 13.8 | 12.6 | 1.2 | 8.9 |
[i] Notes: Authors’ calculations of CPS-DER W-2 and Schedule SE records. The “Difference” and “Percent offset” columns may not exactly correspond with the difference between the “Decline in W-2” and “Decline in Schedule SE” columns due to rounding. CPS-DER, Current Population Survey-Detailed Earnings Record; SE, Self-Employment Tax.
Because BI entry and exit rates were stable over time, and, during the 1990s, much lower than wage and salary hire and separation rates, their inclusion lowers the total measured decline in the hire (separation) rate by 1.3 (1.4) percentage points. The inclusion of BI receipt therefore offsets 8.3% (8.7%) of the decline in the hire (separation) rate. The inclusion of BI receipt also offsets some of the measured declines in the employer-to-employer, employment-to-nonemployment, and employment-to-nonemployment transition rates, but the magnitude of these declines was smaller in magnitude (only offsetting 0.1 to 0.2 percentage points change in each measure). The residual comparing these measures with each other is secondary and short-duration jobs, which (mechanically) end up being the dominant mechanism by which rising BI receipt offsets the measured declines in hire and separation rates. Inclusion of BI receipt changes the measured decline in the secondary and short-duration job hire rate by 1.1 percentage point (from 13.9% to 12.8%) and its separation rate by 1.2 percentage points (from 13.8% to 12.6%).
These findings highlight the importance of increasing BI receipt on understanding changes in labor market fluidity, both on the underlying economic phenomena as well as the measurement issues. Declines in measured labor market fluidity are concentrated among hires and separations into and from jobs that either provide relatively little income, or do not last very long. Secondary and short-duration BI receipt have become more prevalent in the U.S., while over these same decades wage and salary jobs have disappeared. The magnitudes of these changes are, however, very different. Therefore, the offsetting effect is about an order of magnitude smaller than the decline in hire and separation rates.
6. Labor Reallocation vs. Reclassification
The preceding section provides evidence that the inclusion or exclusion of BI affects the measured decline in labor reallocation rates. In this section, we follow workers as they transition between wage and salary work and BI receipt to further refine our understanding of the economic significance of these flows.
We first explore the extent to which BI receipt displaces workers’ wage and salary jobs; as well as how this has changed over time. In some cases, BI receipt may indicate that workers switched their labor activity from wage and salary jobs to self-employment, resulting in workers having fewer wage and salary jobs in years when they receive BI. Alternatively, when engaging in self-employment work, workers may tend to retain their existing jobs while expanding into new sources of earnings.
We seek to assess whether transitions between wage and salary employment and BI receipt represent efficiency-enhancing labor reallocation. For example, if such a transition occurs because a company changed the legal structure of the employment agreement with a worker from being a wage and salary employee to being a self-employed contractor, then this transition does not improve the efficiency of the labor market. We therefore explore to what extent the self-employment activity takes place within the same broad industry sector as the wage and salary job(s). For example, to the extent that ridesharing platforms encourage wage and salary taxi drivers to switch to being self-employed drivers on the ridesharing platforms, then these transitions may be thought of as within-industry reclassification rather than efficiency-enhancing labor reallocation. If, instead, BI receipt tends to diversify the industry composition of the work performed by an individual, then the self-employment activity is more likely to represent efficiency-enhancing labor reallocation.
The results that follow suggest that rising self-employment represents reallocation. This is especially true for the volatile tail of secondary and short-duration jobs. We show that when self-employment is a person's dominant source of income, it displaces about one wage and salary job. However, we find a much smaller relationship among secondary jobs. We further find that BI recipients increase the number of industries in which they work. Both of these findings suggest that self-employment is an increasingly important component of productivity-enhancing labor reallocation.
6.1. Does BI substitute for wage and salary jobs?
To examine the degree of displacement of wage and salary jobs by BI receipt, we conduct a regression analysis. Our specifications exploit within-person, over-time variation in self-employment status. Our outcome variable of interest is the number of wage and salary jobs held in a given calendar year. If movement into self-employment represents an expansion of the intensity of individuals’ labor activity, then we would expect less than a one-for-one fall in wage and salary jobs.21
Results are shown in Table 4. We regress the number of wage and salary jobs held by an individual on an indicator for whether the individual is self-employed in that year. We report estimation results for regressions performed both with and without worker-specific fixed effects. We consider all individuals who worked in wage salary or self-employment, and include an indicator as to whether a worker ever received self-employment income. In a typical year, workers who are ever self-employed work a small fraction (0.074 to 0.081) of a job more than workers who only ever have wage and salary earnings.
Table 4
Number of wage and salary jobs worked regressed on BI
| CPS-DER | Universe | |||
|---|---|---|---|---|
| Intercept | 1.420*** (0.000) | 1.409*** (0.000) | ||
| Ever BI | 0.074*** (0.000) | 0.081*** (0.001) | ||
| Ever BI* BI | −0.143*** (0.001) | −0.101*** (0.001) | −0.088*** (0.001) | 0.013*** (0.001) |
| Ever BI* BI*BI dom | −1.002*** (0.001) | −0.818*** (0.001) | −1.010*** (0.002) | −0.817*** (0.001) |
| Worker fixed effects | N | Y | N | Y |
| R2 | 0.096 | 0.446 | 0.151 | 0.652 |
[i] Notes: Authors’ calculations of CPS-DER W-2 and Schedule SE records, as well as universe-level W-2, Schedule C, and Schedule K1 data. Regressions estimate how the number of jobs worked differ based on an individual's BI. BI, business income; CPS-DER, Current Population Survey-Detailed Earnings Record; SE, Self-Employment Tax.
In years with positive earnings, workers received earnings from almost one and a half employers if they received only wage and salary income. Specifically, they worked at 1.409 to 1.420 employers if never self-employed, and 1.490 (=1.409+0.081) to 1.494 (=1.420+0.074) if ever self-employed. Self-employment income displaced wage and salary jobs, but there were substantial differences depending on whether it constituted a worker's dominant form of income. If self-employment provided secondary income, it displaced at most a small fraction (–0.013 to 0.143) of a wage and salary job. In contrast, if self-employment was a worker's dominant form of income, it displaced about one (0.804 to 1.145) wage and salary job. This suggests that the secondary self-employment generates increased labor activity.22
Has the relationship between BI receipt and wage and salary work changed over time? To address this question, we estimate a regression specification in which we allow for the effect of the presence of BI to vary by year. Separately by year, we estimate the effects of BI receipt, as well as the BI being the individual's dominant source of income. We additionally control for year effects. Results of this specification are presented in Figure 6.
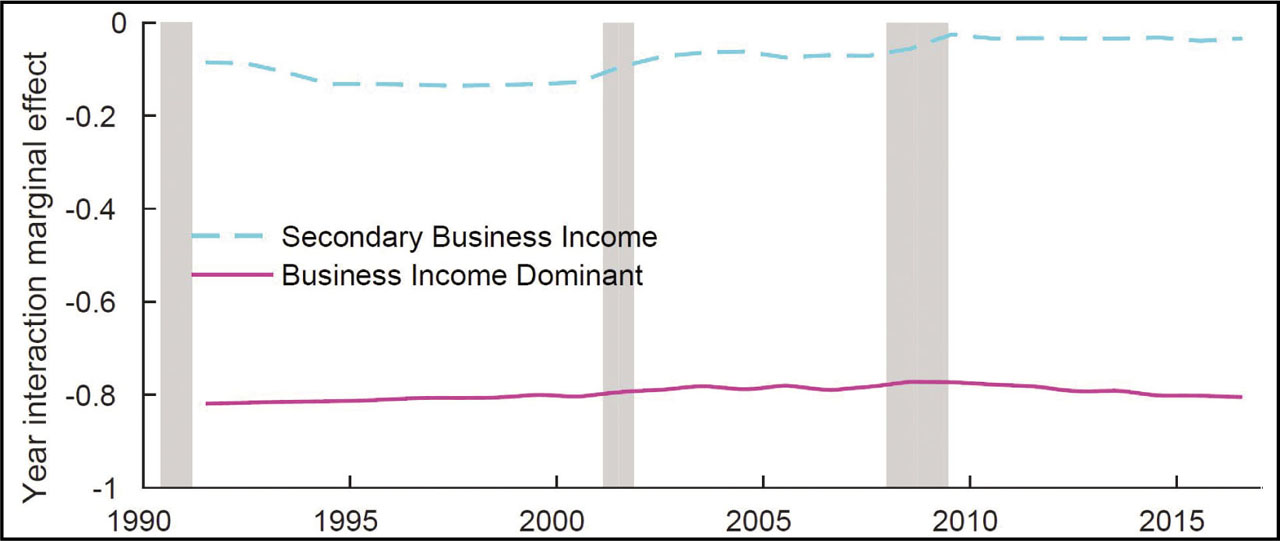
Figure 6
Regression point estimates over time.
Notes: Authors’ calculations of CPS-DER W-2 and Schedule SE records. Plots show point estimates from a regression with the number of wage and salary jobs worked in a given year. Specifically, the year interactions for primary and secondary income from self-employment in a given calendar year. CPS-DER, Current Population Survey-Detailed Earnings Record; SE, Self-Employment Tax.
A substantial change occurred in the relationship between BI receipt and the number of wage and salary jobs if the BI was the individual's secondary source of income. In the 1990s, secondary self-employment income was associated with 0.085 to 0.136 fewer wage and salary jobs. But in the years that followed the 2007–2009 recession, the presence of secondary self-employment income was associated with a reduction of only 0.032 to 0.039 fewer wage and salary jobs. Secondary income from self-employment never displaced a substantial number of wage and salary jobs and that this small degree of substitution has lessened over time. In contrast, if the BI was a person's dominant source of income, then BI receipt is associated with an additional eight-tenths fewer wage and salary jobs, and this differential was stable over time.
6.2. Within vs. across industry reallocation
We now explore the extent to which self-employment is associated with individuals working in a more diverse set of sectors. If individuals work in more industries when receiving BI, this suggests that transitions into self-employment represent efficiency-enhancing labor reallocation. Specifically, we assess the extent to which BI receipt displaces wage and salary jobs where the outcome variables are both the total number of jobs held during the year (wage and salary plus self-employment) and total number of unique North American Industry Classification System (NAICS) supersectors in which the person worked in the year. The key explanatory variables are variables indicating whether the person is receiving BI and whether the BI is the person's dominant (highest) source of earnings in the year. We have NAICS supersector information for the years 2002–2015, so we run regressions on this subsample of the CPS-ASEC respondents with wage and salary earnings or self-employment earnings in the CPS-DER. The linked dataset includes individuals who are age 16 or older at the time of the CPS survey and who have received a PIK. Individuals are included in this sample for all years during 2002–2015 in which they are aged 16+ and have (1) wage and salary earnings with at least one job with non-missing NAICS code in Business Register, or (2) self-employment earnings with non-missing NAICS supersector.
Results of this exercise are presented in Table 5. Workers were employed in 1.258 industries, on average, when working in wage and salary employment. Overall, the presence of BI was associated with 0.431 to 0.444 additional industries worked. We further distinguish the effect of BI on the number of industries worked based on whether it provided an individual's main source of income. Secondary self-employment income is associated with 0.384 to 0.392 more total industries. When self-employment was a person's dominant source of income, that person worked in 0.508 (= 0.392 + 0.116) to 0.547 (= 0.384 + 0.163) additional industries.
Table 5
Number of industries worked regressed on BI
| Total industries | ||||
|---|---|---|---|---|
| Intercept | 1.258*** (0.000) | 1.258*** (0.000) | ||
| BI | 0.444*** (0.001) | 0.431*** (0.001) | 0.384*** (0.001) | 0.392*** (0.002) |
| BI*BI dom | 0.163*** (0.002) | 0.116*** (0.002) | ||
| Worker fixed effects | N | Y | N | Y |
| R2 | 0.053 | 0.406 | 0.055 | 0.407 |
[i] Notes: Authors’ calculations of CPS-DER W-2 and Schedule SE records. Regressions estimate how the number of industries worked differ based on an individual's BI. BI, business income; CPS-DER, Current Population Survey-Detailed Earnings Record; SE, Self-Employment Tax.
These findings suggest that self-employed individuals, whether self-employment is their dominant or secondary source of earnings, tend to work in new industries rather than the same industries as their wage and salary employment. More broadly, these findings provide further evidence that the observed rise in self-employment has led to reallocation of work across broad sectors of the economy and has been an important contributor to labor market fluidity.
6.3. Reallocation vs. reclassification: taking stock
Our regression evidence implies that BI receipt is associated with increased labor reallocation. Side jobs from self-employment do not displace wage and salary jobs. When workers are BI recipients, they work in more industries. This evidence suggesting that increasing BI receipt is not mere reclassification echoes findings from Collins et al. (2019). This earlier study demonstrated that the number of recipients of 1099 forms (which are sent by online platforms to “gig” workers) has not kept pace with the rise in Schedule C filings. Our results not only provide additional evidence that increasing BI receipt is not mere reclassification but also indicate that workers are moving into this work as demand conditions indicate. This evidence suggests that increasing BI receipt plays an increasingly important role in productivity-enhancing labor reallocation.
7. Conclusion
Our paper explores the relationship between the rising share of the U.S. population receiving BI and the declining dynamism of the U.S. economy, specifically through the lens of labor reallocation. We show that most business owners do not receive wage and salary payments from their owned businesses; and therefore they are largely omitted from current studies of labor reallocation. We find that including BI recipients in measures of labor market fluidity reduces the measured decline in the rate of hires and separations from 1994 to the early 2014 by 1.3 to 1.4 percentage points (about 8.3–8.7%), primarily among jobs that were secondary sources of income or short in duration.
Complimenting recent studies that show a growing prevalence of self-employment (such as Abraham et al. (2018a) and Jackson et al. (2017)); this paper documents similar increases in BI receipt using new administrative tax records for the U.S. Remarkably, we find that one-in-five income recipients in the U.S. received BI in 2014. We show that in the second decade of our sample (between 2004 and 2014), the rise in self-employment largely represents an expansion of new supplemental earnings opportunities, as these self-employment jobs are increasingly held by workers who derive the majority of their earnings from traditional wage and salary work.
Our paper relates to the literature on the role of legal protections in fostering business activity. Our finding that transitions into and out of self-employment differ based on the legal structure of the self-employment activity indicates a potential link between legal protections for self-employment activity and the stability of that activity. We find that self-employed individuals who identify as sole proprietors (and thus are personally liable for the self-employment activity) enter into and exit from self-employment at rates that are almost as high as wage and salary workers’ hire and separation rates. When, however, the self-employed individuals use more complex legal structures that better shield themselves from legal liability, we find that the self-employment activity is far more stable (with transition rates about 75% lower than those of sole proprietors).
Our findings on labor reallocation, in conjunction with the rising prevalence of self-employment, highlight many open questions that we hope future research can address. First, as we have shown with labor reallocation, labor market dynamics, both over the business cycle and in the long run, can change when the self-employed are included in our labor market statistics. Identifying which measures of labor market dynamics are sensitive vs. robust to the inclusion of the self-employed will further our understanding of the labor market. The importance of ensuring that labor market statistics accurately capture these dynamics is underscored by the fact that many of these measures of labor market dynamics inform current fiscal and monetary policy.
Second, we observe both of the following: (1) the growth in self-employment is more pronounced for individuals where it is a secondary source of income; and (2) including the self-employed mitigates more of the declines in hire and separation rates for short-duration and secondary jobs. These findings underscore the need for further analysis of the role of self-employment in helping individuals compensate for slack labor demand. This need is most acute for studies of individuals who are marginally attached to the labor market, as they are more likely to hold multiple jobs or be employed in short-duration jobs.
Third, there is the question of the relationship between the changing dynamics of employer and nonemployer businesses. As we have noted, the steady increase in BI recipients is in stark contrast to contemporaneous trends in employer business activity as considered by Decker et al. (2014) and others. It is therefore plausible that these trends are related, and that the increasing dynamism of nonemployer businesses represents economic activity that was formerly the purview of employer businesses. While this remains an important question for future research, our results provide some guidance on the nature of this shift. Our results on the relationship between BI receipt and the number of jobs and industries worked in Section 6 suggest a limited role for firms reclassifying wage and salary workers as independent contractors. These results echo the findings of Collins et al. (2019), who show that Form 1099 filings have not kept pace with the number of Schedule C sole proprietor businesses. Therefore it is unlikely that this shift is the direct action of larger, employer businesses. We therefore suggest that future research do more to systematically characterize the increase in nonemployer businesses that has occurred in the U.S. in recent decades.
Finally, our research adds to the growing body of work that documents the considerable and increasing diversity among self-employed workers. As we show in this paper, workers who derive all of their earnings from self-employment, though on the rise during economic downturns, are a declining share of the self-employed overall as are owners of partnerships and S corporations. Jackson et al. (2017) document a rise in the share of self-employed workers with low levels of deducted business expenses, suggesting that the self-employed are increasingly composed of workers supplying primarily labor. Exploring possible differences in economic status and differences in fluidity across these different groups remains an opportunity for future research. Abraham et al. (2018b) document substantial change in the demographics of self-employed workers in taxi and limousine service sector (NAICS, 4853), coinciding with the expansion of ridesharing. Abraham et al. (2018b) and Glasner (2021) both provide evidence that workers are more likely to transition to self-employment following displacement or other shocks to the traditional employment environment (a minimum wage hike, for example). An open question is to what extent certain segments in the broad population of self-employed face a diminished propensity to exit self-employment and return to traditional covered employment. If this is the case, then self-employment may have become an increasingly separate informal labor market for certain groups of the self-employed. Further research is needed to understand the heterogeneous impact of the rising self-employment on labor market outcomes of different subpopulations.
Notes
Availability of data and material
The data used in this study are confidential and can only be accessed as part of an approved project through the U.S. Federal Statistical Research Data Center (FSRDC) network.
Competing interests
The authors have no competing interests to declare.
Funding
The authors received no external funding in the writing of this paper.
Authors’ contributions
All authors contributed equally to the writing of this paper.
Acknowledgments
We would like to thank Katharine Abraham, Andrew Foote, John Haltiwanger, William Kerr, Erika McEntarfer, Jesse Rothstein, James Spletzer, and participants at the U.S. Census Bureau research lunch, the 2018 American Economic Association conference, the 2018 IRS-Census workshop, the NBER Summer Institute 2018 CRIW Workshop, and the 2019 Comparative Analysis of Enterprise Data Conference for helpful comments and suggestions, and Claire Hou for assistance. Opinions and conclusions are those of the authors alone and do not necessarily represent the views of the U.S. Census Bureau. The analysis and conclusions set forth are those of the authors and do not indicate concurrence by other members of the research staff or the Board of Governors. All results have been reviewed to ensure that no confidential data are disclosed (CBDRB-FY18-093, DRB-B0101-CDAR-20180628, DRB-B0046-CED-20190425, DRB-B0050-CED-20190509, CBDRB-FY20-CED006-0006, and CBDRB-FY20-CED006-0007). Early drafts of this paper were circulated under the title “Aggregate Labor Market Fluidity.”
Appendices
A
Definitions
A.1. Overview and employment concepts
This section provides definitions of employment concepts used in this paper and follows the notation in Abowd et al. (2009). Note that we are applying to our annual data concepts that were developed for quarterly data. Let wijt denote earnings for individual i from employer j in year t. If an individual has reported earnings from an employer in a given year and wijt > 0, then we infer the individual worked for the employer and call this employment relationship a job.
To count the set of individuals employed at a given point in time, we consider the subset of jobs that span 2 consecutive years. Formally, an individual is counted as employed at the beginning of year t if:
Likewise, an individual is employed at the end of the year t if
A.2. Hire and separation rates
A hire is dated to year t when earnings first appears at that employer. Formally,
Similarly, an individual separates from an employer in year t if it is the last year that an employee is observed at an employer. Formally,
Following Abowd and Vilhuber (2011), the average of employment at the beginning and end of the year, i.e. (bijt + eijt)/2, is used as the denominator for our hire and separation rates.
A.3. Employer-to-employer and nonemployment transitions
Employer-to-employer and nonemployment transitions are calculated at the person-level following the employment transition concepts developed by Hyatt et al. (2014). We consider the jobs that span 2 consecutive years t − 1 and t. By definition, in such jobs the employee was employed at the beginning of year t, and so bijt = 1.
For any 2-year pair, we disambiguate the data by considering jobs that are maximal earning among all jobs a worker holds at the beginning of year t. To do so, the job with the greatest (nominal) earnings summed across years t − 1 and t is identified, as follows:
The set of jobs defined in dombijt are those we use in all of our empirical analyses. Such jobs are unique at the person-year level. Average employment in the year, (dombijt + dombijt+1)/2, serves as the denominator for employer-to-employer and nonemployment transition rates.
We consider within-year employer-to-employer transitions, as follows,
Flows into nonemployment in year t are defined as
Flows nonemployment into employment in year t are defined as
A.4. Measuring secondary and short-duration jobs
We follow Hyatt and Spletzer (2013) in recovering secondary and short-duration jobs from hires, separations, employer-to-employer transitions, as well as transitions into and out of nonemployment. Total hires into secondary and short-duration jobs h2ijt are defined as:
and total separations from secondary and short-duration jobs s2ijt can be defined analogously asSome additional arithmetic is required to measure the hire and separation rates associated with secondary and short-duration jobs because (job-level) hires and separation rates have slightly different denominators from the worker-level rates. The denominator for hires and separations are total jobs, that is, consecutive-year employer–employee combinations. The denominator for employer-to-employer and nonemployment is total workers employed in any consecutive-year employer–employee combination. Therefore, we multiply these by the ratio of the denominators to express secondary and short-duration hires and separations in terms of total consecutive-year jobs.
References
Abowd, John; Bryce Stephens; Lars Vilhuber; Fredrik Andersson; Kevin McKinney; Marc Roemer; Simon Woodcock (2009): The LEHD Infrastructure Files and the Creation of the Quarterly Workforce Indicators, in: Timothy, Dunne; J. Bradford Jensen; Mark J. Roberts (eds.), Producer Dynamics: New Evidence from Micro Data, 68, Studies in Income and Wealth. Chicago: University of Chicago Press, 149–230.
John AbowdBryce StephensLars VilhuberFredrik AnderssonKevin McKinneyMarc RoemerSimon Woodcock2009The LEHD Infrastructure Files and the Creation of the Quarterly Workforce Indicatorsin:Dunne TimothyJ. Bradford JensenMark J. Roberts(eds.),Producer Dynamics: New Evidence from Micro Data, 68, Studies in Income and WealthChicagoUniversity of Chicago Press14923010.7208/chicago/9780226172576.003.0006
Abowd, John; Lars Vilhuber (2011): National Estimates of Gross Employment and Job Flows from the Quarterly Workforce Indicators with Demographic and Industry Detail. Journal of Econometrics 161(1), 82–99.
John AbowdLars Vilhuber2011National Estimates of Gross Employment and Job Flows from the Quarterly Workforce Indicators with Demographic and Industry DetailJournal of Econometrics1611829910.1016/j.jeconom.2010.09.008
B
Self-Employed and Business Owners Over Time
We here assess the extent to which the universe-level administrative records capture a similar population as the CPS-DER. Population totals for the total number of BI recipients are shown in Figure B1. We calculate four totals. The first is the total number of CPS-DER Schedule SE filers, after applying weights to recover the population totals. Note that the CPS-DER Schedule SE totals from 1996–2010 are taken from Abraham et al. (2018). The total number of BI recipients in the CPS-DER increased steadily from 13.0 million in 1996 to 18.3 million in 2007, then declined to 17.3 million 2010, just after the 2007–2009 recession. In later years, it increased to 19.6 million in 2014 and fell slightly to 19.4 million in 2015.
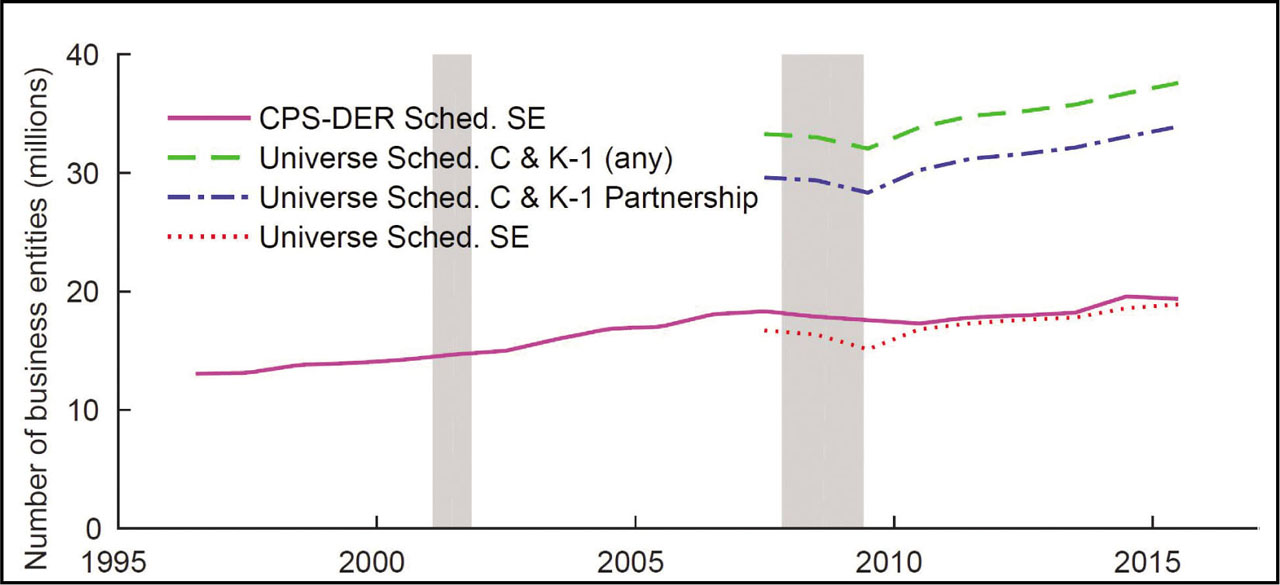
Figure B1
Total number of administrative records self-employed (millions).
Notes: CPS-DER numbers from 1996–2010 are from Figure 1 of Abraham et al. (2018). Other totals are authors’ calculations on CPS-DER Schedule SE records, as well as universe-level Schedule C and Schedule K1 records. CPS-DER, Current Population Survey-Detailed Earnings Record; SE, Self-Employment Tax.
The second group in Figure B1 is the total number of recipients of income from sole proprietor partnership businesses who file a Schedule SE in the universe-level administrative records. This includes a subset of those who report sole proprietor income, as well as those who report income from a partnership. There were 16.7 million Schedule SE filers in 2007, and this number fell to 15.1 million in 2009, and then increased to 18.9 million in 2015. The numbers of Schedule SE filers in the universe-level data were similar to those implied by the CPS-DER. The largest difference was about 15% in 2009; other years were different by less than 10%. The overall correlation between these two series is 0.78, but the correlation is much higher for 2010–2015, when it is 0.97.
Our third group is the total number of recipients of income from sole proprietor and partnership businesses, which was much larger than those who file a Schedule SE. A total of 29.6 million reported such income in 2007, and this number declined to 28.3 million in 2009, and then increased to 33.9 million in 2010. Overall, 55–57% of those who reported income from a sole proprietor or partnership business filed a Schedule SE.
Finally, the fourth group in Figure B1 is the total number of recipients of income from sole proprietor, partnership, and S corporations. Note that this group excludes business owner entities that are EINs (i.e., excluding businesses that own other businesses). There were 33.3 million BI recipients in 2007. This declined to 32.1 million in 2009, and then increased to 37.6 million in 2015. Comparing the difference between this fourth group (all BI recipients) and the third group (all Schedule C sole proprietors and K1 owners of partnerships), we obtain the total number of owners of S corporations. The total number of owners of S corporations ranged from 3.6 million to 3.8 million.
C
How Frequently are Business Owners Employees?
Our new data allow us to answer the question of how frequently BI recipients are present in matched employer–employee data. This question is important as there is a small literature that, starting with Agarwal et al. (2016) and Kerr and Kerr (2017), attempts to identify business founders, owners, and entrepreneurs using matched employer–employee wage and salary records.
This approach labels an individual as a business founder if the individual was one of the three highest earning employees in the year that the business hired its first employee. This approach is predicated on the assumption that business owners receive wage and salary payments.
The popularity of this approach is somewhat surprising given that the U.S. Internal Revenue Service (2017, 2019a) discourages and in many cases prohibits sole proprietors and the owners of partnerships from paying themselves a salary.23 Given this legal prohibition, this method is unlikely to successfully identify the owners of sole proprietor and partnership businesses. Conversely, owners of S corporations who provide labor services to their firms are “officers” who are legally required to receive wage and salary payments.24
Our linked datasets allow us to assess the accuracy of labeling high-earning employees as business founders. We first measure the frequency with which owners of employer businesses receive wage and salary income from their owned business (and thus appear as employees in matched employer–employee linked datasets). The second row in Table C1 shows that only 12.5% of employer sole proprietors, and 11.2% of the owners of employer partnerships, received wage and salary payments. A higher fraction of the owners of employer S corporations, 70.3%, received wage and salary payments. The fifth row of the table provides the share of firms in which at least one owner is present in the W-2 data. 13.2% of employer sole proprietors and 24.3% of partnerships have at least one owner present in the W-2 data. In 84.8% of employer S corporations, at least one owner received wage and salary payments.
Table C1
Share of business owners who receive wage and salary payments
| Schedule C Sole Proprietors | Form K1 Partnerships | Form K1 S Corps. | |
|---|---|---|---|
| W-2 Data | |||
| Share of owners: (%) | |||
| Owners of EIN firms in W-2 | 7.4 | 1.1 | 40.4 |
| Owners of employer firms in W-2 | 12.5 | 11.2 | 70.3 |
| Owners of employer firms, top 3 | 10.3 | 7.9 | 59.7 |
| Share of firms: (%) | |||
| Any owner of EIN firms in W-2 | 7.5 | 3.8 | 48.8 |
| Any owners of employer firms in W-2 | 13.2 | 24.3 | 84.8 |
| Any owners of employer firms, top 3 | 11.0 | 20.2 | 78.5 |
| LEHD Data | |||
| Share of owners: (%) | |||
| Owners of EIN firms in UI | 7.3 | 1.1 | 39.4 |
| Owners of employer firms in UI | 12.3 | 9.3 | 69.0 |
| Owners of employer firms, top 3 | 9.8 | 6.9 | 59.4 |
| Share of firms: (%) | |||
| Any owner of EIN firms in UI | 7.8 | 4.5 | 48.6 |
| Any owners of employer firms in UI | 13.6 | 26.5 | 83.0 |
| Any owners of employer firms, top 3 | 10.8 | 22.4 | 77.0 |
[i] Notes: Authors’ calculations of universe-level W-2, Schedule C, and Schedule K1 records. Percentages indicate the share of businesses owners who receive a W-2 record of the wage and salary income from a business of a particular legal form that they own, as well as the share of businesses that have at least one owner with a W-2 record. Authors’ calculation of LEHD administrative records and universe-level Schedule C and Schedule K1 records. This table shows the share of businesses owners who receive a UI record of the wage and salary income from the businesses that they own, as well as the share of businesses that have at least one owner with a UI record. “Top 3” indicates that the owner is among the top 3 highest earners at that employer. EIN, Employer Identification Number; LEHD, Longitudinal Employer-Household Dynamics; UI, unemployment insurance.
Next, we measure the accuracy of the entrepreneur identification strategy of Kerr and Kerr (2017) by focusing on the top three earners at employer businesses. The third row of Table C1 shows that the share of owners who were among the top three wage and salary earners was 10.3% for sole proprietors, 7.9% for partnerships, and 59.7% for S corporations.25 The sixth row of the table shows that the top three highest earning employees include at least one owner in 11.0% of sole proprietors, 20.2% of partnerships, and 78.5% of S corporations.
Table C1 also reports the relative frequency with which business owners are present in the Longitudinal Employer-Household Dynamics (LEHD) data. The LEHD data are derived from unemployment insurance (UI) wage and salary income records provided by U.S. states to the U.S. Census Bureau as part of the Local Employment Dynamics federal–state partnership. The results are quite comparable, suggesting that owner wage and salary receipt is similar in federal income taxes (W-2 data), and state payroll taxes (UI wage records).
In Table C2, we incorporate commonly used sample selection techniques. Following Kerr and Kerr (2017), we include only employer firms in their first year, where the firm had only one establishment in that year. For these employer firms, we identify the top three wage and salary earners at the firm and report the frequency that the business owner is one of these top three earners. Relative to Table C1, this sample selection technique results in an increased fraction of business owners in sole proprietor businesses, and a lower share of business owners for S corporations. For example, 77.0% of S corporations employ at least one owner among their top three highest earning employees according to the UI wage records (Table C1), but in the year that S corporations hire their first employee, that share is only 69.3% (Table C2). These results imply that many owners of S corporations start to receive wage and salary payments after they hire their first employee.
Table C2
Share of owners who receive wage & salary payments: first year, single establishment
| Schedule C Sole Proprietors | Form K1 Partnerships | Form K1 S Corps. | |
|---|---|---|---|
| W-2 Data | |||
| Share of owners: (%) | |||
| Owners of employer firms in W-2 | 16.1 | 14.3 | 61.5 |
| Owners of employer firms, top 3 | 13.9 | 11.4 | 57.1 |
| Share of firms: (%) | |||
| Any owners of employer firms in W-2 | 17.0 | 26.9 | 74.6 |
| Any owners of employer firms, top 3 | 14.6 | 23.5 | 71.1 |
| LEHD Data | |||
| Share of owners: (%) | |||
| Owners of employer firms in UI | 15.5 | 13.8 | 59.6 |
| Owners of employer firms, top 3 | 13.5 | 11.3 | 55.4 |
| Share of firms: (%) | |||
| Any owners of employer firms in UI | 16.4 | 27.2 | 72.7 |
| Any owners of employer firms, top 3 | 14.2 | 23.8 | 69.3 |
[i] Notes: Authors’ calculations of LEHD administrative records, as well as universe-level W-2, Schedule C, and Schedule K1 records. Entries in the table indicate the share of businesses owners who receive a W-2 or have a LEHD UI payroll record of the wage and salary income from the businesses that they own. Numbers are averages over time of annual averages from 2007–2014 for firms in their first year as employers that consist of a single establishment. “Top 3” indicates that the owner is among the top 3 highest earners at that employer. LEHD, Longitudinal Employer-Household Dynamics; UI, unemployment insurance.
These results suggest that researchers should not assume that the owner of a particular business is present in U.S. matched employer–employee data. In the case of sole proprietor and partnership employer businesses, a much better approximation of the data can be obtained by assuming that no owner is present.26 The top three earners of an S corporation include at least one owner nearly four-out-of-five times, but most of the top three wage and salary earners at S corporations are not owners. Thus, even for S corporations these approaches yield at best a proxy for ownership.
D
Schedule SE Share of Consecutive-Year Employment
Figure D1 shows the share of consecutive-year employment attributable to Schedule SE filers in the CPS-DER. This is as a share of consecutive-year employment, which is the denominator of the transition rates. At the start of 1991, self-employment constituted 7.2% of all employer–employee combinations, and 6.7% of all such that were dominant among a person's employer–employee combinations. The Schedule SE share of employment (dominant employment) declined to 7.1% (6.5%) in 2000, and then surged to 8.1% (7.5%) in 2005. Thereafter, the share of employment accounted for by Schedule SE filers was flat, and in 2016 Schedule SE files were 8.2% of employment and 7.5% of dominant employment.
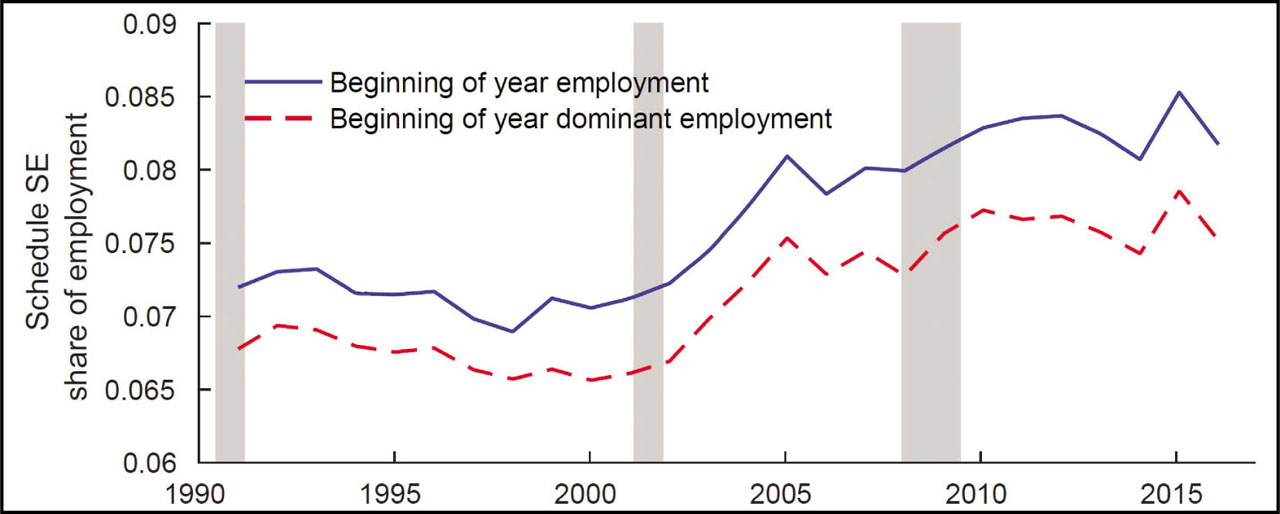
Figure D1
Schedule SE share of total consecutive-year employment.
Notes: Authors’ calculations of CPS-DER W-2 and Schedule SE records. CPS-DER, Current Population Survey-Detailed Earnings Record; SE, Self-Employment Tax.
References
Agarwal, Rajshree; Benjamin Campbell; April Mitchell Franco; Martin Ganco (2016): What Do I Take With Me? The Mediating Effect of Spin-out Team Size and Tenure on the Founder-Firm Performance Relationship. Academy of Management Journal 59(3), 1060–1087.
Rajshree AgarwalBenjamin CampbellApril Mitchell FrancoMartin Ganco2016What Do I Take With Me? The Mediating Effect of Spin-out Team Size and Tenure on the Founder-Firm Performance RelationshipAcademy of Management Journal5931060108710.5465/amj.2012.0853
Azoulay, Pierre; Benjamin Jones; J. Daniel Kim; Javier Miranda (2020): Age and High-Growth Entrepreneurship. American Economic Review: Insights 2(1), 65–82.
Pierre AzoulayBenjamin JonesJ. Daniel KimJavier Miranda2020Age and High-Growth EntrepreneurshipAmerican Economic Review: Insights21658210.3386/w24489
Kerr, Sari Pekkala; William Kerr (2017): Immigrant Entrepreneurship, in: Haltiwanger, John; Erik Hurst; Javier Miranda; Antoinette Schoar, (eds.), Measuring Entrepreneurial Businesses: Current Knowledge and Challenges. Chicago: University of Chicago Press, 187–249.
Sari Pekkala KerrWilliam Kerr2017Immigrant Entrepreneurshipin:John HaltiwangerErik HurstJavier MirandaAntoinette Schoar(eds.),Measuring Entrepreneurial Businesses: Current Knowledge and ChallengesChicagoUniversity of Chicago Press18724910.3386/w22385
U.S. Internal Revenue Service (2017): Paying Yourself. https://www.irs.gov/businesses/small-businesses-self-employed/paying-yourself. Accessed 20 December 2017.
U.S. Internal Revenue Service2017Paying Yourselfhttps://www.irs.gov/businesses/small-businesses-self-employed/paying-yourself. Accessed 20 December 2017.
U.S. Internal Revenue Service (2019a): Paying Yourself. https://www.irs.gov/businesses/small-businesses-self-employed/paying-yourself. Accessed 26 June 2019.
U.S. Internal Revenue Service2019aPaying Yourselfhttps://www.irs.gov/businesses/small-businesses-self-employed/paying-yourself. Accessed 26 June 2019.
U.S. Internal Revenue Service (2019b): Employer's Supplemental Tax Guide (Supplement to Pub.15, Employer's Tax Guide) For use in 2019. https://www.irs.gov/pub/irs-pdf/p15a.pdf. Accessed 12 August 2019.
U.S. Internal Revenue Service2019bEmployer's Supplemental Tax Guide (Supplement to Pub.15, Employer's Tax Guide) For use in 2019https://www.irs.gov/pub/irs-pdf/p15a.pdf. Accessed 12 August 2019.
U.S. Internal Revenue Service (2019c): Form 1125-E Compensation of Officers. https://www.irs.gov/pub/irs-pdf/f1125e.pdf. Accessed 12 August 2019.
U.S. Internal Revenue Service2019cForm 1125-E Compensation of Officershttps://www.irs.gov/pub/irs-pdf/f1125e.pdf. Accessed 12 August 2019.
E
Reallocation Rates For Wage and Salary Employment
This paper contains the first estimates of labor reallocation rates using W-2 data. This section presents the basic trends in reallocation rates from our W-2 wage and salary data and benchmarks them against other available data sources.
E.1. Hire and separation rates in W-2 wage and salary data
E.1.1. Time trends
Figure E1 shows the time trend of hire and separation rates using W-2 data. After rising steadily during the 1990s, these rates fell sharply around the 2001 recession, stabilized briefly in the mid-2000s, and fell again during the 2007–2009 recession. This is the “stair-step” pattern noted by Hyatt and Spletzer (2013).
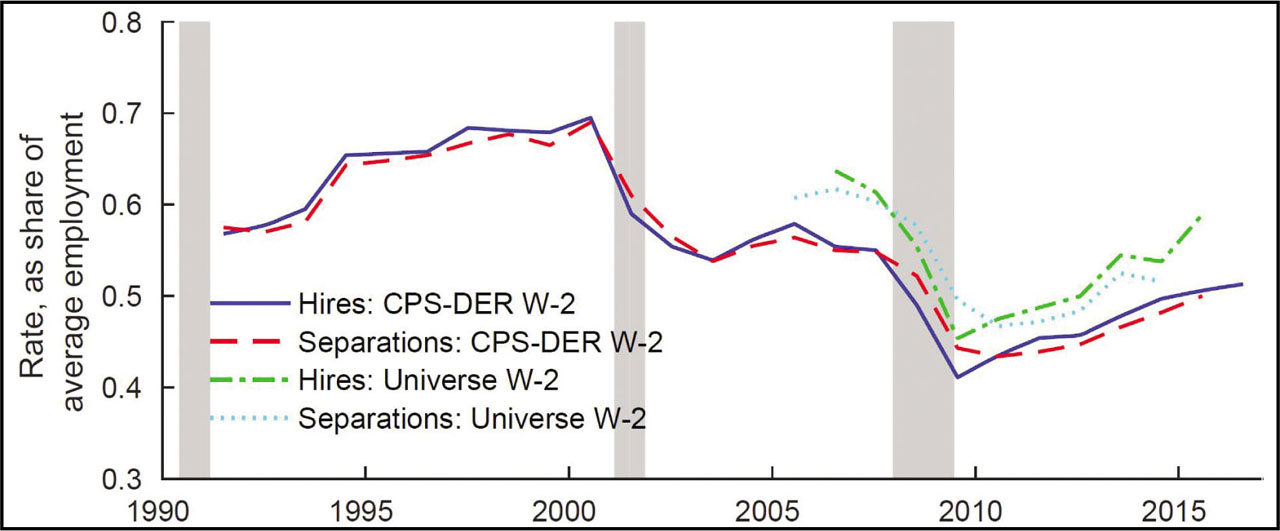
Figure E1
Hire and separation rates: wage and salary (W-2) employment.
Notes: Authors’ calculations of CPS-DER W-2 records, as well as universe-level W-2 records. The denominator for all rates is the average of employment at the beginning and end of the year. CPS-DER, Current Population Survey-Detailed Earnings Record.
The W-2 based hire and separation from the universe-level files was consistently a few percentage points above those from the CPS-DER W-2 records. This difference may be due to sample selection and record linkage effects that are not completely accounted for by our linkage-adjusted CPS-DER weights. For example, people who responded to the CPS-ASEC may have had slightly more stable employment histories than the population as a whole. Nevertheless, the rate calculated from the CPS-DER W-2 records is highly correlated with that of the universe-level W-2 records. The correlation between the hires series for years 2006–2015 is 0.978, and that of the separation series for years 2005–2015 is 0.984. At the end of our time series, hire and separation rates still had yet to recover to the levels observed during the 1990s. In 2015, the hire (separation) rate remained 13.9 (13.7) percentage points below the average hire (separation) rate from 1991–2000 of 64.5% (63.7%).
E.1.2. Benchmarking
We benchmark the W-2 hire and separation rates against the following data sources. JOLTS hires and separations were downloaded from https://www.bls.gov/jlt/. The national QWI hires and separations were taken downloaded from https://ledextract.ces.census.gov/static/data.html. For additional details on the construction of national QWI hires and separations, see Abowd and Vilhuber (2011).
For transitions from the CPS, we use data from two data sources. The CPS gross flows series, downloaded from https://www.bls.gov/webapps/legacy/cpsflowstab.htm, provides information on nonemployment-to-employment and employment-to-nonemployment transitions. Monthly rates of nonemployment-to-employment transitions are calculated in two steps. First, we sum unemployment to employment transitions (LNU07100000), not in the labor force transitions (LNU07200000), and other transitions to employment (LNU07300000). This sum is divided by total employment (LNU02000000). Analogously, we calculate monthly transition rate from employment-to-nonemployment as the sum of employment to unemployment (LNU07400000), employment to not in the labor force (LNU07800000), and other transitions out of employment (LNU08200000), divided by the same total employment. To measure employer-to-employer transitions, we use the EEhaz series calculated from CPS microdata by Fallick and Fleischman (2004), and downloaded from https://www.federalreserve.gov/pubs/feds/2004/200434/200434abs.html. Although data are available starting in 1994, we use these data starting in 1996 because published rates are missing for several months in 1995. Our CPS hire rate is the sum of the EEhaz series and our nonemployment-to-employment series. Our CPS separation rate is the sum of the EEhaz series and our employment-to-nonemployment series.
A challenge in attempting to benchmark our new data from the CPS-DER and universe-level administrative records against other data sources concerns the frequency of the underlying micro-data. Our new transition rates are calculated using annual data, and so we calculate the rate of hire, separation, employer-to-employer, and nonemployment transitions on an annual basis. However, the other data sources are calculated at higher frequencies. The JOLTS and CPS are published at a monthly frequency, and the QWI and J2J are calculated at a quarterly frequency. We therefore approximate an annual rate from these data sources by taking the sum of the monthly or quarterly rates within a particular calendar year.
Our benchmarking exercises are affected by measurement issues, and these are somewhat different for hires and separations and the other transition rates. Employer-reported hire and separation rates from the QWI and JOLTS are calculated at a higher frequency than our new annual data, and therefore are more likely to record recalls as distinct separations and hires. In our annual data, if a separation and a recall occur in the same calendar year, we record it as a continuous employment spell because the employee's lapse in employment is not observed. This should occur less frequently in quarterly and monthly data.
The results of this exercise are shown in Figure E2. We include hire and separation rates from the CPS-DER linked with W-2 records, as well as universe-level W-2 records. We compare these with three additional measures of hires and separations from JOLTS, QWI, and CPS. The QWI has the highest hire and separation rates, and the JOLTS has the lowest hire and separation rates. The CPS has the least cyclical transition rates.
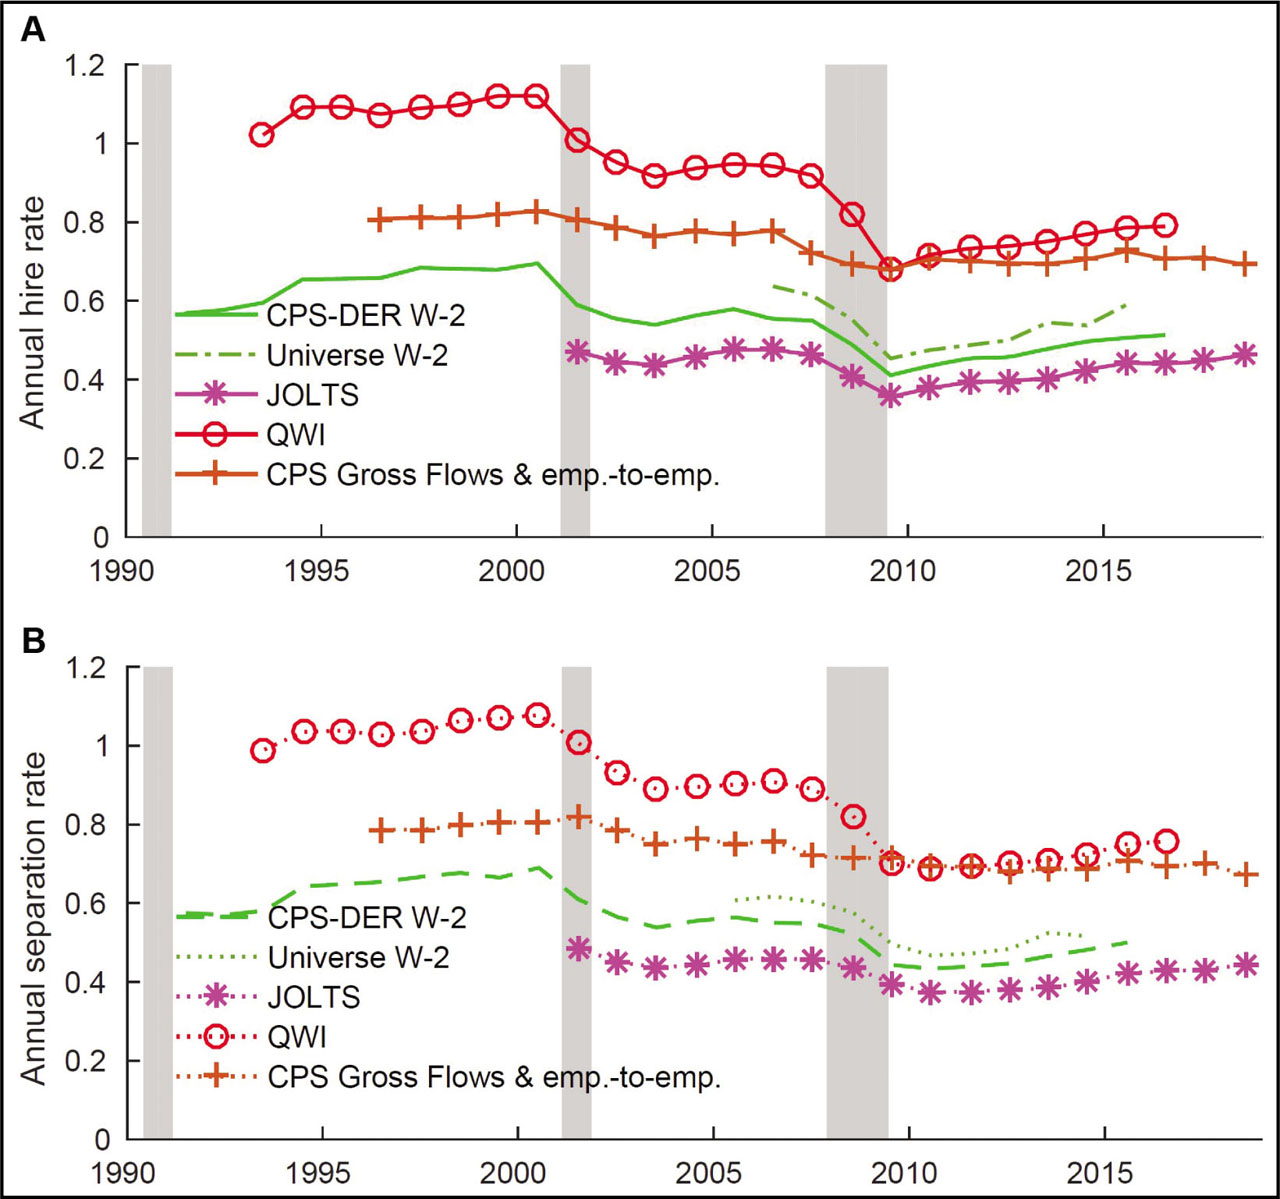
Figure E2
Annual hire and separation rates.
Notes: A: Hires. B: Separations. Authors’ calculations of CPS-DER W-2 records, universe-level W-2 data, and published aggregates. The denominator for the W-2 rates is the average of employment at the beginning and end of the year. JOLTS, QWI, and CPS Gross Flows and Employer-to-Employer Transitions series sum rates within a calendar year. CPS-DER, Current Population Survey-Detailed Earnings Record; JOLTS, Job Openings and Labor Turnover Survey; QWI, Quarterly Workforce Indicators.
Figure E2(a) shows the results for hires, while E2(b) shows the results for separations. In 1993, the hire (separation) rate from the CPS-DER was 59.5% (58.1%). The QWI had a much higher hire (separation) rate of 102.1% (99%). In other words, total hires and separations in 1993 in the QWI were roughly the same as total employment, while in the W-2 data they were closer to three-fifths of employment. In 1996, the hire (separation) rate using aggregates of monthly CPS data was 80.9% (78.7%), which was between the QWI's rate of 107.4% (102.6%) and the CPS-DER's rate of 65.8% (65.4%). In 2001, the annual hire (separation) rate from the JOLTS was the lowest at 47.2% (48.8%), that of the CPS-DER was higher at 59.0% (61.0%), the aggregates of CPS monthly data had a yet higher rate of 80.6% (81.7%), and the QWI was again highest at 100.9% (100.7%). In all data sources, separations exceeded hires in the recession year of 2001.
In 2006, we have hire and separation rates from the universe-level W-2 data, along with every other data series. Like the CPS-DER linked with W-2 data, our universe-level tabulations were consistently between the JOLTS and the monthly CPS. In 2006, the lowest hire (separation) rate was the JOLTS at 47.6% (46.0%), the CPS-DER had higher number at 55.4% (55.0%), the universe-level W-2 records had a rate of 63.7% (61.7%), the CPS monthly aggregates had a rate of 77.9% (75.7%), and the QWI had a rate of 94.2% (90.1%). At the end of the 2007–2009 recession, hires reached a local minimum in 2009 in each series: 35.6% in the JOLTS, 41.1% in the CPS-DER W-2 records, 45.3% in the universe-level W-2 records, 68.0% in the CPS monthly aggregates, and 67.8% in the QWI. Separations reached a local minimum in every series in 2010 except the aggregates of CPS microdata. In 2010, separations were 37.3% in the JOLTS, 43.4% in the CPS-DER W-2 records, 46.7% in the universe-level W-2 records, 68.5% in the QWI, and 69.6% in the aggregates of CPS monthly data. The separation rate in the CPS monthly data continued to decline until 2013, when it reached 68.5%. As documented by Fujita, Moscarini, and Postel-Vinay (2020), a change in the administration of the CPS resulted in a substantial, permanent decline in monthly transition rates starting in 2007.
The last year in which data from all series are available is 2014. In that year, the hire (separation) rate was 42.5% (40.2%) in the JOLTS, 49.7% (48.2%) in the CPS-DER W-2 records, 53.7% (51.5%) in the universe-level W-2 records, 70.5% (68.6%) in the aggregates of CPS monthly data, and 76.9% (72.5%) in the QWI. Most series increased in the expansion that followed the 2007–2009 recession. The exception is the aggregates of CPS monthly data, in which the hire (separation) rate was 69.2% (67.3%) in 2018.
Despite the level differences, our new hire and separation rates are highly correlated with these other series. The correlation between the hire (separation) rate in the CPS-DER W-2 records and the monthly aggregates from the CPS is 0.93 (0.91), 0.98 (0.98) with the QWI, and 0.97 (0.98) with the JOLTS. The correlation between the hire (separation) rate in the universe-level administrative records is 0.78 (0.81) with the monthly CPS aggregates, 0.93 (0.98) with the QWI, and 0.98 (0.97) with the JOLTS.
E.2. Employer-to-employer and nonemployment transitions in W-2 wage and salary records
E.2.1. Time trends
A challenge in attempting to benchmark our new data from the CPS-DER and universe-level administrative records against other data sources concerns the frequency of the underlying microdata. Our transition rates are calculated using annual W-2 data, and so we calculate the rate of hire and separation rates on an annual basis. However, the other data sources are calculated at higher frequencies. The JOLTS and CPS are published at a monthly frequency, and the QWI at a quarterly frequency. We therefore approximate an annual rate from these data sources by taking the sum of the monthly or quarterly rates within a particular calendar year.
These measurement issues affect the interpretation of our benchmarking exercises. In our annual data, if a separation and a recall occur in the same calendar year, we record it as a continuous employment spell because the employee's lapse in employment is not observed. More of these gaps in employment can be observed in quarterly and monthly data.
The evolution of the employer-to-employer, nonemployment-to-employment, and employment-to-nonemployment transition rates for our two data sources are shown in Figure E3. Results for the CPS-DER, shown in Figure E3(a), indicate that the employer-to-employer transition rate exhibited substantial cyclical declines around the 2001 and 2007–2009 recessions. It had recovered to 14.0% by 2015. The transition rates into and out of nonemployment also evolved cyclically. During expansions, the rate of nonemployment-to-employment transitions exceeded that of employment-to-nonemployment transitions, and so employment increased. During recessions, this pattern reversed as the employment-to-nonemployment transition rate surged. By 2015, both the employment-to-nonemployment and the nonemployment-to-employment transition rates were 1.5 percentage points below their 1991–2000 averages of 11.1% and 12.4%, respectively.
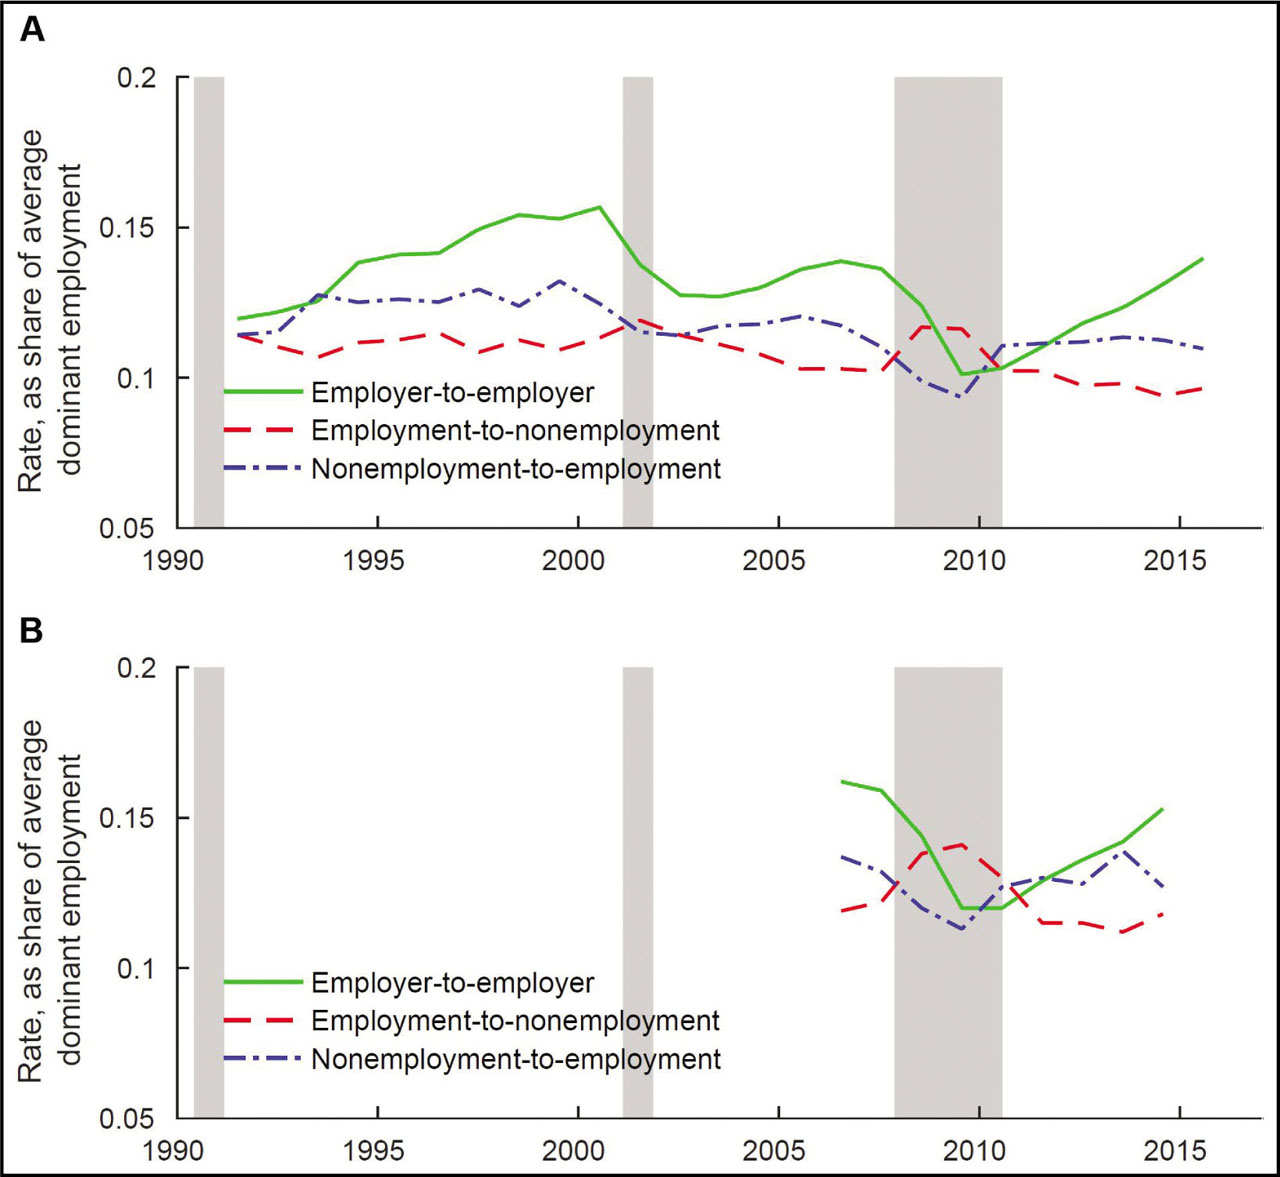
Figure E3
Employer-to-employer and nonemployment transitions.
Notes: A: CPS-DER W-2. B: CPS-DER W-2. Authors’ calculations of CPS-DER W-2 records, as well as universe-level W-2 records. The denominator for all rates is the average of dominant employment at the beginning and end of the year. CPS-DER, Current Population Survey-Detailed Earnings Record.
Figure E3(b) shows that the transition rates in the universe-level W-2 data were somewhat higher than for the CPS-linked W-2 data. Transition rates evolved similarly in the shorter time series of universe-level W-2 data, shown in Figure E3(b). In 2006, the employer-to-employer transition rate calculated from universe-level administrative records was 16.2%. The rate then fell to 12.0% in 2009, and recovered to 15.3% in 2014. In 2006, transitions out of nonemployment were 13.7% of average W-2 employment, while transitions into nonemployment were 11.9%. In the 2007–2009 recession, these rates reversed, as the employment-to-nonemployment transition rate reached 14.1% in 2009, when the nonemployment-to-employment transition rate was only 11.3%. In the years that followed, the nonemployment-to-employment rate recovered, and was 12.7% in 2014, when the employment-to-nonemployment rate was 11.8%. For example, the employer-to-employer transition rate calculated from universe-level administrative records was 16.2% in 2006, compared to 13.9% in the CPS-DER. The universe-level W-2 records are highly correlated with the CPS-DER. The correlation between the employer-to-employer transition rates is 0.997, the employment-to-nonemployment rates is 0.884, and the nonemployment-to-employment rates is 0.908.
E.2.2. Benchmarking
We benchmark our W-2 employer-to-employer and nonemployment transition rates against other data sources. JOLTS layoffs and quits were downloaded from https://www.bls.gov/jlt/. Note that the JOLTS quit rate is not a direct measure of the employer-to-employer transition rate, but Hyatt et al. (2014) show it has a very high correlation with that of J2J. Similarly, the JOLTS layoff series is not a direct measure of employment-to-nonemployment transitions, but Hyatt et al. (2014) show that it is highly correlated with the J2J employment-to-nonemployment series. J2J data on employer-to-employer and nonemployment transitions – see Hyatt et al. (2014) – were downloaded from https://lehd.ces.census.gov/data/j2jbeta.html. We use the J2JHires, NEPersist, and ENPersist for employer-to-employer transitions, nonemployment-to-employment, and employment-to-nonemployment transitions, respectively. We divide each by the average of MainB and MainE, employment at the beginning and end of every quarter. We aggregate CPS data to form employer-to-employer, employment-to-nonemployment, and nonemployment-to-employer transition rates as described in Appendix E.1.2.
Our W-2 measures of employer-to-employer and nonemployment transitions are calculated on an annual basis, and we seek to compare these to monthly data from the CPS and JOLTS, as well as quarterly J2J data. To do so, we sum the transitions by the calendar year in which they occurred. Note that our employer-to-employer and nonemployment measures consider transitions between dominant employers at particular points in time. In the CPS, such transitions occur between the months in which a person is surveyed. A person has at most one recorded transition, even if they had several transitions within a single month. Similarly, the J2J consider transitions between dominant employers from the beginning of a quarter to its end, and, again, employees can have at most one transition in a quarter. In our new annual series, people have at most one recorded transition in a calendar year. In our new transition rates calculated from W-2 data, workers can have at most one transition between employers, or into or from nonemployment in a calendar year. In the J2J, an individual can have up to four transitions in a calendar year, and in the CPS an individual can have a transition between any pair of months, and so up to 12 transitions in a calendar year. Thus, the differences in the frequency with which the data are recorded can result in level differences between these different data sources.
We show the results of the benchmarking exercise in Figure E4. The transition rates using CPS-DER W-2 and universe-level W-2 records are consistently the lowest. We also find less agreement on the level of transitions into and from nonemployment than for hires, separations, or employer-to-employer transitions.
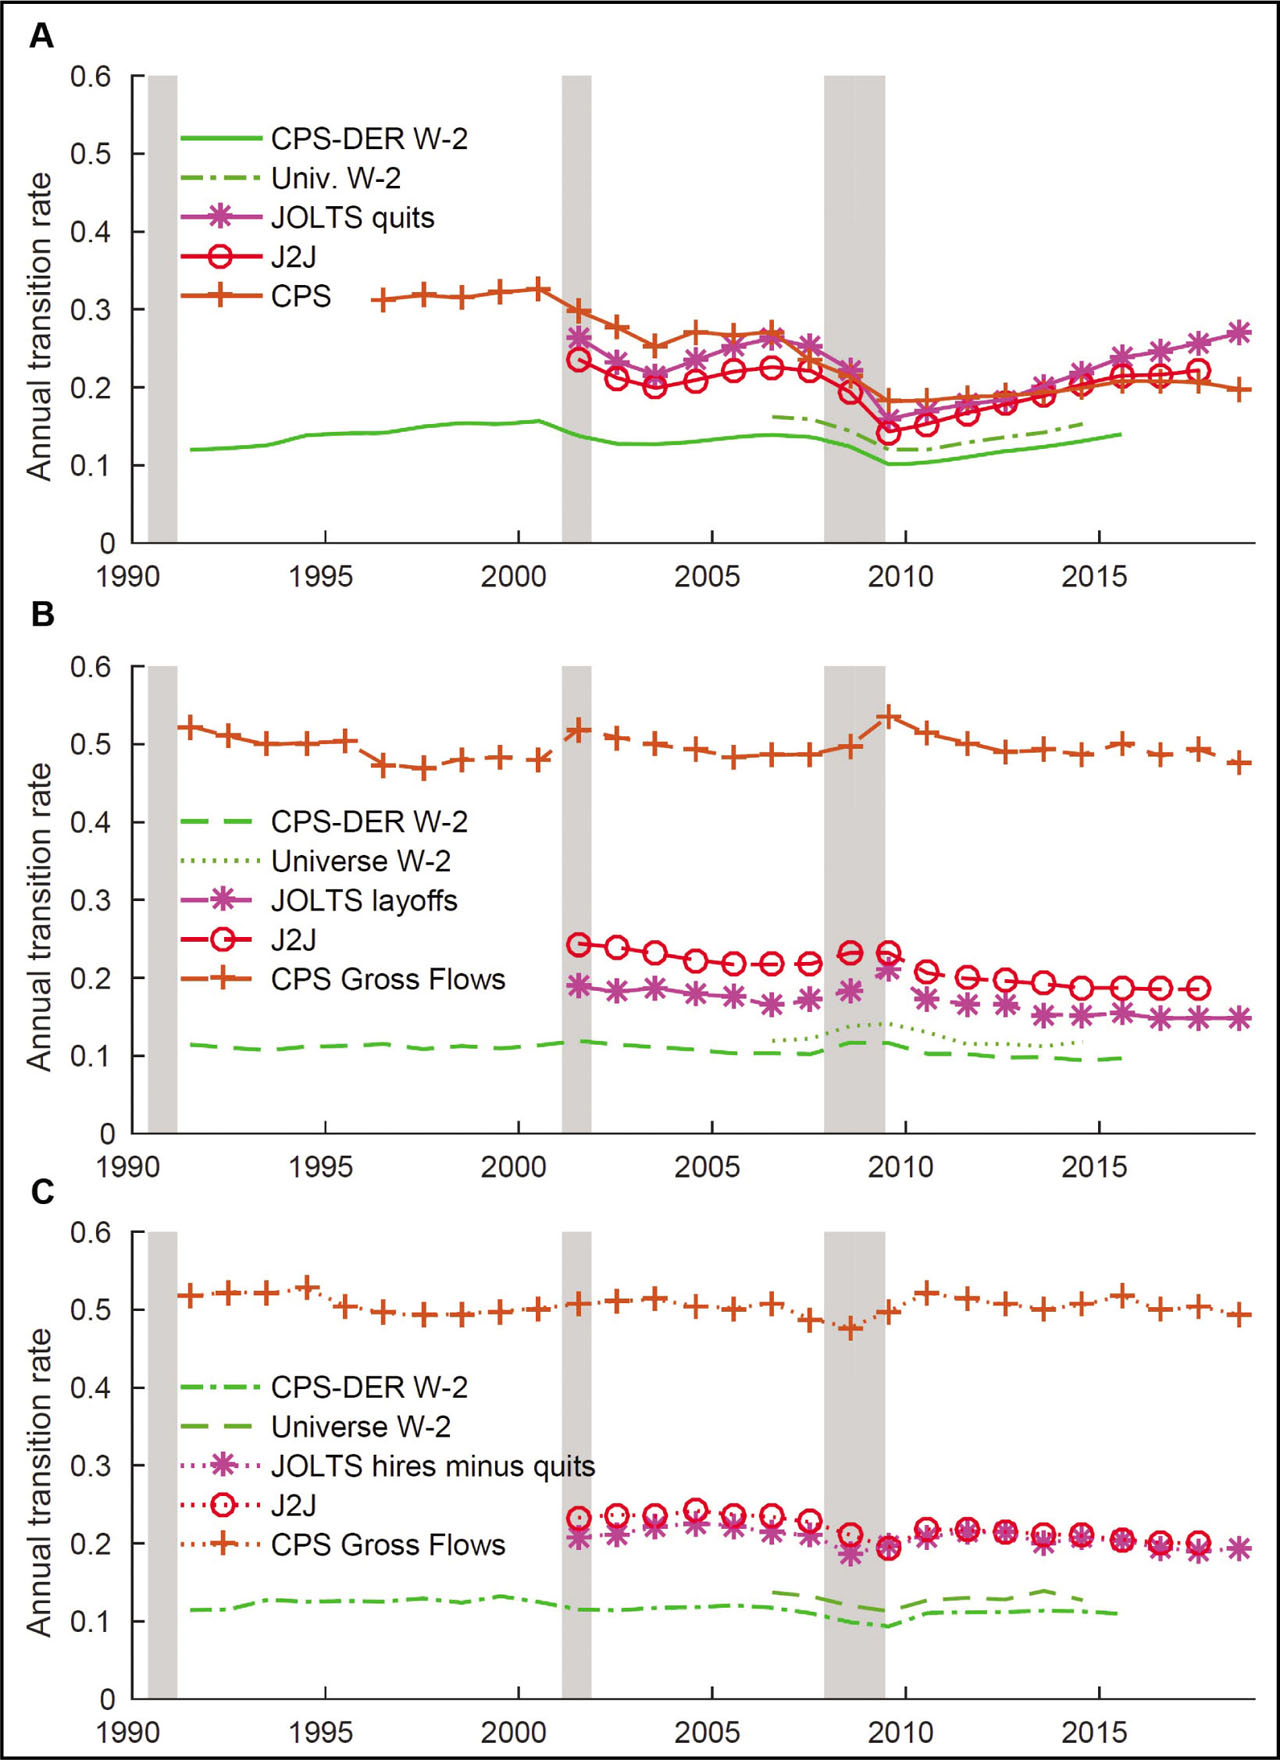
Figure E4
Annual transition rates.
Notes: A: Employer-to-employer. B: Employment-to-nonemployment. C: Nonemployment-to-employment. Authors’ calculations of CPS-DER W-2 records, as universe-level W-2 records, and published aggregates. The denominator for the W-2 based rates is the average of employment at the beginning and end of the year. JOLTS, QWI, and CPS Gross Flows and Employer-to-Employer Transitions series sum rates within a calendar year. CPS-DER, Current Population Survey-Detailed Earnings Record; JOLTS, Job Openings and Labor Turnover Survey; QWI, Quarterly Workforce Indicators.
Our employer-to-employer transition series are shown in Figure E4(a). In 1996, the CPS-DER W-2 records show that the annual employer-to-employer transition rate was 14.1%, while the sum of the monthly hazard rates from Fallick and Fleishman (2004) were more than twice that, at 31.3%. In 2001, we also compare the CPS-DER W-2 employer-to-employer transition rate with the employer-to-employer rate from J2J, as well as the quit rate from the JOLTS. There is also a conceptual relationship between these measures since employer-to-employer transitions usually involve a quit to take a new job. In 2001, the employer-to-employer transition rate was 13.8% in the CPS-DER W-2 records, 23.6% in J2J, and 29.8% when we aggregate the monthly CPS rates, while the JOLTS quit rates sum to 26.4%. In 2006, we can start to benchmark our rate from universe-level W-2 records. In that year, the employer-to-employer transition rate is 13.9% in the CPS-DER W-2 records, 16.2% in the universe-level W-2 records, 22.6% in the J2J, and 27.1% when we aggregate the monthly CPS rates, while the JOLTS quit rates sum to 16.4%. The last year for which all rates are available is 2014. In that year, the CPS-DER W-2 records had an employer-to-employer transition rate of 13.1%, while the universe-level W-2 records show 15.3%, the CPS monthly rates sum to 19.9%, the J2J rate is 20.4%, and the JOLTS quit rate was 21.9%.
The CPS-DER W-2 and universe-level W-2 employer-to-employer transition rates are highly correlated with the other annual measures. The CPS-DER W-2 rate has a correlation of 0.85 with the monthly CPS rates, 0.98 with J2J, and 0.95 with the JOLTS quit rate. The rate from universe-level W-2 records has a correlation of 0.83 with the monthly CPS rates, 0.99 with J2J, and 0.97 with the JOLTS quit rate.
The employment-to-nonemployment transition rates, shown in Figure E4(b), exhibit considerable level differences. The rates from the CPS-DER W-2 and universe-level W-2s are consistently the lowest, and the sums of the monthly transition rates from the CPS Gross Flows are the highest. In 1991, the CPS-DER employment-to-nonemployment transition rate was 11.4%. In other words, somewhat more than one-tenth of workers employed at the beginning of 1991 were employed at the end of 1991. The monthly transition rates from the CPS Gross Flows sum to 51.7%. The J2J employment-to-nonemployment rate and the JOLTS layoff rate were between the CPS-DER W-2 rates and the sum of the CPS monthly rates. In 2001, the CPS-DER W-2 data indicate that the employment-to-nonemployment transition rate was 11.9%, the J2J rates sum to 24.4%, the CPS monthly rates sum to 51.9%, and the JOLTS monthly layoff rates sum to 18.9%. These measures are also conceptually related because spikes in the employment-to-nonemployment rates that occur during recessions are driven by layoffs. The universe-level W-2 records yield an employment-to-nonemployment transition rate starting in 2006. In that year, the CPS-DER W-2 records had rate of 10.3%, the universe-level administrative records had a rate of 11.9%, the J2J rates sum to 21.7%, the CPS rates sum to 48.6%, and the JOLTS layoffs sum to 16.4%. In 2014, the last year for which data from all series are available, the CPS-DER had a rate of 9.4%, the universe-level administrative records had a rate of 11.8%, the J2J rates sum to 18.7%, the CPS-DER rates sum to 48.7%, and the JOLTS layoff rates sum to 15.2%.
The correlations between employment-to-nonemployment rates using W-2 records are highly correlated with the analogous rate from J2J: the CPS-DER has a correlation of 0.94 and the universe-level records have a correlation of 0.83. Both are also highly correlated with JOLTS layoff rate: the CPS-DER has a correlation of 0.89, and the universe-level records yield a correlation of 0.88. Correlations with the sum of the monthly employment-to-unemployment transition rates are much weaker: the CPS-DER has a correlation of 0.30, and the universe-level records yield a correlation of 0.72.
The nonemployment-to-employment transition rate series, shown in Figure E4(c), also exhibit considerable level differences. In 1991, CPS-DER W-2 records had a nonemployment-to-employment rate of 11.4%. The sum of the nonemployment-to-employment transitions in the CPS Gross Flows in that same year yields a far higher number, 51.7%. Starting in 2001, we have two additional data sources for comparison. The first is the nonemployment-to-employment rate from J2J. The second is the difference between the JOLTS hire rate and the JOLTS quit rate. This difference serves as a proxy for the number of workers who are hired who are not currently employed, as most quits involve a departure from one employer and a new job at another. In 2001, the nonemployment-to-employment transition rate from CPS-DER W-2 records was 11.5%, the J2J rates sum to 23.3%, and the differences between JOLTS hire and quit rates sum to 20.8%, and the rates from the CPS Gross Flows sum to 50.7%. Starting in 2006, there are also transition rates from the universe-level W-2 records. In that year, nonemployment-to-employment transition rate was 11.7% in the CPS-DER W-2 records and 13.7% in the universe-level W-2 records, the J2J rates sum to 23.4%, the CPS Gross Flows sum to 50.8%, and the differences between the JOLTS hire and quit rates sum to 21.3%. In 2014, the last year in which data for all series is available, the rate was 11.25% in the CPS-DER, 12.7% in the universe-level W-2 records, the J2J rates sum to 21.0%, the transitions from the CPS Gross Flows sum to 50.6%, and the differences between the JOLTS hire and quit rates sum to 20.6%.
Our new nonemployment-to-employment measures from W-2 have lower correlations with other available data sources than our other transition rates. The correlation between the CPS-DER W-2 rate and that of J2J is 0.79, while the universe-level W-2 rate has a correlation of 0.74 with J2J. The correlation between the CPS-DER W-2 nonemployment-to-employment transition rate and the difference between the JOLTS hire and quit rates is 0.81, and the universe-level W-2 data has correlation with this JOLTS differential of 0.56. The lowest correlations are with the sum of the monthly nonemployment-to-employment transitions in the CPS Gross Flows, which have a correlation of only 0.14 with the CPS-DER W-2 transitions, and 0.29 with the universe-level W-2 transitions.
E.2.3. Comparing W-2 employer-to-employer transitions with the March CPS
In addition to the benchmarking exercise conducted above, we here compare the employer-to-employer transition rate computed from the CPS-linked W-2 records with these same survey respondents’ answers to the multiple non-overlapping employer question in the CPSASEC. Since 1976, the CPS-ASEC has asked respondents “For how many employers did [you or someone else in your household] work? If more than one at same time, only count it as one employer.” Recent studies including Molloy et al. (2016) and Hyatt et al. (2018) have used the responses to this survey question to understand the long-run trends in reallocation. Survey response data was downloaded from Integrated Public Use Microdata Series (IPUMS); see Ruggles et al. (2010).
These two alternative measures of the employer-to-employer transition rate exhibit striking differences. Figure E5 shows that the employer-to-employer transition rate calculated from CPS-linked W-2 records increased during the expansion between the 1990–1991 and 2001 recessions, whereas the rate calculated from survey responses was relatively stable. Furthermore, the precipitous decline in employer-to-employer transitions among CPS-ASEC survey respondents that starts in 2001 is less severe and more cyclical in the W-2 records matched to these same survey respondents. Lastly, only the employer-to-employer transition rate calculated using the CPS-ASEC responses remains depressed relative to its 1991–2000 average.
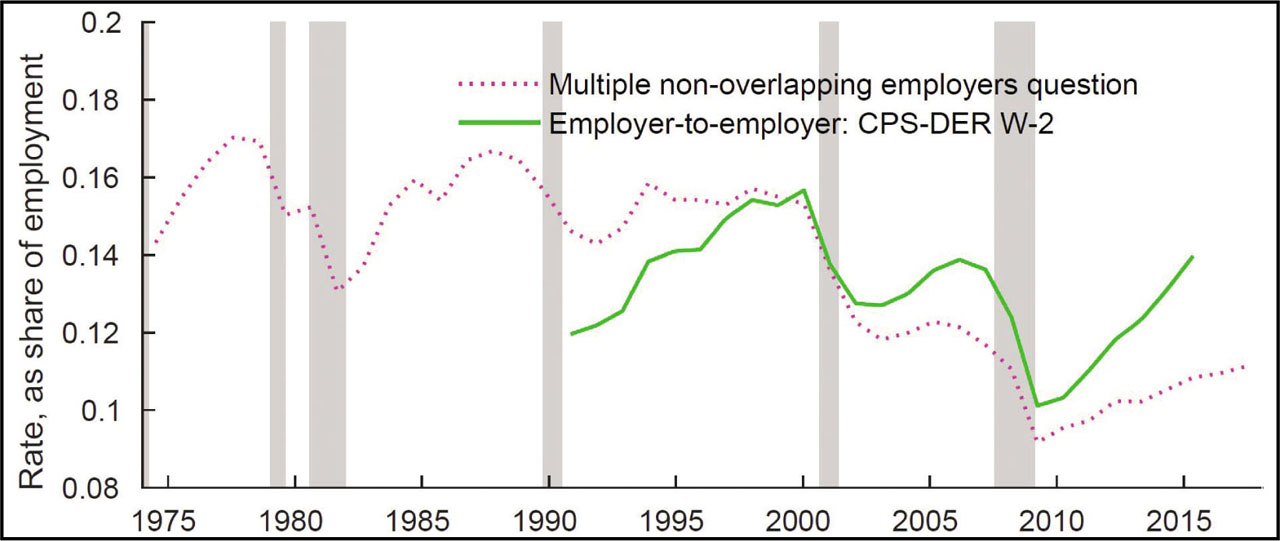
Figure E5
CPS-ASEC Multiple non-overlapping employers question vs. administrative records.
Notes: Authors’ calculations of hires and separations using CPS-ASEC respondents who report multiple non-overlapping jobs in the prior year, as well as CPS-DER W-2 records. For the CPS-ASEC responses, the denominator is those who were in scope of the multiple non-overlapping employers question. For the employer-to-employer transition rate derived from administrative records, the denominator is the average of employment at the beginning and end of the year. CPS-DER, Current Population Survey-Detailed Earnings Record; CPS-ASEC, Annual Social and Economic Supplement.
The differing long-term trends of these two measures of the employer-to-employer transition rate provide further evidence of the importance of declines in short-duration jobs. The employer-to-employer transition rate derived from CPS-linked W-2 data only identifies transitions where the start-of-year dominant employer of an individual changed from one year to the next. The CPS-ASEC provides a more expansive measure of employer-to-employer transitions since it includes job transitions where one or more of the jobs starts and stops within the calendar year (both measures ignore multiple simultaneous jobs). Thus, the fact that only the employer-to-employer transition rate measured using the CPS-ASEC responses exhibits a long-term decline is indicative that this decline is driven by a decline in short-duration jobs.
An alternative explanation for this discrepancy is survey effects. Survey effects are consistent with the unusual properties that the CPS-ASEC series displays during the 1990s, as well as its feature that measured reallocation rates declined more in the 2001 recession than the much more severe 2007–2009 recession. Kaplan and Schulhofer-Wohl (2012) attribute the strong measured decline in interstate migration in the early 2000s in the CPS-ASEC to survey effects, especially for imputed and proxy responses. Hyatt et al. (2018) note increasing divergence between CPS-ASEC survey responses on interstate migration and administrative records for the same time period. It is possible that similar survey effects contribute to the measured decline in the multiple non-overlapping employers question in the CPS-ASEC.
References
Fallick, Bruce; Charles Fleischman (2004): Employer-to-Employer Flows in the U.S. Labor Market: The Complete Picture of Gross Worker Flows. Federal Reserve Board of Governors Finance and Economics Discussion Paper Series #2004-34.
Bruce FallickCharles Fleischman2004Employer-to-Employer Flows in the U.S. Labor Market: The Complete Picture of Gross Worker FlowsFederal Reserve Board of Governors Finance and Economics Discussion Paper Series #2004-34.
Fujita, Shigeru; Giuseppe Moscarini; Fabien Postel-Vinay (2020): Measuring Employer-to-employer Reallocation. Unpublished Draft, Yale University.
Shigeru FujitaGiuseppe MoscariniFabien Postel-Vinay2020Measuring Employer-to-employer ReallocationUnpublished DraftYale University10.3386/w27525
Hyatt, Henry; Erika McEntarfer; Ken Ueda; Alexandria Zhang (2018): Interstate Migration and Employer-to-Employer Transitions: New Evidence From Administrative Records Data. Demography 55(6), 2161–2180.
Henry HyattErika McEntarferKen UedaAlexandria Zhang2018Interstate Migration and Employer-to-Employer Transitions: New Evidence From Administrative Records DataDemography5562161218010.1007/s13524-018-0720-5
Hyatt, Henry; James Spletzer (2013): The Recent Decline in Employment Dynamics. IZA Journal of Labor Economics 2(3), 1–21.
Henry HyattJames Spletzer2013The Recent Decline in Employment DynamicsIZA Journal of Labor Economics2312110.1186/2193-8997-2-5
Kaplan, Greg; Sam Schulhofer-Wohl (2012): Interstate Migration has Fallen Less than you Think: Consequences of Hot Deck Imputation in the Current Population Survey. Demography 49(3), 1061–1074.
Greg KaplanSam Schulhofer-Wohl2012Interstate Migration has Fallen Less than you Think: Consequences of Hot Deck Imputation in the Current Population SurveyDemography4931061107410.3386/w16536
Molloy, Raven; Christopher Smith; Riccardo Trezzi; Abigail Wozniak (2016): Understanding Declining Fluidity in the U.S. Labor Market. Brookings Papers on Economic Activity, Spring, 183–237.
Raven MolloyChristopher SmithRiccardo TrezziAbigail Wozniak2016Understanding Declining Fluidity in the U.S. Labor MarketBrookings Papers on Economic ActivitySpring18323710.1353/eca.2016.0015
Ruggles, Steven; Matthew Sobek; Trent Alexander; Catherine Fitch; Ronald Goeken; Patricia Kelly Hall; Miriam King; Chad Ronnander (2010): Integrated Public Use Microdata Series: Version 3.0. Machine-readable database. Minneapolis: Minnesota Population Center.
Steven RugglesMatthew SobekTrent AlexanderCatherine FitchRonald GoekenPatricia Kelly HallMiriam KingChad Ronnander2010Integrated Public Use Microdata Series: Version 3.0. Machine-readable databaseMinneapolisMinnesota Population Center
F
Reallocation Rates Including vs. Excluding Owners: Universe-Level Data
In Section 5, we calculate reallocation rates including and excluding business owners. This allows us to consider the long-run relationship between declining labor market fluidity and increasing BI receipt. In this Appendix, we conduct an analogous exercise using our universe-level data. While providing evidence for a much shorter time series, it demonstrates how these rates changed during the 2007–2009 recession.
Figure F1 shows hire and separation rates including and excluding BI recipients. The universe-level dataset shows that including BI entrants and exits in hire and separation rates results in both lower hire and separation rates and smaller cyclical fluctuations in these labor reallocation measures. Hire rates were 2.7 to 6.5 percentage points lower, and separation rates 0.5 to 5.3 percentage points lower, when including BI recipients from the universe-level records.
We can compare these labor reallocation series starting in 2008 to assess how including business income records from the universe-level dataset (which include a broader set of BI recipients) affects the measured decline in hires and separations during and after the 2007–2009 recession. The hire rate declined from 2008 to 2010 by 7.9 percentage points using universe-level W-2 income alone (from 55.4% to 47.5%), and by 6.6 percentage points when including universe-level BI recipients (from 51.1% to 44.5%). Including BI entrants therefore results in a 17% smaller decline in the hire rate from 2008 to 2010.27
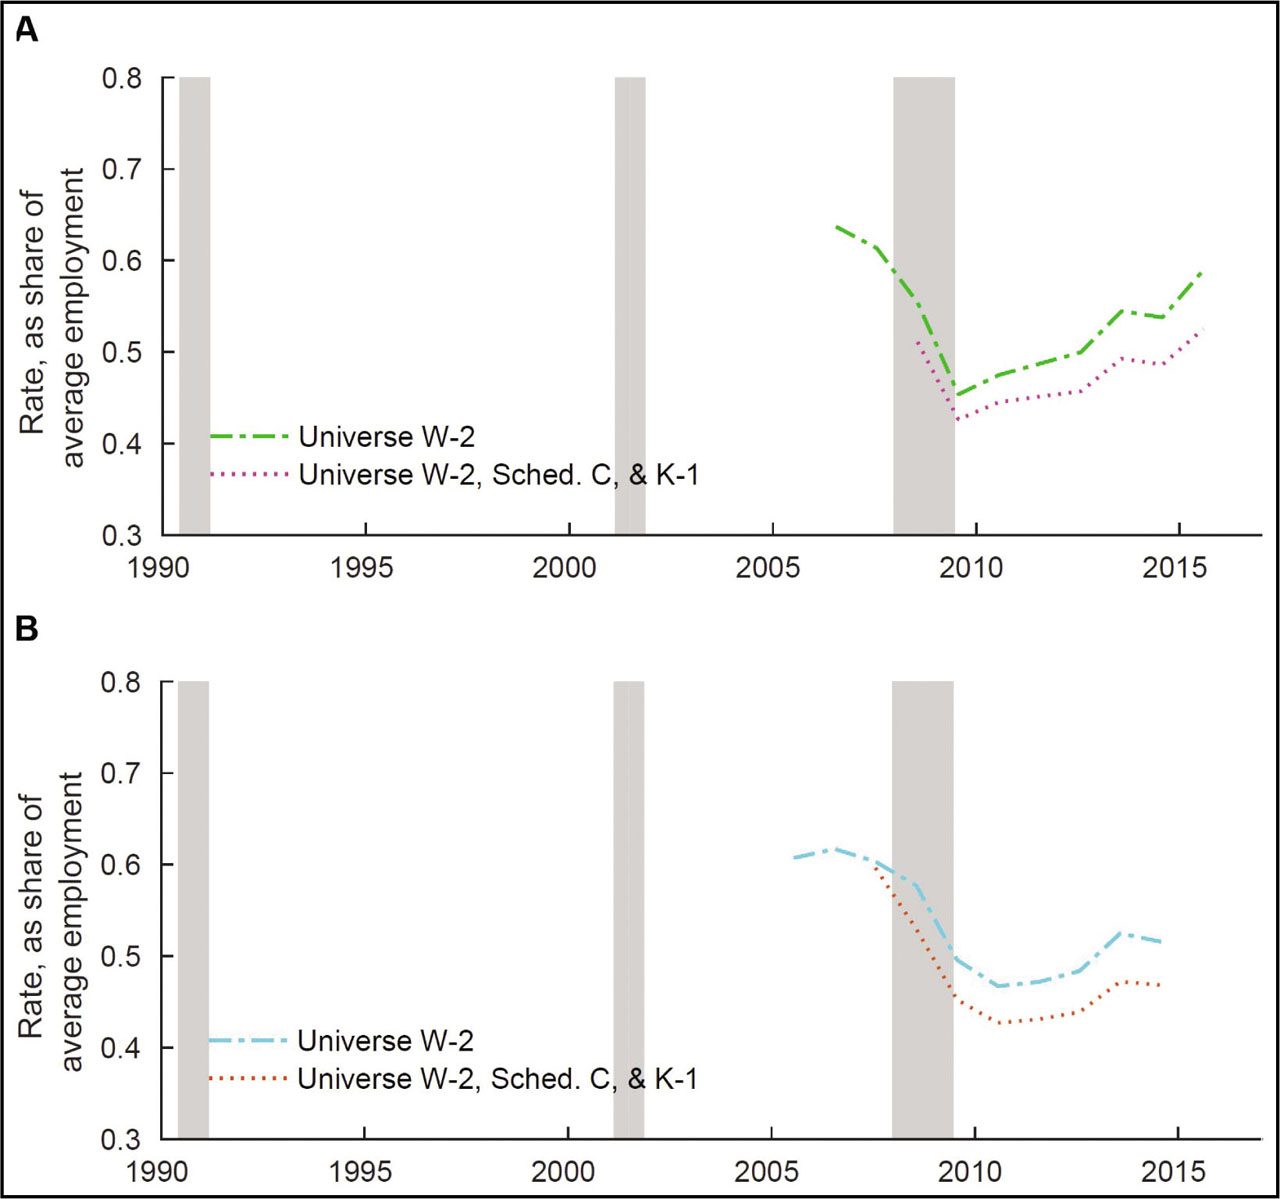
Figure F1
Hires and separations.
Notes: A: Hires. B: Separations. Authors’ calculations of CPS-DER W-2 and Schedule SE records, as well as universe-level W-2, Schedule C, and Schedule K1 records. CPS-DER, Current Population Survey-Detailed Earnings Record; SE, Self-Employment Tax.
In the universe-level records, the separation rate declined from 2008 to 2010 by 11.0 percentage points using universe-level W-2 income alone (from 57.7% to 46.7%), and by 10.3 percentage points when including BI recipients (from 53.0% to 42.7%). Including BI exits in the separation rate therefore results in a 6.5% smaller cyclical decline in separations from 2008 to 2010 relative to the separation rate measured using only wage and salary records.
Figure F2 shows employer-to-employer transitions, as well as nonemployment transitions, including and excluding BI recipients. The employer-to-employer transition rate had a smaller decline during the 2007–2009 recession using universe-level administrative records. According to both series, there was a sharp decline of about 2.4 to 2.5 percentage points from 2008 to 2009. The W-2 data alone reached a minimum of 12.0% in both 2009 and 2010, before rising to 12.9% in 2011. The employer-to-employer transition rate including BI recipients increased from 12.4% in 2009 to 13.1% in 2010, and then to 13.7% in 2011. The recovery in the employer-to-employer transition rate was therefore more U-shaped in the W-2 data alone, and more V-shaped when including BI recipients. This albeit limited evidence suggests that the omission of BI recipients may affect the slow measured labor market recovery to the 2007–2009 recession in employer-reported administrative records data. These results highlight the need for more research on the role of self-employment and business ownership in labor market recoveries.
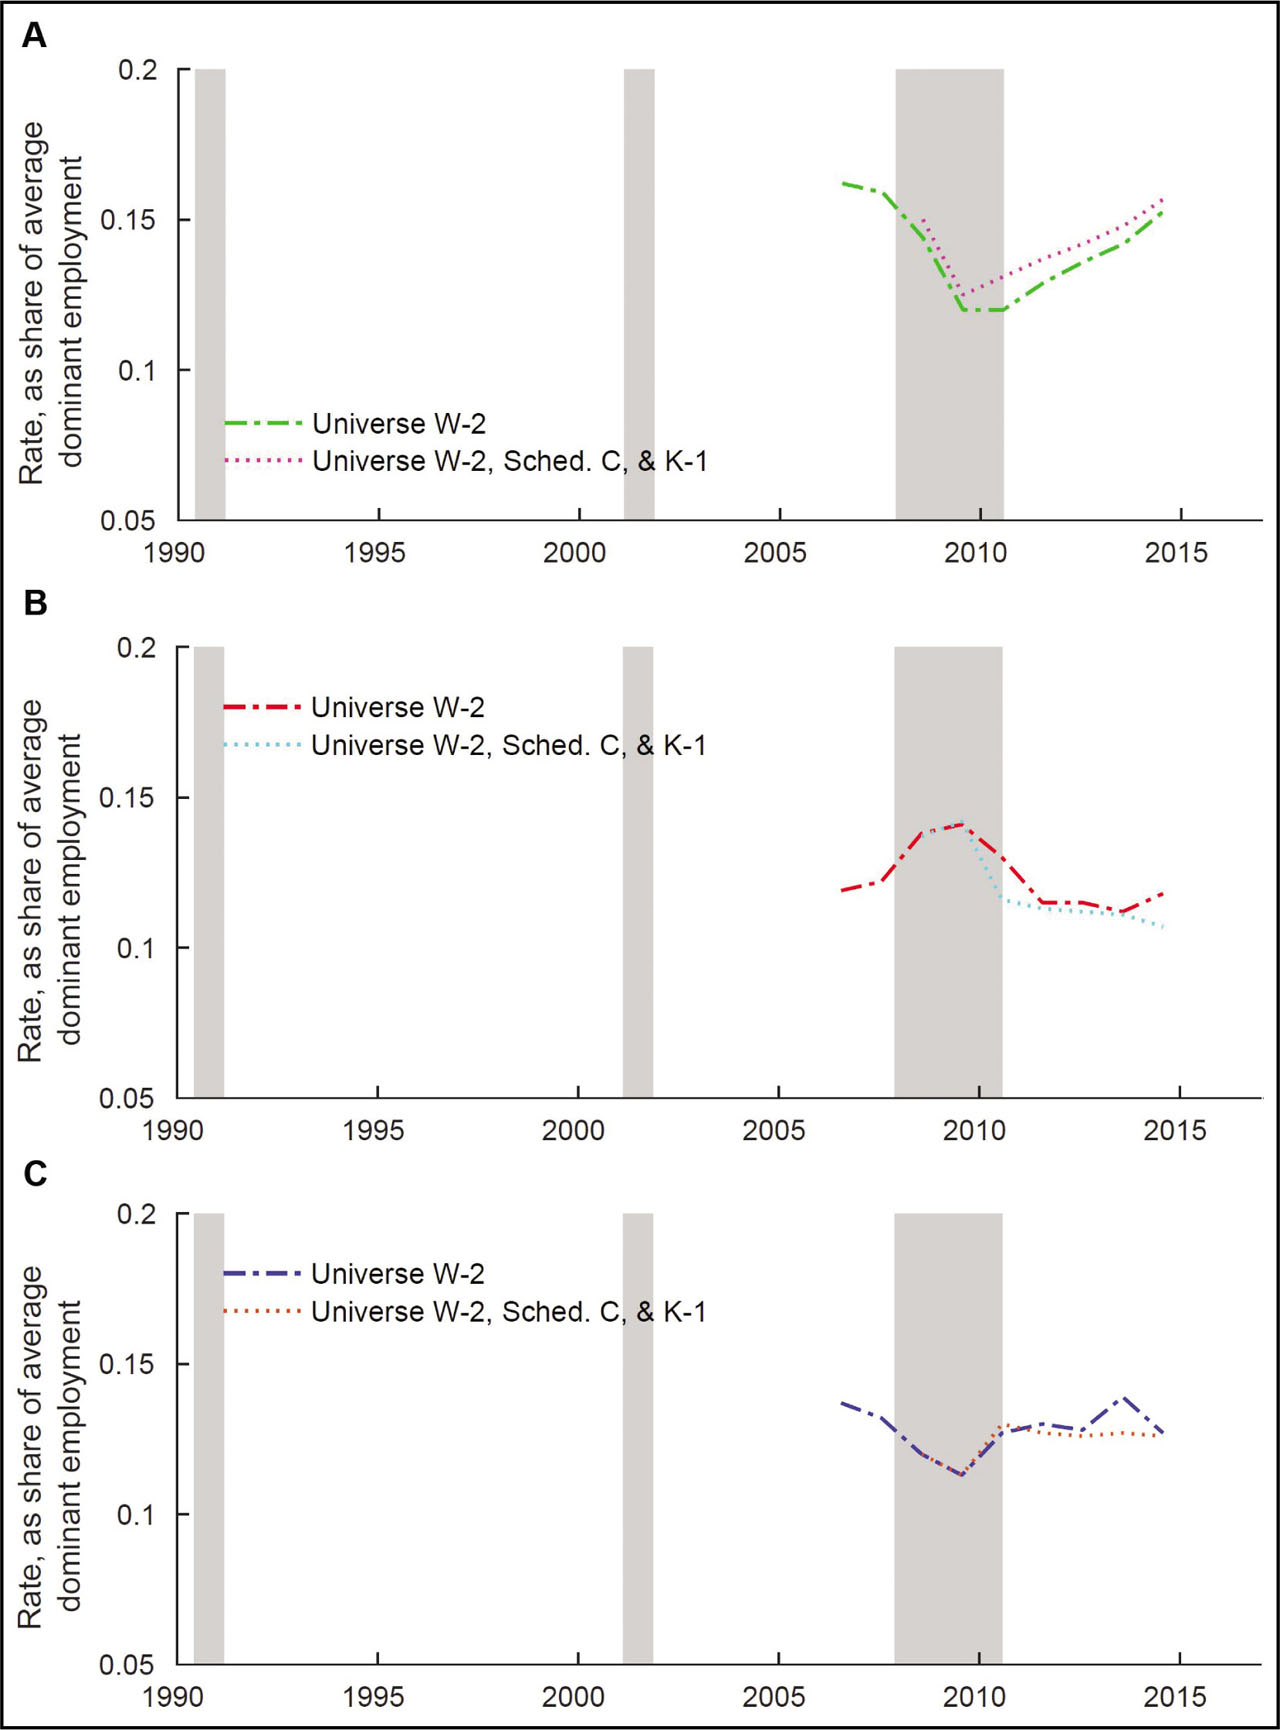
Figure F2
Employer-to-employer and nonemployment transitions.
Notes: A: Employer-to-employer. B: Employment-to-nonemployment. C: Nonemployment-to-employment. Authors’ calculations of CPS-DER W-2 and Schedule SE records, as well as universe-level W-2, Schedule C, and Schedule K1 records. CPS-DER, Current Population Survey-Detailed Earnings Record; SE, Self-Employment Tax.
Figure F3 shows the impact of including BI recipients on the hire and separation rates for secondary and short-duration jobs. Consistent with the results for hires and separations generally (Figure F1), the inclusion of BI recipients results in substantially lower hire and separation rates. The secondary and short-duration job hire rate is 20.3–26.8% using W-2 data alone, and 17.5–22.2% including BI recipients. The separation rate ranges from 17.4% to 29.4% using W-2 data alone, and from 14.3% to 23.7% including BI recipients.
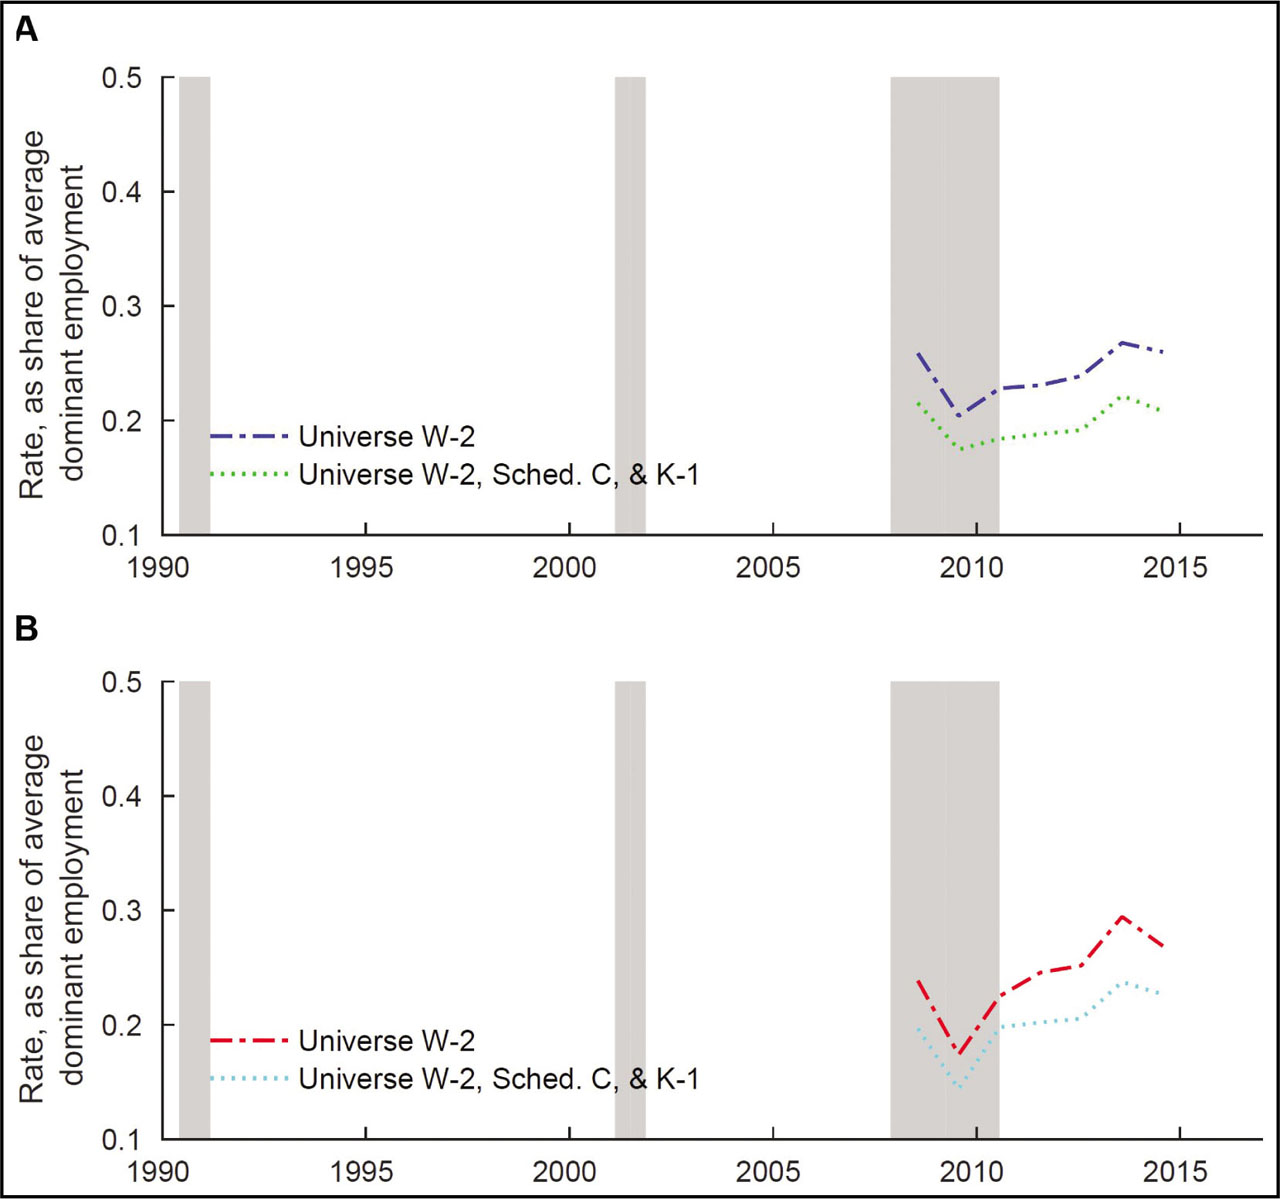
Figure F3
Secondary and short-duration job hires and separations.
Notes: A: Hires. B: Separations. Authors’ calculations of universe-level W-2, Schedule C, and Schedule K1 records.
G
Reallocation vs. Reclassification: Supplemental Tables
Tables G1 and G2 contain point estimates from regressions of the number of jobs held by an individual on an indicator for whether the individual is self-employed in that year (in this table we only consider individuals who are ever self-employed). We have two dependent variables. Table G1 considers the number of wage and salary jobs. Table G2 considers the total number of jobs worked (including both wage and salary jobs and self-employment). We report estimation results for regressions performed both with and without worker-specific fixed effects. In Table G3 we add to our regression model an interaction term indicating whether a worker's self-employment earnings are dominant, i.e., the self-employemtn earnings are greater than the worker's earnings from any wage and salary employer in the year.
Table G1
Regression of number of wage and salary jobs worked on BI Intercept from any wage and salary employer in the year.
| CPS-DER | Universe | CPS-DER | Universe | |
|---|---|---|---|---|
| Intercept | 1.495*** (0.000) | 1.490*** (0.001) | ||
| BI | −0.883*** (0.001) | −0.757*** (0.002) | −0.596*** (0.001) | −0.313*** (0.001) |
| Worker fixed effects | N | N | Y | Y |
| R2 | 0.148 | 0.146 | 0.421 | 0.618 |
[i] Notes: Authors’ calculations of CPS-DER W-2 and Schedule SE records, as well as universe-level W-2, Schedule C, and Schedule K1 records. BI, business income; CPS-DER, Current Population Survey-Detailed Earnings Record; SE, Self-Employment Tax.
Table G2
Regression of total number of jobs (including BI) on BI
| CPS-DER | Universe | CPS-DER | Universe | |
|---|---|---|---|---|
| Intercept | 1.495*** (0.000) | 1.490*** (0.001) | ||
| BI | 0.117*** (0.001) | 0.567*** (0.001) | 0.404*** (0.001) | 0.748*** (0.001) |
| Worker fixed effects | N | N | Y | Y |
| R2 | 0.003 | 0.026 | 0.323 | 0.757 |
[i] Notes: Authors’ calculations of CPS-DER W-2 and Schedule SE records, as well as universe-level W-2, Schedule C, and Schedule K1 records. Regressions estimate how the number of jobs worked differ based on an individual's BI. BI, business income; CPS-DER, Current Population Survey-Detailed Earnings Record; SE, Self-Employment Tax.
Table G3
Regression of total number of jobs worked on BI, by dominant earnings
| CPS-DER | Universe | CPS-DER | Universe | |
|---|---|---|---|---|
| Intercept | 1.456*** (0.000) | 1.409*** (0.000) | ||
| Ever BI | 0.077*** (0.001) | 0.081*** (0.001) | ||
| Ever BI * BI | 0.829*** (0.001) | 1.251*** (0.001) | 0.899*** (0.002) | 1.805*** (0.002) |
| Ever BI * BI * BI dom | −1.002*** (0.001) | −1.080*** (0.001) | −0.818*** (0.002) | −0.841*** (0.002) |
| Worker fixed effects | N | N | Y | Y |
| R2 | 0.028 | 0.074 | 0.351 | 0.768 |
[i] Notes: Authors’ calculations of CPS-DER W-2 and Schedule SE records, as well as universe-level W-2, Schedule C, and Schedule K1 data. Regressions estimate how the number of jobs worked differ based on an individual's BI. BI, business income; CPS-DER, Current Population Survey-Detailed Earnings Record; SE, Self-Employment Tax.