
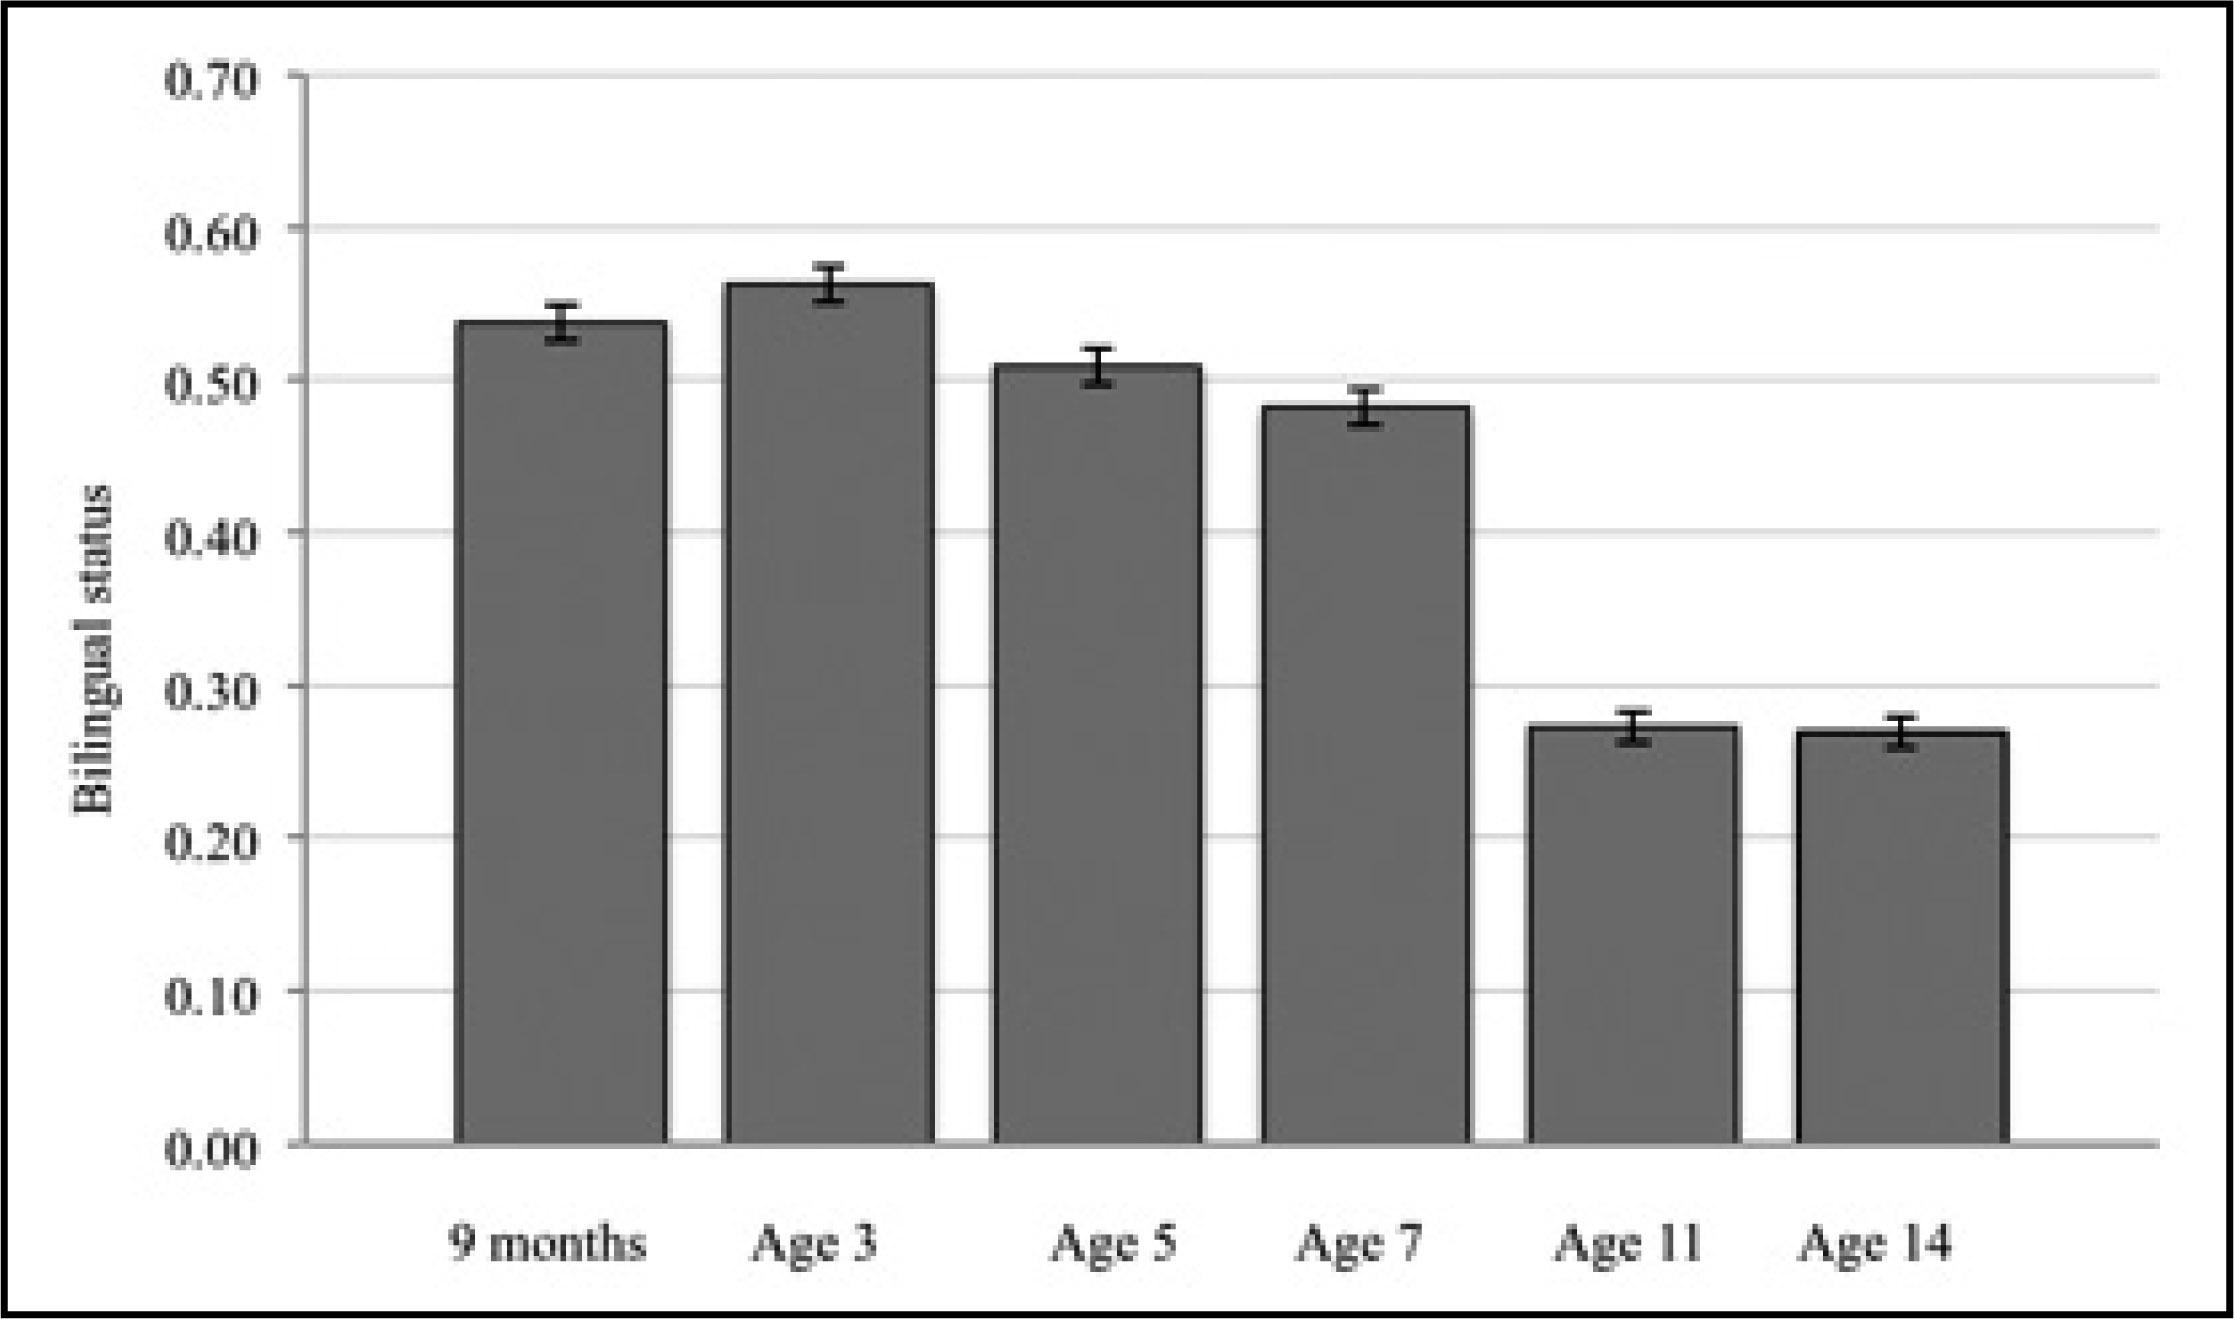
Figure 1
The effects of bilingualism on language, emotional, and pro-social development – OLS and GMM dynamic estimates
| (1) | (2) | (3) | |
|---|---|---|---|
| OLS no past endowments | OLS with past endowments | System GMM effects | |
| Panel (A): Outcome: z-Verbal Reasoning skills | |||
| Bilingualw−1 | −0.102*** (0.036) | −0.032 (0.031) | 0.040 (0.106) |
| z-Verbal reasoning skillsw−1 | 0.278*** (0.014) | 0.602*** (0.218) | |
| z-SDQ scorew−1 | −0.092*** (0.013) | −0.743** (0.352) | |
| Year dummies | Yes | Yes | Yes |
| Hansen p-value | 0.243 | ||
| Arellano–Bond test AR(2) p-value | 0.152 | ||
| Panel (B): Outcome: z-SDQ score | |||
| Bilingualw−1 | −0.006 (0.037) | −0.049* (0.027) | −0.018 (0.048) |
| z-Verbal reasoning skillsw−1 | −0.066*** (0.011) | −0.069 (0.093) | |
| z-SDQ scorew−1 | 0.490*** (0.014) | 0.266* (0.155) | |
| Year dummies | Yes | Yes | Yes |
| Hansen p-value | 0.551 | ||
| Arellano–Bond test AR(2) p-value | 0.753 | ||
| Panel (C): Outcome: z-Pro-social score | |||
| Bilingualw−1 | −0.001 (0.025) | 0.014 (0.021) | −0.028 (0.033) |
| z-Pro-social scorew−1 | 0.343*** (0.019) | 0.287* (0.157) | |
| Year dummies | Yes | Yes | Yes |
| Hansen p-value | 0.344 | ||
| Arellano–Bond test AR(2) p-value | 0.238 | ||
| N (Observations) | 6310 | 6310 | 6310 |
| N (Individuals) | 2269 | ||
Probability models to attrite from the sample on verbal, SDQ and pro-social outcomes
| (1) | (2) | (3) | |
|---|---|---|---|
| Verbal | SDQ | Pro-social | |
| Bilingual | 0.024 (0.097) | 0.065 (0.095) | 0.026 (0.091) |
| z-Verbal reasoning | −0.078** (0.037) | ||
| z-SDQ | −0.010 (0.029) | ||
| z-Pro-social | 0.036 (0.027) | ||
| Child's age | 0.023** (0.009) | 0.023** (0.009) | 0.023*** (0.008) |
| Male | 0.062 (0.054) | 0.077 (0.054) | 0.100** (0.050) |
| Mother age | −0.011** (0.005) | −0.013** (0.005) | −0.014*** (0.005) |
| White | 0.158* (0.082) | 0.170** (0.079) | 0.114 (0.075) |
| Young migrant | 0.019 (0.062) | −0.078 (0.061) | −0.033 (0.057) |
| Mother non-English | −0.040 (0.081) | −0.099 (0.080) | −0.037 (0.078) |
| Father non-English | −0.079 (0.081) | −0.025 (0.079) | −0.064 (0.078) |
| Married | −0.147** (0.072) | −0.189*** (0.071) | −0.142** (0.067) |
| Mother with high degree | −0.187*** (0.067) | −0.213*** (0.066) | −0.207*** (0.063) |
| Father with high degree | 0.008 (0.057) | 0.058 (0.057) | 0.023 (0.052) |
| Frequency of reading to the child | 0.006 (0.024) | −0.012 (0.025) | 0.002 (0.021) |
| Frequency of the child being taken to the library | −0.004 (0.038) | 0.015 (0.037) | −0.007 (0.035) |
| Below 60% of the median UK income | −0.069 (0.066) | 0.020 (0.066) | −0.042 (0.061) |
| Natural mother presented in Household (HH) | 0.292 (0.417) | 0.113 (0.476) | 0.288 (0.423) |
| z-Birth weight | 0.001 (0.031) | 0.033 (0.031) | 0.010 (0.028) |
| Number of siblings | −0.000 (0.026) | 0.015 (0.026) | 0.010 (0.024) |
| Wald test | 68.6 | 83.71 | 77.42 |
| Pseudo R2 | 0.0231 | 0.0278 | 0.0218 |
Baseline summary statistics by attrition by wave 6
| Variable | Remained | Attrited | Difference |
|---|---|---|---|
| SDQ | 10.17 [5.49] | 10.07 [5.56] | −0.10 (0.24) |
| Verbal reasoning | 44.83 [12.52] | 43.55 [12.34] | −1.29*** (0.53) |
| Male | 0.47 [0.50] | 0.47 [0.50] | 0.01 (0.02) |
| Mother born non-English | 0.58 [0.49] | 0.54 [0.50] | −0.04* (0.02) |
| Young migrant | 0.6 [0.49] | 0.56 [0.50] | −0.04* (0.02) |
| Mother with higher qualification | 0.43 [0.50] | 0.37 [0.48] | −0.06*** (0.02) |
| Father with higher qualification | 0.59 [0.49] | 0.62 [0.48] | 0.03 (0.02) |
| Below 60% of the median UK income | 0.39 [0.49] | 0.44 [0.50] | 0.05*** (0.02) |
Children who switched bilingual status over the observed period
| Stayed bilingual | Stayed monolingual | Bilingual – wave 2 and moved to monolingual | Bilingual – waves 2, 3 and moved to monolingual | |||||
|---|---|---|---|---|---|---|---|---|
| Mean | SD | Mean | SD | Mean | SD | Mean | SD | |
| Verbal reasoning | 6.43 | 2.39 | 7.54 | 2.69 | 8.16 | 2.81 | 6.75 | 2.78 |
| SDQ index | 14.07 | 3.87 | 13.10 | 3.79 | 12.20 | 2.66 | 13.82 | 4.01 |
| Pro-social index | 8.47 | 1.83 | 8.42 | 1.74 | 8.62 | 1.66 | 8.63 | 1.80 |
| Male | 0.41 | 0.49 | 0.48 | 0.50 | 0.42 | 0.50 | 0.49 | 0.50 |
| White | 0.11 | 0.31 | 0.82 | 0.38 | 0.62 | 0.49 | 0.26 | 0.44 |
| Mother with high degree | 0.34 | 0.48 | 0.50 | 0.50 | 0.69 | 0.47 | 0.44 | 0.50 |
| Father with high degree | 0.55 | 0.50 | 0.58 | 0.49 | 0.76 | 0.43 | 0.67 | 0.48 |
| Below 60% of the median UK income | 0.51 | 0.50 | 0.19 | 0.39 | 0.13 | 0.34 | 0.46 | 0.50 |
| Young migrant | 0.49 | 0.50 | 0.80 | 0.40 | 0.51 | 0.51 | 0.53 | 0.50 |
| Number of siblings | 1.89 | 1.18 | 1.49 | 0.98 | 1.40 | 1.03 | 1.89 | 1.28 |
| Natural mother – in the family | 0.97 | 0.16 | 0.98 | 0.13 | 1.00 | 0.00 | 0.98 | 0.13 |
| Mother non-English | 0.91 | 0.29 | 0.24 | 0.42 | 0.84 | 0.37 | 0.84 | 0.37 |
| Father non-English | 0.87 | 0.34 | 0.25 | 0.43 | 0.80 | 0.40 | 0.84 | 0.37 |
Delta: size of proportional selection on unobservable to drive “bilingual” to zero
| Age 3 | Age 5 | Age 7 | Age 11 | Age 14 | |
|---|---|---|---|---|---|
| Language development | |||||
| δ | 1.18 | 1.12 | −13.29 | 1.59 | 3.31 |
| Emotional development | |||||
| δ | 1.50 | −0.54 | 1.29 | 3.25 | 3.28 |
| Pro-social behavior | |||||
| δ | −6.39 | −5.79 | 3.87 | 6.72 | −15.79 |
The effects of bilingualism on language, emotional, and pro-social development – PSM analysis
| Age 3 | Age 5 | Age 7 | Age 11 | Age 14 | |
|---|---|---|---|---|---|
| Panel (A): Outcome: z-Verbal reasoning skills | |||||
| Multivariate nearest neighbor matching | |||||
| Bilingualw−1 | −0.293*** (0.102) | −0.305*** (0.071) | 0.164* (0.092) | −0.089 (0.063) | 0.033 (0.071) |
| Kernel matching | |||||
| Bilingualw−1 | −0.361** (0.142) | −0.503** (0.215) | 0.005 (0.093) | −0.060 (0.125) | 0.045 (0.079) |
| Inverse probability weighting | |||||
| Bilingualw−1 | −0.374** (0.156) | −0.499*** (0.136) | 0.073 (0.129) | −0.024 (0.142) | 0.011 (0.066) |
| N | 1993 | 1682 | 1693 | 1504 | 1361 |
| Panel (B): Outcome: z-SDQ score | |||||
| Multivariate nearest neighbor matching | |||||
| Bilingualw−1 | 0.183** (0.093) | −0.012 (0.095) | 0.024 (0.082) | 0.026 (0.091) | 0.018 (0.087) |
| Kernel matching | |||||
| Bilingualw−1 | 0.106 (0.128) | 0.021 (0.152) | 0.084 (0.119) | −0.220* (0.125) | 0.042 (0.084) |
| Inverse probability weighting | |||||
| Bilingualw−1 | 0.121 (0.171) | 0.078 (0.142) | 0.177 (0.198) | −0.208 (0.127) | 0.001 (0.083) |
| N | 1993 | 1682 | 1693 | 1504 | 1361 |
| Panel (C): Outcome: z-Pro-social score | |||||
| Multivariate nearest neighbor matching | |||||
| Bilingualw−1 | −0.228** (0.091) | −0.010 (0.063) | 0.065 (0.067) | −0.034 (0.096) | −0.041 (0.070) |
| Kernel matching | |||||
| Bilingualw−1 | −0.294** (0.119) | −0.002 (0.214) | 0.023 (0.090) | −0.122 (0.142) | −0.073 (0.092) |
| Inverse probability weighting | |||||
| Bilingualw−1 | −0.353*** (0.108) | −0.071 (0.159) | −0.051 (0.155) | 0.021 (0.264) | −0.062 (0.075) |
| N | 1993 | 1682 | 1693 | 1504 | 1361 |
The effects of bilingualism on language development; the selected coefficient is child's age
| z-Verbal reasoning skills | |||||
|---|---|---|---|---|---|
| (I) 2–6 | Age 3 | Age 5 | Age 7 | Age 11 | Age 14 |
| Panel (A): OLS with basic controls | |||||
| Bilingualw−1 | −0.629*** (0.053) | −0.587*** (0.057) | 0.069 (0.059) | −0.246*** (0.064) | −0.153** (0.059) |
| R2 | 0.276 | 0.187 | 0.022 | 0.050 | 0.033 |
| Panel (B): OLS basic + full controls | |||||
| Bilingualw−1 | −0.352*** (0.062) | −0.379*** (0.067) | 0.096 (0.071) | −0.037 (0.071) | −0.077 (0.062) |
| R2 | 0.379 | 0.308 | 0.111 | 0.176 | 0.092 |
| Panel (C): OLS basic + full controls + past endowments | |||||
| Bilingualw−1 | −0.345*** (0.061) | −0.199*** (0.062) | 0.219*** (0.067) | −0.022 (0.068) | −0.085 (0.062) |
| z-Verbal reasoning skillsw−1 | 0.403*** (0.024) | 0.294*** (0.025) | 0.255*** (0.030) | 0.202*** (0.026) | |
| z-SDQ scorew−1 | −0.039* (0.021) | −0.182*** (0.026) | −0.030 (0.028) | −0.043 (0.028) | |
| R2 | 0.394 | 0.418 | 0.217 | 0.233 | 0.135 |
| N | 1993 | 1682 | 1693 | 1504 | 1361 |
The effects of bilingualism on language, emotional, and pro-social development, excluding those who arrived in the UK after 1997 – by child's age
| Age 3 | Age 5 | Age 7 | Age 11 | Age 14 | |
|---|---|---|---|---|---|
| Panel (A): Outcome: z-Verbal reasoning skills | |||||
| Bilingualw−1 | −0.368*** (0.065) | −0.172*** (0.066) | 0.215*** (0.073) | −0.040 (0.072) | −0.048 (0.066) |
| z-Verbal reasoning skillsw−1 | 0.393*** (0.025) | 0.298*** (0.027) | 0.256*** (0.031) | 0.210*** (0.027) | |
| z-SDQ scorew−1 | −0.035 (0.022) | −0.197*** (0.028) | −0.040 (0.030) | −0.033 (0.029) | |
| N | 1812 | 1525 | 1491 | 1329 | 1194 |
| R2 | 0.397 | 0.402 | 0.228 | 0.232 | 0.141 |
| Panel (B): Outcome: z-SDQ score | |||||
| Bilingualw−1 | 0.109 (0.072) | −0.100 (0.063) | −0.031 (0.056) | −0.117* (0.064) | 0.029 (0.075) |
| z-Verbal reasoning skillsw−1 | −0.040* (0.024) | −0.067*** (0.023) | −0.100*** (0.025) | −0.022 (0.032) | |
| z-SDQ score w−1 | 0.502*** (0.026) | 0.565*** (0.025) | 0.547*** (0.026) | 0.520*** (0.033) | |
| N | 1812 | 1525 | 1491 | 1329 | 1194 |
| R2 | 0.187 | 0.365 | 0.430 | 0.410 | 0.309 |
| Panel (C): Outcome: z-Pro-social score | |||||
| Bilingualw−1 | −0.051 (0.076) | −0.014 (0.079) | −0.004 (0.068) | 0.070 (0.077) | 0.112 (0.068) |
| z-Pro-social scorew−1 | 0.311*** (0.027) | 0.411*** (0.027) | 0.354*** (0.034) | 0.399*** (0.034) | |
| N | 1812 | 1525 | 1491 | 1329 | 1194 |
| R2 | 0.065 | 0.153 | 0.228 | 0.211 | 0.266 |
The effects of bilingualism on pro-social development; the selected coefficient is child's age
| z-Pro-social score | |||||
|---|---|---|---|---|---|
| (l) 2–6 | Age 3 | Age 5 | Age 7 | Age 11 | Age 14 |
| Panel (A): OLS with basic controls | |||||
| Bilingualw−1 | −0.114** (0.058) | 0.051 (0.062) | −0.014 (0.060) | −0.070 (0.070) | −0.048 (0.070) |
| R2 | 0.020 | 0.034 | 0.021 | 0.023 | 0.028 |
| Panel (B): OLS basic + full controls | |||||
| Bilingualw−1 | −0.089 (0.072) | 0.065 (0.086) | 0.035 (0.070) | 0.014 (0.081) | −0.030 (0.073) |
| R2 | 0.053 | 0.055 | 0.049 | 0.046 | 0.048 |
| Panel (C): OLS basic + full controls + past endowments | |||||
| Bilingualw−1 | −0.088 (0.071) | −0.002 (0.078) | 0.039 (0.063) | 0.071 (0.075) | 0.004 (0.066) |
| z-Pro-social scorew−1 | 0.306*** (0.026) | 0.399*** (0.026) | 0.395*** (0.032) | 0.414*** (0.030) | |
| R2 | 0.062 | 0.148 | 0.225 | 0.183 | 0.231 |
| N | 1993 | 1682 | 1693 | 1504 | 1361 |
Summary statistics of selected variables
| Monolingual | Bilingual | Difference | |||
|---|---|---|---|---|---|
| Outcomes | |||||
| Language development (verbal reasoning skills) | |||||
| Age 3 | 50.42 | [10.68] | 38.87 | [11.30] | −11.55*** |
| Age 5 | 55.1 | [10.69] | 43.95 | [11.65] | −11.15*** |
| Age 7 | 115.47 | [18.07] | 114.88 | [17.35] | −0.59 |
| Age 11 | 60.15 | [9.70] | 56.98 | [10.60] | −3.17*** |
| Age 14 | 6.98 | [3.38] | 6.1 | [2.80] | −0.88*** |
| Emotional development (SDQ score) | |||||
| Age 3 | 9.11 | [5.00] | 11.18 | [5.88] | 2.07*** |
| Age 5 | 6.89 | [4.60] | 8.49 | [5.29] | 1.61*** |
| Age 7 | 6.87 | [5.02] | 8.26 | [5.20] | 1.39*** |
| Age 11 | 7.07 | [5.37] | 7.71 | [5.25] | 0.64** |
| Age 14 | 13.3 | [3.89] | 14.35 | [4.33] | 1.05*** |
| Pro–social development | |||||
| Age 3 | 7.40 | [1.87] | 7.46 | [1.99] | 0.06 |
| Age 5 | 8.42 | [1.66] | 8.27 | [1.80] | −0.15** |
| Age 7 | 8.63 | [1.60] | 8.46 | [1.74] | −0.17** |
| Age 11 | 8.77 | [5.37] | 8.69 | [1.63] | −0.08 |
| Age 14 | 8.32 | [3.89] | 8.25 | [1.95] | −0.08 |
| Time–varying controls | |||||
| Child's age in months | |||||
| Age 3 | 37.62 | [2.34] | 38.24 | [3.21] | 0.62*** |
| Age 5 | 62.67 | [2.84] | 62.63 | [2.83] | −0.04 |
| Age 7 | 86.96 | [2.84] | 87.12 | [2.85] | 0.16 |
| Age 11 | 128.06 | [5.68] | 127.97 | [5.74] | −0.09 |
| Age 14 | 165.06 | [5.42] | 165.11 | [5.45] | 0.05 |
| Below 60% of the median UK income | |||||
| Age 3 | 0.29 | [0.45] | 0.54 | [0.50] | 0.25*** |
| Age 5 | 0.27 | [0.45] | 0.57 | [0.50] | 0.30*** |
| Age 7 | 0.26 | [0.44] | 0.55 | [0.50] | 0.29*** |
| Age 11 | 0.28 | [0.45] | 0.56 | [0.50] | 0.28*** |
| 9 months: Gross motor delay | 0.11 | [0.32] | 0.14 | [0.35] | 0.03* |
| 9 months: Fine motor delay | 0.12 | [0.33] | 0.14 | [0.35] | 0.02 |
| 9 months: Communication gesture delay | 0.41 | [0.49] | 0.43 | [0.50] | 0.03 |
| Parental inputs | |||||
| 9 months: Importance of stimulating the baby | 0.36 | [0.57] | 0.58 | [0.67] | 0.22*** |
| 9 months: Importance of talking to the baby | 0.15 | [0.38] | 0.31 | [0.53] | 0.16*** |
| 9 months: Importance of cuddling the baby | 0.12 | [0.34] | 0.24 | [0.51] | 0.13*** |
| 9 months: Importance of regular sleep/feeding time | 0.59 | [0.75] | 0.75 | [0.82] | 0.16*** |
| Age 3: Frequency of the child being taken to the library | 0.56 | [0.78] | 0.41 | [0.73] | −0.15*** |
| Age 3: Frequency reading to the child | 3.31 | [0.98] | 2.67 | [1.34] | −0.63*** |
| Age 5: Frequency of the child being taken to the library | 0.73 | [0.67] | 0.68 | [0.72] | −0.05* |
| Age 5: Frequency reading to the child | 2.45 | [0.63] | 2.31 | [0.75] | −0.14*** |
| Age 7: Frequency of the child being taken to the library | 0.75 | [0.66] | 0.8 | [0.72] | 0.05 |
| Age 7: Frequency reading to the child | 2.11 | [1.59] | 2.36 | [1.45] | 0.26*** |
| Time invariant controls | |||||
| Male | 0.52 | [0.50] | 0.5 | [0.50] | −0.02 |
| Birth weight | 1.23 | [0.75] | 1.71 | [1.05] | 0.48*** |
| Young migrant | 0.77 | [0.42] | 0.52 | [0.50] | −0.24*** |
| Mother born non–English country | 0.26 | [0.44] | 0.88 | [0.33] | 0.62*** |
| Father born non–English country | 0.27 | [0.44] | 0.88 | [0.33] | 0.61*** |
| Child is white | 0.72 | [0.45] | 0.12 | [0.33] | −0.60*** |
| Mother with higher qualification | 0.43 | [0.50] | 0.32 | [0.47] | −0.11*** |
| Father with higher qualification | 0.59 | [0.49] | 0.57 | [0.50] | −0.01 |
Heterogeneous effects of bilingualism, by children's gender
| Age 3 | Age 5 | Age 7 | Age 11 | Age 14 | |
|---|---|---|---|---|---|
| Panel (A): Outcome: z-Verbal Reasoning skills | |||||
| Boys | |||||
| Bilingualw−1 | −0.320*** (0.085) | −0.207** (0.090) | 0.242** (0.110) | 0.090 (0.101) | −0.200** (0.094) |
| N | 1012 | 840 | 832 | 731 | 662 |
| R2 | 0.381 | 0.425 | 0.227 | 0.223 | 0.157 |
| Girls | |||||
| Bilingualw−1 | −0.352*** (0.087) | −0.179** (0.084) | 0.148* (0.085) | −0.155* (0.089) | 0.007 (0.083) |
| N | 981 | 842 | 861.000 | 773 | 699 |
| R2 | 0.424 | 0.440 | 0.224 | 0.268 | 0.132 |
| Panel (B): Outcome: z-SDQ score | |||||
| Boys | |||||
| Bilingualw−1 | 0.145 (0.096) | −0.165* (0.092) | −0.060 (0.080) | −0.187** (0.088) | −0.076 (0.105) |
| N | 1012 | 840 | 832 | 731 | 662 |
| R2 | 0.175 | 0.357 | 0.442 | 0.427 | 0.323 |
| Girls | |||||
| Bilingualw−1 | 0.093 (0.100) | −0.041 (0.080) | −0.005 (0.074) | −0.009 (0.082) | 0.124 (0.097) |
| N | 981 | 842 | 861 | 773 | 699 |
| R2 | 0.201 | 0.356 | 0.409 | 0.358 | 0.261 |
| Panel (C): Outcome: z-Pro-social score | |||||
| Boys | |||||
| Bilingualw−1 | −0.126 (0.102) | 0.092 (0.122) | 0.006 (0.099) | −0.001 (0.108) | 0.069 (0.098) |
| N | 1012 | 840 | 832 | 731 | 662 |
| R2 | 0.076 | 0.136 | 0.184 | 0.187 | 0.256 |
| Girls | |||||
| Bilingualw−1 | −0.021 (0.102) | −0.093 (0.101) | 0.076 (0.078) | 0.184* (0.103) | 0.099 (0.083) |
| N | 981 | 842 | 861 | 773 | 699 |
| R2 | 0.067 | 0.153 | 0.256 | 0.192 | 0.217 |
Heterogeneous effects of bilingualism, by mother's level of education
| Age 3 | Age 5 | Age 7 | Age 11 | Age 14 | |
|---|---|---|---|---|---|
| Panel (A): Outcome: z-Verbal reasoning skills | |||||
| Mother's education – “High” | |||||
| Bilingualw−1 | −0.430*** (0.152) | −0.205 (0.132) | −0.132 (0.126) | −0.061 (0.147) | −0.270 (0.223) |
| N | 339 | 310 | 286 | 267 | 241 |
| R2 | 0.365 | 0.318 | 0.248 | 0.194 | 0.248 |
| Mother's education – A-level and below | |||||
| Bilingualw−1 | −0.328*** (0.067) | −0.200*** (0.071) | 0.279*** (0.078) | −0.018 (0.079) | 0.019 (0.063) |
| N | 1654 | 1372 | 1407 | 1237 | 1120 |
| R2 | 0.376 | 0.414 | 0.217 | 0.22 | 0.118 |
| Panel (B): Outcome: z-SDQ score | |||||
| Mother's education – “High” | |||||
| Bilingualw−1 | −0.025 (0.144) | −0.080 (0.116) | 0.083 (0.101) | 0.100 (0.126) | 0.023 (0.188) |
| N | 339 | 310 | 286 | 267 | 241 |
| R2 | 0.199 | 0.455 | 0.45 | 0.459 | 0.248 |
| Mother's education – A-level and below | |||||
| Bilingualw−1 | 0.128* (0.076) | −0.105 (0.071) | −0.056 (0.063) | −0.135** (0.068) | 0.065 (0.075) |
| N | 1654 | 1372 | 1407 | 1237 | 1120 |
| R2 | 0.161 | 0.343 | 0.404 | 0.377 | 0.276 |
| Panel (C): Outcome: z-Pro-social score | |||||
| Mother's education – “High” | |||||
| Bilingualw−1 | 0.404** (0.187) | 0.016 (0.146) | −0.022 (0.127) | −0.059 (0.148) | −0.216 (0.191) |
| N | 339 | 310 | 286 | 267 | 241 |
| R2 | 0.121 | 0.27 | 0.424 | 0.382 | 0.389 |
| Mother's education – A-level and below | |||||
| Bilingualw−1 | −0.177** (0.078) | −0.006 (0.092) | 0.044 (0.074) | 0.084 (0.086) | 0.110 (0.067) |
| N | 1654 | 1372 | 1407 | 1237 | 1120 |
| R2 | 0.069 | 0.143 | 0.227 | 0.171 | 0.221 |
The effects of bilingualism on language, emotional, and pro-social development, excluding native-born parents – by child's age
| Age 3 | Age 5 | Age 7 | Age 11 | Age 14 | |
|---|---|---|---|---|---|
| Panel (A): Outcome: z-Verbal reasoning skills | |||||
| Bilingualw−1 | −0.320*** (0.065) | −0.203*** (0.070) | 0.237*** (0.071) | −0.012 (0.074) | −0.087 (0.063) |
| z-Verbal reasoning skillsw−1 | 0.441*** (0.030) | 0.317*** (0.029) | 0.290*** (0.037) | 0.192*** (0.030) | |
| z-SDQ scorew−1 | −0.053** (0.025) | −0.143*** (0.028) | 0.007 (0.034) | −0.064** (0.031) | |
| N | 1386 | 1148 | 1191 | 1058 | 986 |
| R2 | 0.375 | 0.422 | 0.225 | 0.272 | 0.139 |
| Panel (B): Outcome: z-SDQ score | |||||
| Bilingualw−1 | 0.117 (0.074) | −0.103 (0.069) | −0.052 (0.058) | −0.028 (0.064) | 0.008 (0.073) |
| z-Verbal reasoning skillsw−1 | −0.049* (0.030) | −0.042 (0.026) | −0.119*** (0.029) | −0.014 (0.038) | |
| z-SDQ scorew−1 | 0.491*** (0.032) | 0.506*** (0.027) | 0.481*** (0.029) | 0.458*** (0.037) | |
| N | 1386 | 1148 | 1191 | 1058 | 986 |
| R2 | 0.174 | 0.349 | 0.395 | 0.353 | 0.250 |
| Panel (C): Outcome: z-Pro-social score | |||||
| Bilingualw−1 | −0.121 (0.077) | −0.017 (0.089) | 0.074 (0.066) | 0.043 (0.081) | 0.046 (0.064) |
| z-Pro-social scorew−1 | 0.275*** (0.031) | 0.365*** (0.032) | 0.270*** (0.041) | 0.354*** (0.036) | |
| N | 1386 | 1148 | 1191 | 1058 | 986 |
| R2 | 0.059 | 0.133 | 0.192 | 0.171 | 0.234 |
Bilingual mother's behavior, well-being, and home inputs, by child's age
| (1) | (2) | (3) | (4) | (5) | (6) | |
|---|---|---|---|---|---|---|
| Time spent with child | Frequency of reading | Good relationship with partner | Depressive symptoms | Life | Mother | |
| Age 9 months | ||||||
| Bilingual motherw−1 | 0.082** (0.032) | −0.069*** (0.025) | 0.231* (0.133) | −0.041 (0.032) | ||
| N | 3035 | 3035 | 3035 | 3035 | ||
| Age 3 | ||||||
| Bilingual motherw−1 | 0.074*** (0.028) | 0.174*** (0.067) | 0.093** (0.041) | −0.112*** (0.030) | 0.329** (0.151) | −0.051 (0.034) |
| N | 1993 | 1993 | 1993 | 1993 | 1993 | 1993 |
| Age 5 | ||||||
| Bilingual motherw−1 | 0.097*** (0.035) | 0.039 (0.069) | 0.085** (0.039) | −0.053*** (0.019) | 0.501*** (0.163) | −0.061* (0.034) |
| N | 1682 | 1682 | 1682 | 1682 | 1682 | 1682 |
| Age 7 | ||||||
| Bilingual motherw−1 | 0.074** (0.032) | 0.318*** (0.115) | −0.001 (0.015) | 0.265* (0.138) | −0.053 (0.034) | |
| N | 1693 | 1693 | 1693 | 1693 | 1693 | |
| Age 11 | ||||||
| Bilingual motherw−1 | 0.024 (0.044) | 0.029 (0.021) | 0.267* (0.152) | −0.168*** (0.029) | ||
| N | 1504 | 1504 | 1504 | 1504 | ||
| Age 14 | ||||||
| Bilingual motherw−1 | −0.021 (0.031) | 0.359* (0.186) | −0.191*** (0.031) | |||
| N | 1361 | 1361 | 1361 | |||
The effects of bilingualism on emotional development; the selected coefficient is child's age
| z-SDQ score | |||||
|---|---|---|---|---|---|
| (I) 2–6 | Age 3 | Age 5 | Age 7 | Age 11 | Age 14 |
| Panel (A): OLS with basic controls | |||||
| Bilingualw−1 | 0.219*** (0.058) | 0.055 (0.057) | 0.091 (0.056) | 0.049 (0.065) | 0.081 (0.072) |
| R2 | 0.086 | 0.067 | 0.055 | 0.023 | 0.022 |
| Panel (B): OLS basic + full controls | |||||
| Bilingualw−1 | 0.109 (0.069) | −0.049 (0.073) | −0.031 (0.066) | −0.056 (0.072) | −0.038 (0.078) |
| R2 | 0.165 | 0.126 | 0.118 | 0.083 | 0.084 |
| Panel (C): OLS basic + full controls + past endowments | |||||
| Bilingualw−1 | 0.105 (0.068) | −0.106* (0.061) | −0.043 (0.054) | −0.095 (0.060) | 0.006 (0.071) |
| z-Verbal reasoning skillsw −1 | −0.033 (0.023) | −0.047** (0.022) | −0.110*** (0.024) | −0.016 (0.032) | |
| z-SDQ scorew−1 | 0.493*** (0.025) | 0.561*** (0.023) | 0.520*** (0.025) | 0.494*** (0.031) | |
| R2 | 0.175 | 0.354 | 0.420 | 0.386 | 0.276 |
| N | 1993 | 1682 | 1693 | 1504 | 1361 |