
Figure 1
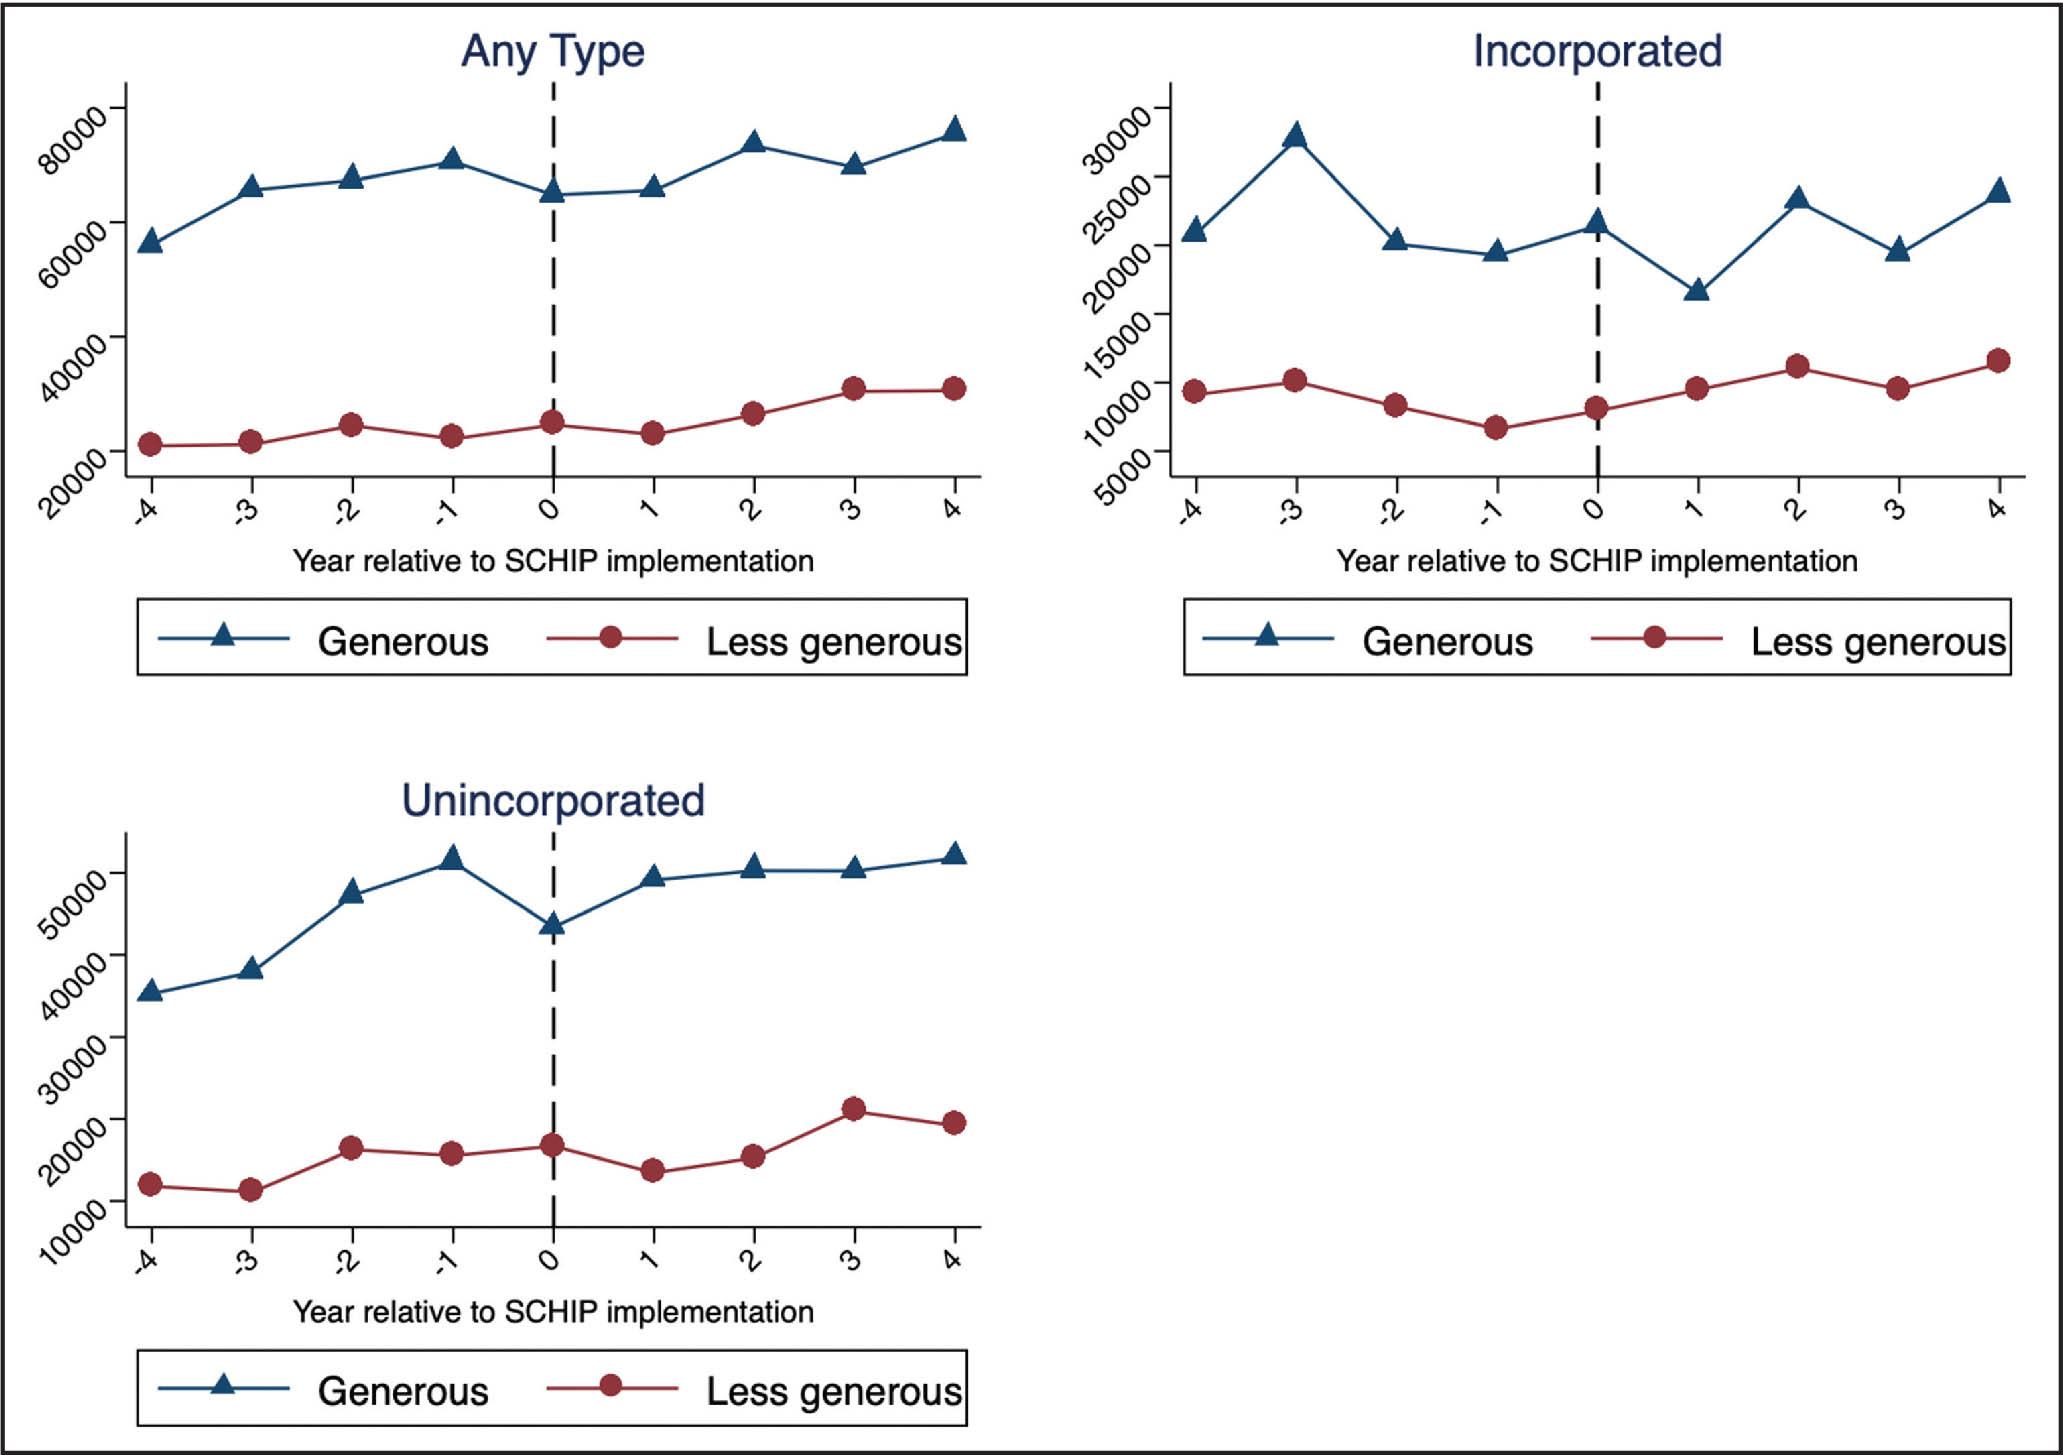
Figure 2
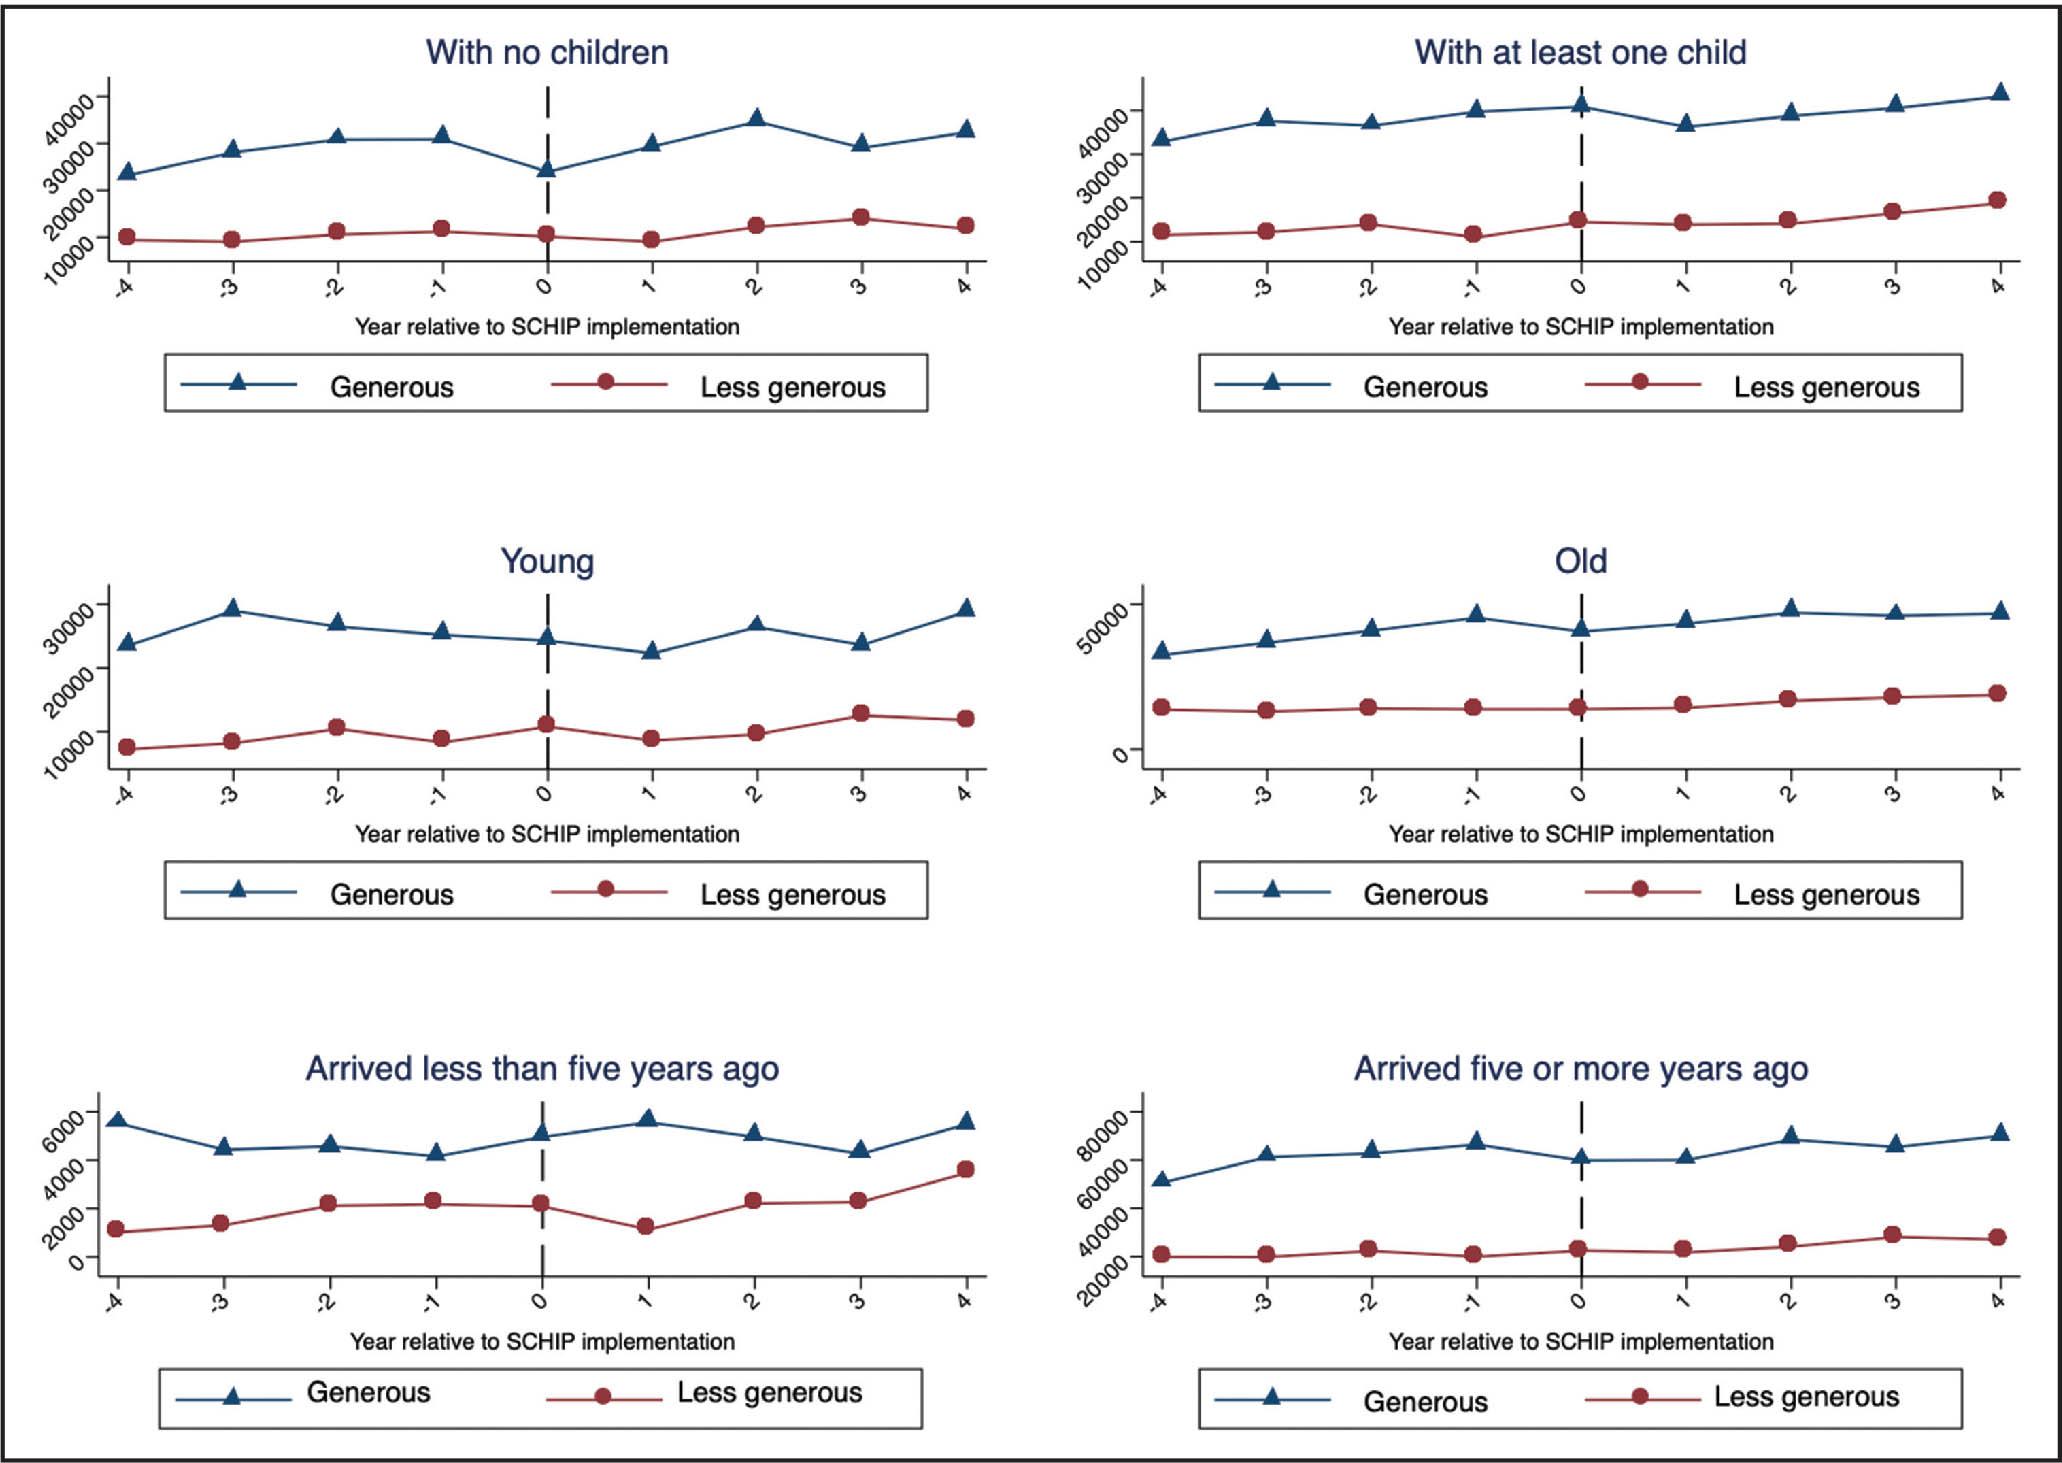
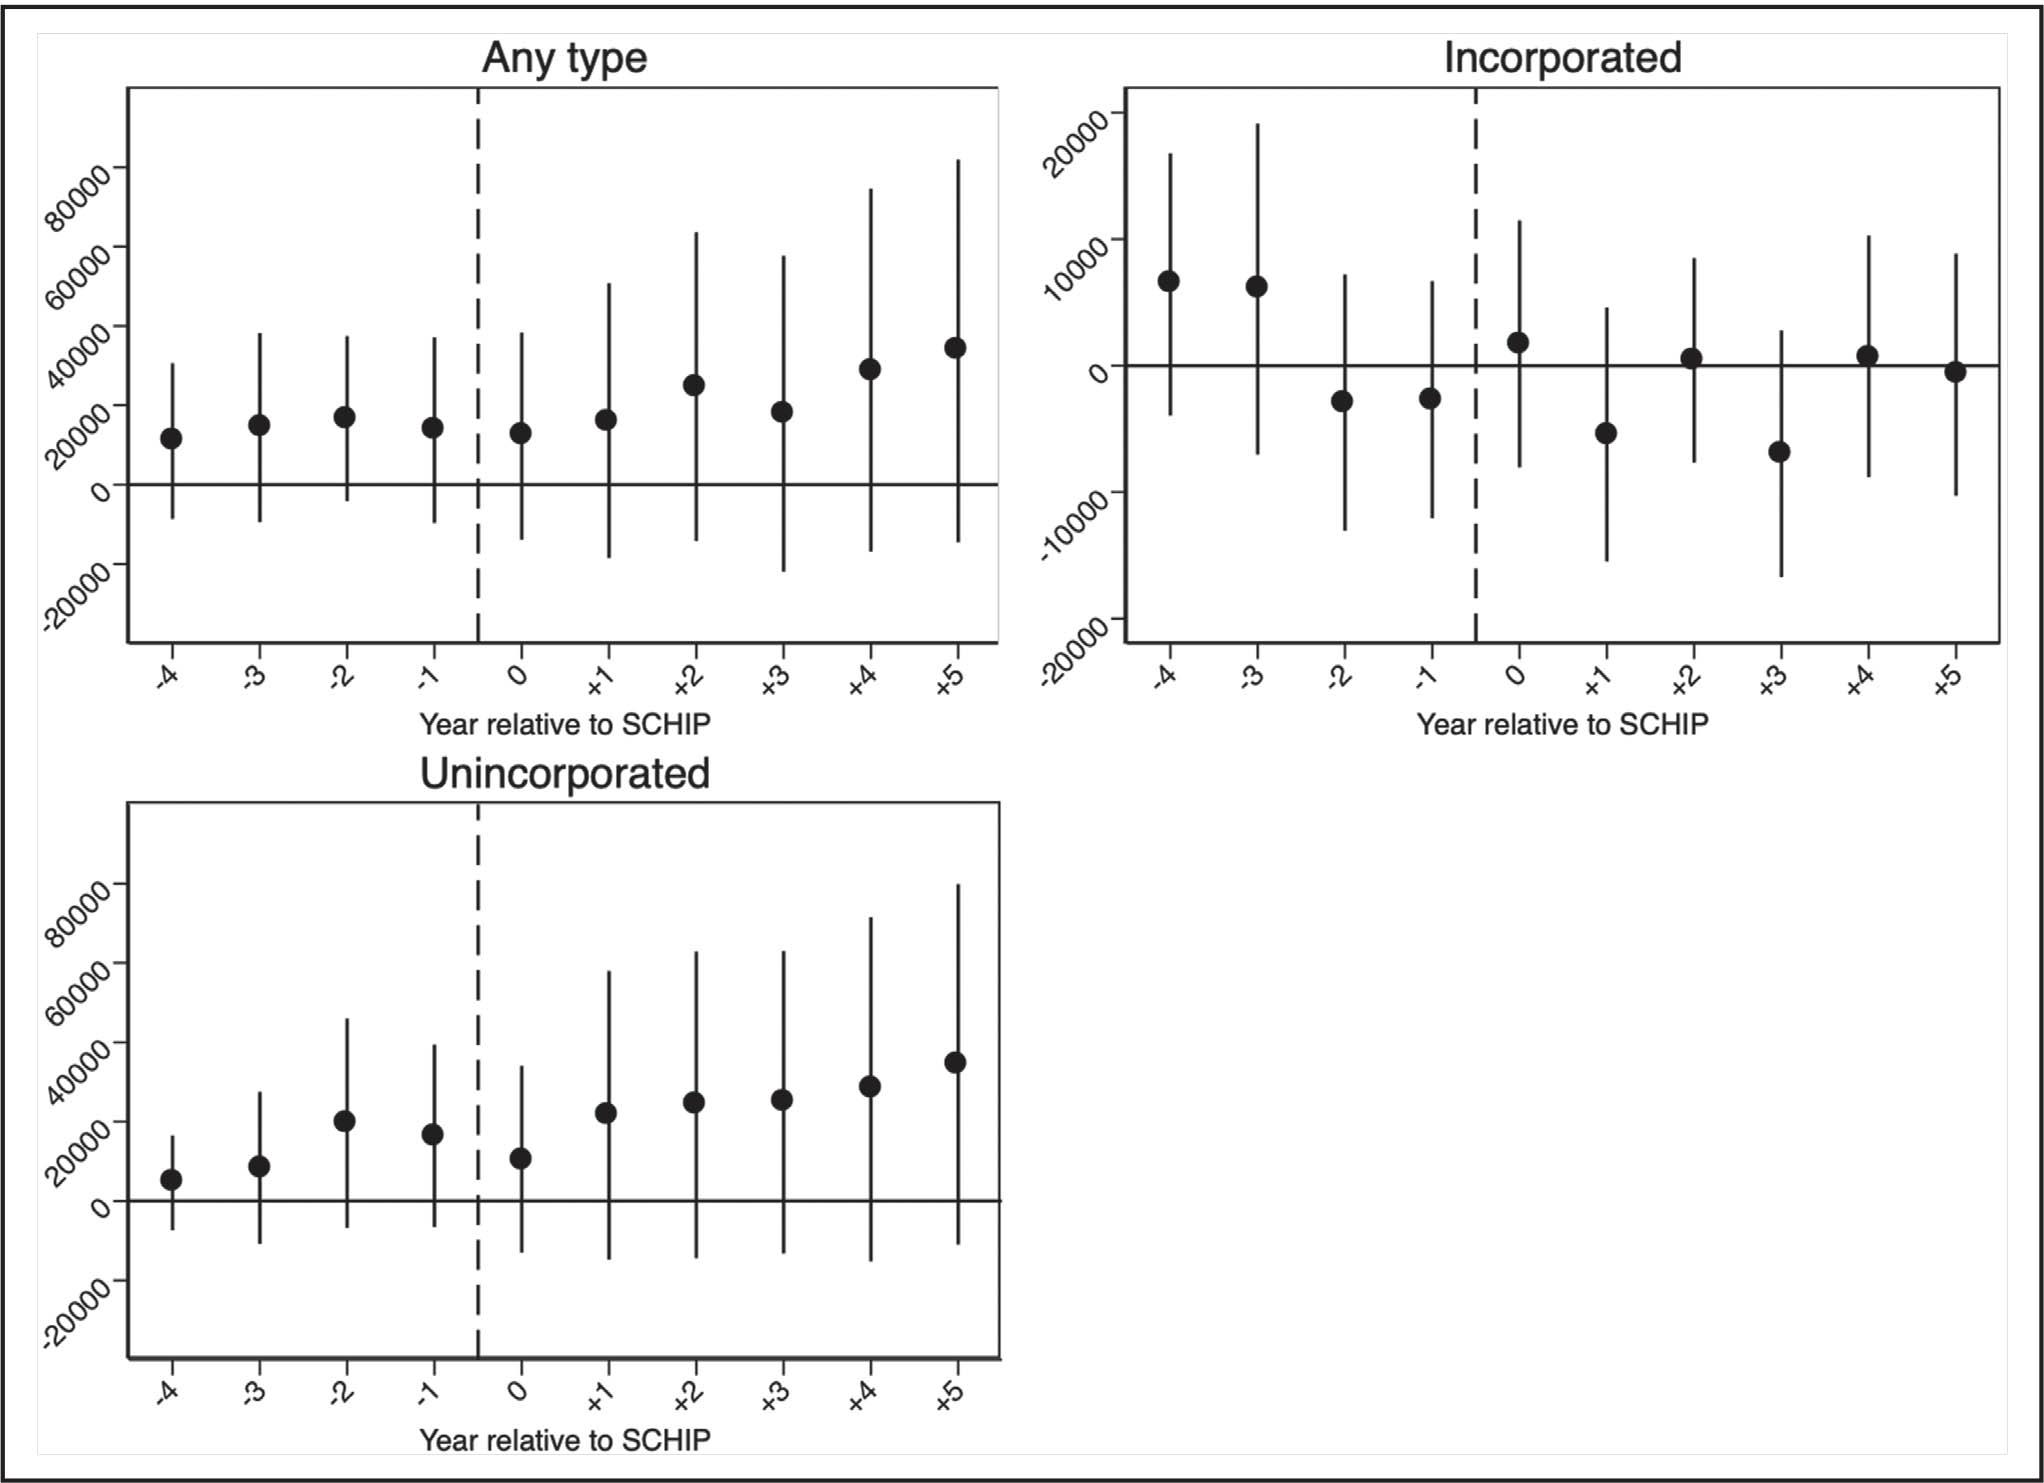
Figure 3
Heterogeneity in the Impact of Immigrant Entrepreneurs across Skill Levels of Natives: First Stage Estimates for High Skilled
| Outcome | Any self-employment | Incorporated self-employment | Unincorporated self-employment |
|---|---|---|---|
| Generous SCHIP | 0.04370*** (0.00251) | 0.02993*** (0.00130) | 0.01377*** (0.00185) |
| Age | 0.00000 (0.00004) | −0.00001 (0.00002) | 0.00001 (0.00003) |
| Female | 0.00047 (0.00082) | −0.00023 (0.00039) | 0.00070 (0.00067) |
| College degree | −0.00021 (0.00088) | −0.00019 (0.00042) | −0.00002 (0.00072) |
| White | −0.00965*** (0.00298) | −0.00237* (0.00128) | −0.00728*** (0.00247) |
| Black | −0.01125*** (0.00336) | −0.00238 (0.00148) | −0.00887*** (0.00277) |
| Hispanic | 0.00012 (0.00385) | 0.00142 (0.00164) | −0.00130 (0.00320) |
| Number of children | −0.00093** (0.00036) | −0.00049*** (0.00017) | −0.00044 (0.00030) |
| Lives in a city | 0.00487*** (0.00090) | 0.00240*** (0.00045) | 0.00247*** (0.00074) |
| State population | 0.68288*** (0.00205) | 0.18323*** (0.00087) | 0.49965*** (0.00176) |
| Observations | 203,275 | 203,275 | 203,275 |
Results from Nonlinear Models
| Outcome | Any self-employment | Incorporated self-employment | Unincorporated self-employment |
|---|---|---|---|
| Entrepreneurial propensity of natives: | 0.0950 | 0.0345 | 0.0606 |
| Probit | |||
| Immigrant entrepreneurs | 0.0064*** (0.0019) | 0.0068*** (0.0023) | 0.0035* (0.0019) |
| Observations | 609,365 | 609,365 | 609,365 |
| IV probit | |||
| Second stage: | |||
| Immigrant entrepreneurs | 0.0067 (0.0475) | 0.0083 (0.0459) | 0.0037 (0.1116) |
| First stage F-stat | 2101.30 | 2697.76 | 1374.92 |
| Observations | 609,365 | 609,365 | 609,365 |
Results using Immigrant Entrepreneurship Rate as the Key Explanatory Variable
| Outcome | Any self-employment | Incorporated self-employment | Unincorporated self-employment |
|---|---|---|---|
| Entrepreneurial propensity of natives | 0.0950 | 0.0345 | 0.0606 |
| LPM | |||
| Immigrant entrepreneurship rate | 0.00042** (0.00020) | 0.00027 (0.00027) | 0.00018 (0.00019) |
| Observations | 609,365 | 609,365 | 609,365 |
| TSLS | |||
| Second stage | |||
| Immigrant entrepreneurship rate | 0.0029 (0.0125) | 0.0299 (0.0266) | 0.0089 (0.0082) |
| First stage F-stat | 92.93 | 25.20 | 174.76 |
| Observations | 609,365 | 609,365 | 609,365 |
SCHIP Implementation and Immigrant Coverage by State
| State | Date of SCHIP implementation | Coverage for new immigrants |
|---|---|---|
| Alaska (AK) | March 1999 | Yes |
| Alabama (AL) | February 1998 | No |
| Arkansas (AR) | October 1998 | No |
| Arizona (AZ) | October 1997 | No |
| California (CA) | July 1998 | Yes |
| Colorado (CO) | April 1998 | No |
| Connecticut (CT) | October 1997 | No |
| District of Columbia (DC) | September 1997 | Yes |
| Delaware (DE) | October 1998 | Yes |
| Florida (FL) | April 1998 | No |
| Georgia (GA) | September 1998 | No |
| Hawaii (HI) | January 2000 | Yes |
| Iowa (IA) | July 1998 | No |
| Idaho (ID) | October 1997 | No |
| Illinois (IL) | January 1998 | Yes |
| Indiana (IN) | October 1997 | No |
| Kansas (KS) | July 1998 | No |
| Kentucky (KY) | July 1998 | No |
| Louisiana (LA) | November 1998 | No |
| Massachusetts (MA) | October 1997 | Yes |
| Maryland (MD) | July 1998 | No |
| Maine (ME) | July 1998 | No |
| Michigan (MI) | May 1998 | No |
| Minnesota (MN) | September 1998 | Yes |
| Missouri (MO) | October 1997 | No |
| Mississippi (MS) | July 1998 | No |
| Montana (MT) | January 1998 | No |
| North Carolina (NC) | October 1998 | No |
| North Dakota (ND) | October 1998 | No |
| Nebraska (NE) | May 1998 | Yes |
| New Hampshire (NH) | May 1998 | No |
| New Jersey (NJ) | February 1998 | Yes |
| New Mexico (NM) | May 1998 | Yes |
| Nevada (NV) | October 1998 | No |
| New York (NY) | April 1998 | Yes |
| Ohio (OH) | January 1998 | No |
| Oklahoma (OK) | December 1997 | No |
| Oregon (OR) | July 1998 | No |
| Pennsylvania (PA) | June 1998 | Yes |
| Rhode Island (RI) | October 1997 | No |
| South Carolina (SC) | October 1997 | No |
| South Dakota (SD) | July 1998 | No |
| Tennessee (TN) | October 1997 | No |
| Texas (TX) | July 1998 | No |
| Utah (UT) | August 1998 | No |
| Virginia (VA) | October 1998 | Yes |
| Vermont (VT) | October 1998 | No |
| Washington (WA) | January 2000 | Yes |
| Wisconsin (WI) | April 1999 | No |
| West Virginia (WV) | July 1998 | No |
| Wyoming (WY) | April 1999 | No |
Heterogeneity in the Impact of Immigrant Entrepreneurs across Skill Levels of Natives: Second Stage Estimates for High Skilled
| Outcome | Any self-employment | Incorporated self-employment | Unincorporated self-employment |
|---|---|---|---|
| Immigrant entrepreneurs | 0.03144 (0.05516) | −0.04661 (0.04708) | 0.18127 (0.13897) |
| Age | 0.00412*** (0.00007) | 0.00189*** (0.00004) | 0.00223*** (0.00005) |
| Female | −0.04593*** (0.00138) | −0.04148*** (0.00093) | −0.00449*** (0.00109) |
| College degree | −0.00477*** (0.00155) | −0.00353*** (0.00108) | −0.00125 (0.00119) |
| White | 0.01376*** (0.00394) | 0.00908*** (0.00245) | 0.00503 (0.00359) |
| Black | −0.03556*** (0.00437) | −0.01289*** (0.00273) | −0.02224*** (0.00404) |
| Hispanic | −0.02256*** (0.00446) | −0.00520* (0.00289) | −0.01726*** (0.00361) |
| Number of children | 0.01358*** (0.00068) | 0.00855*** (0.00048) | 0.00504*** (0.00052) |
| Lives in a city | 0.00794*** (0.00244) | −0.00501*** (0.00159) | 0.01288*** (0.00202) |
| State population | 0.01691 (0.06453) | 0.01176 (0.01675) | −0.01816 (0.12021) |
| Observations | 203,275 | 203,275 | 203,275 |
Heterogeneity in the Impact of Immigrant Entrepreneurs across Races of Natives: Second Stage Estimates for Whites
| Outcome | Any self-employment | Incorporated self-employment | Unincorporated self-employment |
|---|---|---|---|
| Immigrant entrepreneurs | −0.04320 (0.10143) | 0.02171 (0.07292) | 0.51066 (0.56062) |
| Age | 0.00349*** (0.00004) | 0.00157*** (0.00003) | 0.00192*** (0.00004) |
| Female | −0.05136*** (0.00091) | −0.03497*** (0.00057) | −0.01634*** (0.00078) |
| High school | −0.00803*** (0.00258) | 0.01112*** (0.00126) | −0.01905*** (0.00239) |
| Some college | −0.00276 (0.00258) | 0.01721*** (0.00128) | −0.01973*** (0.00240) |
| College degree | 0.00565** (0.00263) | 0.03003*** (0.00135) | −0.02478*** (0.00246) |
| Advanced degree | 0.01165*** (0.00284) | 0.03379*** (0.00155) | −0.02236*** (0.00257) |
| Number of children | 0.01590*** (0.00044) | 0.00799*** (0.00028) | 0.00797*** (0.00038) |
| Lives in a city | 0.02021*** (0.00136) | −0.00470*** (0.00076) | 0.02409*** (0.00163) |
| State population | −0.02639 (0.06614) | 0.00969 (0.01300) | −0.24279 (0.26639) |
| Observations | 461,397 | 461,397 | 461,397 |
Effect of SCHIP on Entry of Immigrants into Entrepreneurship
| Entry into entrepreneurship (measured as a proportion) | Entry into entrepreneurship (measured as count) | |
|---|---|---|
| Sample mean/proportion | 0.007 | 1,324.39 |
| SCHIP | 0.0090*** (0.0001) | 0.0156*** (0.0012) |
| Observations | 609,365 | 609,365 |
Heterogeneity in the Impact of Immigrant Entrepreneurs across Skill Levels of Natives: First Stage Estimates for Low Skilled
| Outcome | Any self-employment | Incorporated self-employment | Unincorporated self-employment |
|---|---|---|---|
| Generous SCHIP | 0.04620*** (0.00167) | 0.03038*** (0.00087) | 0.01582*** (0.00124) |
| Age | −0.00003 (0.00003) | 0.00001 (0.00001) | −0.00003 (0.00002) |
| Female | −0.00007 (0.00056) | 0.00021 (0.00027) | −0.00028 (0.00046) |
| High school | −0.00047 (0.00110) | 0.00064 (0.00054) | −0.00111 (0.00091) |
| Some college | −0.00085 (0.00111) | 0.00082 (0.00054) | −0.00167* (0.00092) |
| White | −0.00437*** (0.00165) | −0.00060 (0.00072) | −0.00376*** (0.00134) |
| Black | −0.00721*** (0.00187) | −0.00213** (0.00084) | −0.00508*** (0.00152) |
| Hispanic | −0.00117 (0.00203) | 0.00056 (0.00088) | −0.00173 (0.00165) |
| Number of children | −0.00000 (0.00025) | 0.00012 (0.00012) | −0.00012 (0.00021) |
| Lives in a city | 0.00375*** (0.00054) | 0.00168*** (0.00028) | 0.00207*** (0.00045) |
| State population | 0.65169*** (0.00139) | 0.17641*** (0.00060) | 0.47528*** (0.00117) |
| Observations | 406,090 | 406,090 | 406,090 |
Impact of Supply of Immigrant Entrepreneurs on Entrepreneurial Propensities of Natives: LPM
| Outcome | Any self-employment | Incorporated self-employment | Unincorporated self-employment |
|---|---|---|---|
| Entrepreneurial propensity of natives: | 0.0950 | 0.0345 | 0.0606 |
| Immigrant entrepreneurs | 0.0035** (0.0014) | 0.0064*** (0.0017) | 0.0025* (0.0014) |
| Age | 0.00310*** (0.00003) | 0.00139*** (0.00002) | 0.00171*** (0.00002) |
| Female | −0.04504*** (0.00055) | −0.02901*** (0.00034) | −0.01603*** (0.00045) |
| High school | −0.00688*** (0.00135) | 0.00903*** (0.00064) | −0.01591*** (0.00122) |
| Some college | −0.00141 (0.00135) | 0.01478*** (0.00065) | −0.01619*** (0.00122) |
| College degree | 0.00642*** (0.00141) | 0.02653*** (0.00072) | −0.02011*** (0.00125) |
| Advanced degree | 0.01341*** (0.00156) | 0.03144*** (0.00087) | −0.01804*** (0.00135) |
| White | 0.02559*** (0.00148) | 0.01142*** (0.00085) | 0.01416*** (0.00126) |
| Black | −0.02389*** (0.00159) | −0.01070*** (0.00091) | −0.01320*** (0.00135) |
| Hispanic | −0.01709*** (0.00161) | −0.00484*** (0.00091) | −0.01226*** (0.00137) |
| Number of children | 0.01181*** (0.00026) | 0.00626*** (0.00016) | 0.00555*** (0.00021) |
| Lives in a city | 0.01484*** (0.00085) | −0.00430*** (0.00048) | 0.01914*** (0.00072) |
| State population | 0.00027 (0.00087) | 0.00080** (0.00037) | −0.00043 (0.00071) |
| Observations | 1,111,863 | 1,111,863 | 1,111,863 |
First-stage regressions: impact of generous SCHIP on supply of immigrant entrepreneurs
| Outcome | Any self-employment | Incorporated self-employment | Unincorporated self-employment |
|---|---|---|---|
| Average supply of immigrant entrepreneurs: | 144,200 | 41,800 | 102,400 |
| Generous SCHIP | 0.1160*** (0.0025) | 0.0493*** (0.0009) | 0.0668*** (0.0018) |
| First stage F-stat | 2,101.30 | 2,697.76 | 1,374.92 |
| Observations | 609,365 | 609,365 | 609,365 |
Heterogeneity in the Impact of Immigrant Entrepreneurs across Races of Natives: First Stage Estimates for Blacks
| Outcome | Any self-employment | Incorporated self-employment | Unincorporated self-employment |
|---|---|---|---|
| Generous SCHIP | 0.09265*** (0.00440) | 0.02986*** (0.00238) | 0.06280*** (0.00327) |
| Age | 0.00001 (0.00007) | 0.00004 (0.00003) | −0.00004 (0.00006) |
| Female | 0.00017 (0.00142) | 0.00013 (0.00071) | 0.00005 (0.00116) |
| High school | −0.00049 (0.00242) | 0.00229* (0.00133) | −0.00278 (0.00201) |
| Some college | −0.00507** (0.00252) | 0.00230* (0.00137) | −0.00737*** (0.00210) |
| College degree | 0.00107 (0.00287) | 0.00467*** (0.00152) | −0.00360 (0.00238) |
| Advanced degree | 0.00084 (0.00344) | 0.00235 (0.00180) | −0.00151 (0.00283) |
| Number of children | 0.00112* (0.00062) | 0.00009 (0.00031) | 0.00103** (0.00051) |
| Lives in a city | 0.00309 (0.00213) | 0.00175 (0.00121) | 0.00134 (0.00174) |
| State population | 0.61485*** (0.00343) | 0.16403*** (0.00149) | 0.45081*** (0.00284) |
| Observations | 64,163 | 64,163 | 64,163 |
Heterogeneity in the Impact of Immigrant Entrepreneurs across Races of Natives: Second Stage Estimates for Blacks
| Outcome | Any self-employment | Incorporated self-employment | Unincorporated self-employment |
|---|---|---|---|
| Immigrant entrepreneurs | 0.09242* (0.05191) | 0.02171 (0.08435) | 0.12605* (0.06622) |
| Age | 0.00142*** (0.00008) | 0.00038*** (0.00004) | 0.00105*** (0.00007) |
| Female | −0.02960*** (0.00177) | −0.01345*** (0.00098) | −0.01614*** (0.00150) |
| High school | −0.00514 (0.00342) | 0.00246* (0.00132) | −0.00735** (0.00320) |
| Some college | −0.00147 (0.00351) | 0.00613*** (0.00139) | −0.00719** (0.00327) |
| College | 0.00754* (0.00391) | 0.01698*** (0.00191) | −0.00899*** (0.00348) |
| Advanced degree | 0.01911*** (0.00493) | 0.02570*** (0.00285) | −0.00637 (0.00413) |
| Number of children | 0.00388*** (0.00074) | 0.00233*** (0.00042) | 0.00152** (0.00063) |
| Lives in a city | −0.00109 (0.00353) | −0.00188 (0.00159) | 0.00087 (0.00318) |
| State population | −0.05595* (0.03182) | −0.00293 (0.01364) | −0.05658* (0.02985) |
| Observations | 64,163 | 64,163 | 64,163 |
Impact of immigrant entrepreneurs on entrepreneurial propensities of natives: LPM
| Outcome | Any self-employment | Incorporated self-employment | Unincorporated self-employment |
|---|---|---|---|
| Entrepreneurial propensity of natives: | 0.0950 | 0.0345 | 0.0606 |
| Immigrant entrepreneurs | 0.0035** (0.0014) | 0.0064*** (0.0017) | 0.0025* (0.0014) |
| Observations | 1,111,863 | 1,111,863 | 1,111,863 |
Sensitivity to modeling and sampling choices: TSLS estimates
| Outcome | Any self-employment | Incorporated self-employment | Unincorporated self-employment |
|---|---|---|---|
| Entrepreneurial propensity of natives: | 0.0950 | 0.0345 | 0.0606 |
| State specific linear trends | |||
| Immigrant entrepreneurs | 0.0080 (0.0161) | 0.0875 (0.0993) | −0.0005 (0.0150) |
| Observations | 609,352 | 609,352 | 609,352 |
| Weighted least squares | |||
| Immigrant entrepreneurs | 0.0130 (0.0667) | −0.0320 (0.0407) | 1.2307 (1.9806) |
| Observations | 609,365 | 609,365 | 609,365 |
| Clustered standard errors | |||
| Immigrant entrepreneurs | 0.0109 (0.0611) | –0.0491 (0.1231) | 0.1268 (0.3590) |
| Observations | 609,365 | 609,365 | 609,365 |
| Logged explanatory variable | |||
| Immigrant entrepreneurs | −0.0057 (0.1044) | 0.0128 (0.0098) | −0.0588 (0.0634) |
| Observations | 605,156 | 605,156 | 605,156 |
| Extended sample | |||
| Immigrant entrepreneurs | −0.0014 (0.0984) | −0.0537 (0.0479) | −0.2859 (0.3718) |
| Observations | 806,462 | 806,462 | 806,462 |
Heterogeneity in the Impact of Immigrant Entrepreneurs across Skill Levels of Natives: Second Stage Estimates for Low Skilled
| Outcome | Any self-employment | Incorporated self-employment | Unincorporated self-employment |
|---|---|---|---|
| Immigrant entrepreneurs | 0.03144 (0.05516) | −0.04661 (0.04708) | 0.18127 (0.13897) |
| Age | 0.00264*** (0.00004) | 0.00102*** (0.00002) | 0.00162*** (0.00004) |
| Female | −0.04654*** (0.00090) | −0.02342*** (0.00052) | −0.02307*** (0.00077) |
| High school | −0.00584*** (0.00178) | 0.00813*** (0.00083) | −0.01376*** (0.00163) |
| Some college | −0.00080 (0.00179) | 0.01370*** (0.00086) | −0.01419*** (0.00164) |
| White | 0.03208*** (0.00253) | 0.01239*** (0.00129) | 0.02021*** (0.00230) |
| Black | −0.02104*** (0.00272) | −0.01112*** (0.00137) | −0.00932*** (0.00250) |
| Hispanic | −0.01388*** (0.00270) | −0.00498*** (0.00136) | −0.00859*** (0.00242) |
| Number of children | 0.01184*** (0.00042) | 0.00497*** (0.00024) | 0.00690*** (0.00036) |
| Lives in a city | 0.02034*** (0.00132) | −0.00425*** (0.00070) | 0.02441*** (0.00119) |
| State population | −0.01453 (0.03602) | 0.00996 (0.00842) | −0.08193 (0.06607) |
| Observations | 406,090 | 406,090 | 406,090 |
First-stage Regressions: Association between Generous SCHIP and Supply of Immigrant Entrepreneurs
| Outcome | Any self-employment | Incorporated self-employment | Unincorporated self-employment |
|---|---|---|---|
| Average supply of immigrant entrepreneurs: | 144,200 | 41,800 | 102,400 |
| Generous SCHIP | 0.1160*** (0.0025) | 0.0493*** (0.0009) | 0.0668*** (0.0018) |
| Age | −0.00002 (0.00002) | 0.00000 (0.00001) | −0.00002 (0.00002) |
| Female | 0.00024 (0.00046) | 0.00011 (0.00022) | 0.00013 (0.00038) |
| High school | −0.00079 (0.00110) | 0.00056 (0.00053) | −0.00136 (0.00091) |
| Some college | −0.00158 (0.00111) | 0.00069 (0.00054) | −0.00227** (0.00092) |
| College degree | 0.00114 (0.00115) | 0.00131** (0.00056) | −0.00017 (0.00095) |
| Advanced degree | 0.00139 (0.00125) | 0.00140** (0.00061) | −0.00001 (0.00104) |
| White | −0.00704*** (0.00149) | −0.00147** (0.00064) | −0.00557*** (0.00122) |
| Black | −0.00916*** (0.00166) | −0.00249*** (0.00074) | −0.00667*** (0.00136) |
| Hispanic | −0.00353* (0.00182) | 0.00009 (0.00079) | −0.00362** (0.00150) |
| Number of children | −0.00030 (0.00021) | −0.00007 (0.00010) | −0.00023 (0.00017) |
| Lives in a city | 0.00456*** (0.00046) | 0.00206*** (0.00024) | 0.00250*** (0.00038) |
| State population | 0.66179*** (0.00115) | 0.17862*** (0.00049) | 0.48317*** (0.00097) |
| Observations | 609,365 | 609,365 | 609,365 |
Summary statistics: incorporated vs_ unincorporated
| Sample | Natives | Immigrants | ||
|---|---|---|---|---|
| Incorp. | Unincorp. | Incorp. | Unincorp. | |
| Age | 46.33 | 44.91 | 45.39 | 43.73 |
| Female | 0.278 | 0.402 | 0.285 | 0.358 |
| Less than high school | 0.0265 | 0.0633 | 0.0787 | 0.243 |
| High school | 0.229 | 0.301 | 0.247 | 0.303 |
| Some college | 0.274 | 0.301 | 0.179 | 0.175 |
| College degree | 0.290 | 0.210 | 0.285 | 0.182 |
| Advanced degree | 0.181 | 0.125 | 0.210 | 0.0978 |
| White | 0.902 | 0.854 | 0.374 | 0.253 |
| Black | 0.0402 | 0.0614 | 0.0560 | 0.0591 |
| Hispanic | 0.0358 | 0.0567 | 0.238 | 0.450 |
| Number of family members under 18 | 0.851 | 0.803 | 1.021 | 1.028 |
| Lives in a metropolitan city | 0.853 | 0.772 | 0.962 | 0.943 |
| Observations | 39,007 | 67,829 | 7,846 | 16,518 |
Impact of Supply of Immigrant Entrepreneurs on Entrepreneurial Propensities of Natives: Second Stage Estimates
| Outcome | Any self-employment | Incorporated self-employment | Unincorporated self-employment |
|---|---|---|---|
| Entrepreneurial propensity of natives: | 0.0950 | 0.0345 | 0.0606 |
| Immigrant entrepreneurs | 0.0109 (0.0470) | −0.0491 (0.0426) | 0.1268 (0.1161) |
| Age | 0.00311*** (0.00004) | 0.00134*** (0.00002) | 0.00178*** (0.00003) |
| Female | −0.04720*** (0.00075) | −0.03003*** (0.00046) | −0.01718*** (0.00062) |
| High school | −0.00528*** (0.00177) | 0.00888*** (0.00083) | −0.01397*** (0.00163) |
| Some college | −0.00005 (0.00178) | 0.01482*** (0.00085) | −0.01457*** (0.00164) |
| College degree | 0.00885*** (0.00186) | 0.02726*** (0.00096) | −0.01832*** (0.00166) |
| Advanced degree | 0.01802*** (0.00211) | 0.03320*** (0.00118) | −0.01510*** (0.00183) |
| White | 0.02627*** (0.00213) | 0.01184*** (0.00118) | 0.01499*** (0.00193) |
| Black | −0.02582*** (0.00230) | −0.01105*** (0.00126) | −0.01415*** (0.00210) |
| Hispanic | −0.01754*** (0.00229) | −0.00482*** (0.00126) | −0.01230*** (0.00203) |
| Number of children | 0.01279*** (0.00035) | 0.00661*** (0.00022) | 0.00620*** (0.00029) |
| Lives in a city | 0.01795*** (0.00117) | −0.00446*** (0.00065) | 0.02224*** (0.00103) |
| State population | −0.00482 (0.03122) | 0.01032 (0.00772) | −0.06039 (0.05612) |
| Observations | 609,365 | 609,365 | 609,365 |
Impact of immigrant entrepreneurs on entrepreneurial propensities of natives: TSLS Model
| Outcome | Any self-employment | Incorporated self-employment | Unincorporated self-employment |
|---|---|---|---|
| Entrepreneurial propensity of natives | 0.0950 | 0.0345 | 0.0606 |
| Immigrant entrepreneurs | 0.0109 (0.0470) | −0.0491 (0.0426) | 0.1268 (0.1161) |
| Observations | 609,365 | 609,365 | 609,365 |
Heterogeneity in the Impact of Immigrant Entrepreneurs across Races of Natives: First Stage Estimates for Whites
| Outcome | Any self-employment | Incorporated self-employment | Unincorporated self-employment |
|---|---|---|---|
| Generous SCHIP | 0.02622*** (0.00156) | 0.02212*** (0.00082) | 0.00410*** (0.00117) |
| Age | −0.00001 (0.00002) | −0.00000 (0.00001) | −0.00000 (0.00002) |
| Female | −0.00009 (0.00049) | 0.00002 (0.00024) | −0.00010 (0.00040) |
| High school | 0.00018 (0.00123) | 0.00033 (0.00063) | −0.00015 (0.00102) |
| Some college | −0.00002 (0.00124) | 0.00042 (0.00063) | −0.00044 (0.00104) |
| College degree | 0.00166 (0.00127) | 0.00066 (0.00065) | 0.00100 (0.00106) |
| Advanced degree | 0.00149 (0.00138) | 0.00086 (0.00070) | 0.00063 (0.00115) |
| Number of children | −0.00028 (0.00022) | −0.00014 (0.00011) | −0.00015 (0.00018) |
| Lives in a city | 0.00393*** (0.00049) | 0.00184*** (0.00025) | 0.00209***s (0.00040) |
| State population | 0.65092*** (0.00144) | 0.17584*** (0.00062) | 0.47509*** (0.00122) |
| Observations | 461,397 | 461,397 | 461,397 |
Heterogeneity in the Impact of Immigrant Entrepreneurs across Natives by Parents’ Origin: TSLS Estimates
| Outcome | Any self-employment | Incorporated self-employment | Unincorporated self-employment |
|---|---|---|---|
| At least one foreign born parent | |||
| Entrepreneurial propensity of natives: | 0.0935 | 0.0357 | 0.0578 |
| Immigrant entrepreneurs | −0.1659 (0.1109) | −0.1791 (0.1286) | −0.1510 (0.1945) |
| First stage F stat | 139.94 | 144.049 | 369.79 |
| Observations | 64,475 | 64,475 | 64,475 |
| No foreign born parents | |||
| Entrepreneurial propensity of natives: | 0.0997 | 0.0350 | 0.0647 |
| Immigrant entrepreneurs | 0.0369 (0.0514) | −0.0349 (0.0454) | 0.1834 (0.1321) |
| First stage F stat | 984.07 | 1622.47 | 194.04 |
| Observations | 544,890 | 544,890 | 544,890 |
Summary statistics
| Sample | All | Natives | Immigrants |
|---|---|---|---|
| Outcome variables | |||
| Self-employed | 0.0961 | 0.0950 | 0.101 |
| Incorporated self-employed | 0.0342 | 0.0345 | 0.0330 |
| Unincorporated self-employed | 0.0619 | 0.0606 | 0.0684 |
| Control variables | |||
| Age | 41.28 | 41.41 | 40.66 |
| Female | 0.471 | 0.481 | 0.422 |
| Less than high school | 0.0815 | 0.0494 | 0.239 |
| High school | 0.295 | 0.300 | 0.271 |
| Some college | 0.285 | 0.306 | 0.179 |
| College degree | 0.224 | 0.231 | 0.192 |
| Advanced degree | 0.114 | 0.113 | 0.119 |
| White | 0.677 | 0.776 | 0.197 |
| Black | 0.108 | 0.113 | 0.0838 |
| Other race | 0.214 | 0.111 | 0.719 |
| Hispanic | 0.147 | 0.0817 | 0.468 |
| Number of family members under 18 | 0.807 | 0.765 | 1.011 |
| Lives in a metropolitan | 0.852 | 0.832 | 0.947 |
| State population (millions) | 7.661 | 7.124 | 1.029 |
| Observations | 1,361,196 | 1,111,850 | 249,346 |
Heterogeneity in the impact of immigrant entrepreneurs across races of natives: TSLS estimates
| Outcome | Any self-employment | Incorporated self-employment | Unincorporated self-employment |
|---|---|---|---|
| Blacks | |||
| Entrepreneurial propensity of natives: | 0.0469 | 0.0126 | 0.0343 |
| Immigrant entrepreneurs | 0.0924* (0.0519) | 0.0217 (0.0843) | 0.1260* (0.0662) |
| First stage F stat | 442.68 | 157.00 | 369.79 |
| Observations | 64,163 | 64,163 | 64,163 |
| Whites | |||
| Entrepreneurial propensity of natives: | 0.1121 | 0.0414 | 0.0706 |
| Immigrant entrepreneurs | 0.0434 (0.1014) | −0.0432 (0.0729) | 0.5106 (0.5606) |
| First stage F stat | 280.89 | 731.16 | 12.25 |
| Observations | 461,397 | 461,397 | 461,397 |
Results with Separate Controls for Immigrant and Native Population
| Outcome | Any self-employment | Incorporated self-employment | Unincorporated self-employment |
|---|---|---|---|
| Immigrant entrepreneurs | 0.01247 (0.0258) | 0.5644 (0.3684) | −0.0130 (0.0225) |
| First stage F-stat | 7,012.38 | 72.25 | 8,873.64 |
| Observations | 609,365 | 609,365 | 609,365 |