
Table 1
Sample comparisons between 2003 CPS noncitizen respondents and NIS respondents
| Characteristics | CPS | NIS | |||
|---|---|---|---|---|---|
| Full samplea | Employedb | Full samplec | Our sample | Our sample | |
| w/o employment principal | |||||
| Age | 37.32 | 35.89 | 37.38 | 37.41 | 37.51 |
| (14.25) | (11.07) | (10.77) | (9.12) | (9.48) | |
| Male | 0.52 | 0.64 | 0.49 | 0.60 | 0.58 |
| (0.50) | (0.48) | (0.50) | (0.49) | (0.59) | |
| Education (in years) | 11.14 | 11.59 | 13.22 | 14.38 | 13.88 |
| (4.52) | (4.46) | (4.35) | (4.27) | (4.17) | |
| % Employed† | 0.63 | 1.0 | 0.62 | 1.0 | 1.0 |
| (0.48) | (0.49) | ||||
| Hourly wage | 2.23†† | 2.33 | 2.18 | ||
| (0.87) | (0.67) | (0.59) | |||
| Observations | 13078 | 7521 | 11601 | 2460 | 1976 |
[i] Note: Standard deviations are reported in parentheses.
aNoncitizens’ age 16+ years. bNoncitizens who report being employed and having a strictly positive annual income.
cNIS full sample includes immigrants between the ages of 16–65 years at the time of entry into the U.S. after accounting for available covariates.
†Civilian employment.
††Hourly wage is calculated from a respondent’s previous year’s annual salary, winsorized at 1%. The reported value is the natural log of the derived hourly wage.
Table 2
NIS interview questions and classification as stayer, switcher, and nonparticipant
| Occupation in first source country job | Occupation in last source country job | Occupation in first U.S. job | Classification | Type |
|---|---|---|---|---|
| X | X | X | Stayer | I |
| X | Y | Y | Stayer | II |
| X | Y | X | Switcher | I |
| X | X | Y | Switcher | II |
| X | Y | Z | Switcher | II |
| Not working | Nonparticipant |
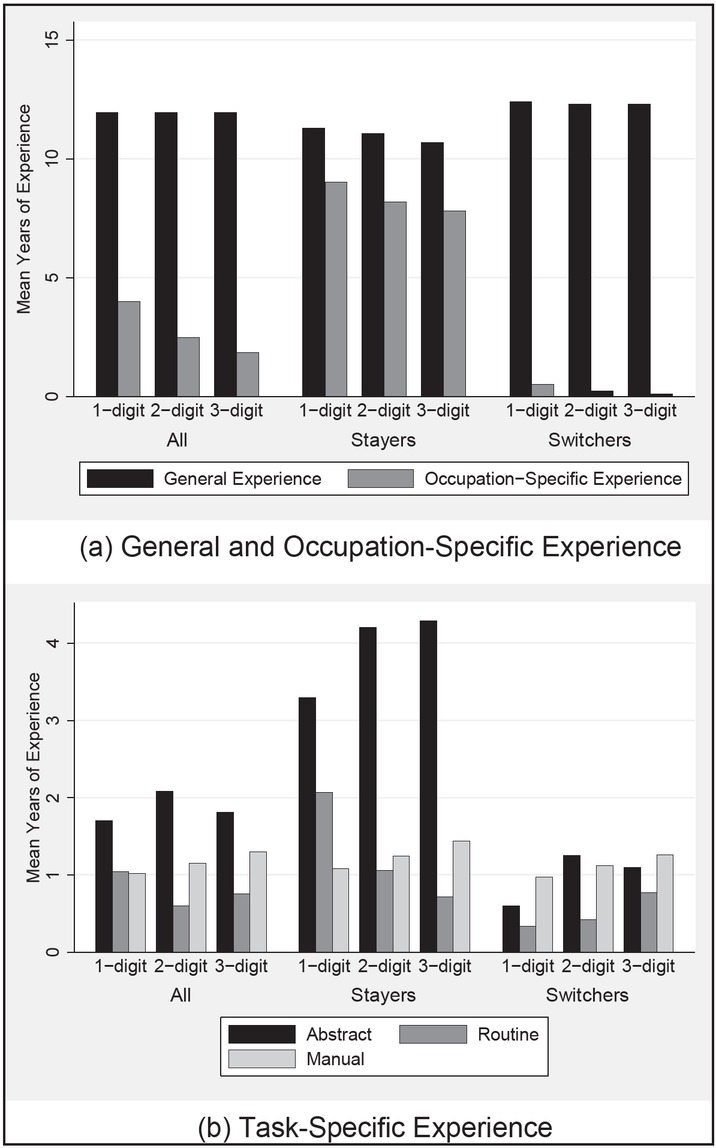
Figure 1
Average experience by sample and digit. Note: (a) General and occupation-specific experience. (b) Task-specific experience.
Table 3
Summary statistics
| Parameters | All workers | Stayers | Switchers | ||||
|---|---|---|---|---|---|---|---|
| 1-Digit | 2-Digit | 3-Digit | 1-Digit | 2-Digit | 3-Digit | ||
| Hourly wage | 13.589 | 18.087 | 19.674 | 21.34 | 10.477 | 11.197 | 11.35 |
| (15.882) | (19.697) | (19.717) | (20.23) | (11.610) | (13.359) | (13.59) | |
| Education | 13.820 | 14.375 | 14.725 | 14.898 | 13.437 | 13.465 | 13.509 |
| (4.000) | (3.969) | (3.751) | (3.817) | (3.975) | (4.038) | (3.997) | |
| English (very good) | 0.411 | 0.533 | 0.597 | 0.613 | 0.327 | 0.338 | 0.352 |
| (0.492) | (0.499) | (0.491) | (0.487) | (0.469) | (0.473) | (0.478) | |
| English (good) | 0.140 | 0.132 | 0.120 | 0.118 | 0.145 | 0.148 | 0.146 |
| (0.347) | (0.339) | (0.325) | (0.323) | (0.352) | (0.355) | (0.353) | |
| English (average) | 0.057 | 0.036 | 0.029 | 0.031 | 0.072 | 0.069 | 0.065 |
| (0.232) | (0.186) | (0.167) | (0.173) | (0.259) | (0.253) | (0.247) | |
| English (poor) | 0.031 | 0.029 | 0.024 | 0.022 | 0.033 | 0.034 | 0.034 |
| (0.174) | (0.167) | (0.155) | (0.146) | (0.179) | (0.181) | (0.181) | |
| English (very poor) | 0.361 | 0.270 | 0.231 | 0.216 | 0.423 | 0.412 | 0.402 |
| (0.480) | (0.444) | (0.421) | (0.412) | (0.494) | (0.492) | (0.490) | |
| Female | 0.402 | 0.377 | 0.395 | 0.376 | 0.420 | 0.405 | 0.410 |
| (0.490) | (0.485) | (0.489) | (0.485) | (0.494) | (0.491) | (0.492) | |
| Employment principal | 0.197 | 0.305 | 0.373 | 0.437 | 0.122 | 0.127 | 0.127 |
| (0.398) | (0.461) | (0.484) | (0.497) | (0.327) | (0.333) | (0.333) | |
| Spouse of US citizen | 0.113 | 0.098 | 0.089 | 0.078 | 0.124 | 0.123 | 0.124 |
| (0.317) | (0.298) | (0.285) | (0.268) | (0.329) | (0.328) | (0.329) | |
| Diversity principal | 0.122 | 0.083 | 0.053 | 0.051 | 0.150 | 0.149 | 0.143 |
| (0.328) | (0.275) | (0.225) | (0.220) | (0.357) | (0.357) | (0.350) | |
| Spouse of principal immigrant | 0.308 | 0.304 | 0.301 | 0.279 | 0.310 | 0.310 | 0.316 |
| (0.462) | (0.460) | (0.459) | (0.449) | (0.463) | (0.463) | (0.465) | |
| Region of residence (east) | 0.369 | 0.387 | 0.379 | 0.377 | 0.356 | 0.365 | 0.366 |
| (0.483) | (0.487) | (0.485) | (0.485) | (0.479) | (0.481) | (0.482) | |
| Region of residence (west) | 0.275 | 0.271 | 0.261 | 0.260 | 0.278 | 0.281 | 0.280 |
| (0.447) | (0.445) | (0.439) | (0.439) | (0.448) | (0.450) | (0.449) | |
| Region of residence (south) | 0.184 | 0.183 | 0.192 | 0.176 | 0.185 | 0.181 | 0.186 |
| (0.388) | (0.387) | (0.394) | (0.381) | (0.388) | (0.385) | (0.390) | |
| Years between last source job and US job | 1.924 | 1.744 | 1.643 | 1.421 | 2.049 | 2.035 | 2.069 |
| (3.709) | (3.633) | (3.693) | (3.130) | (3.758) | (3.711) | (3.849) | |
| Workers | 2,460 | 1,006 | 694 | 551 | 1,454 | 1,766 | 1,909 |
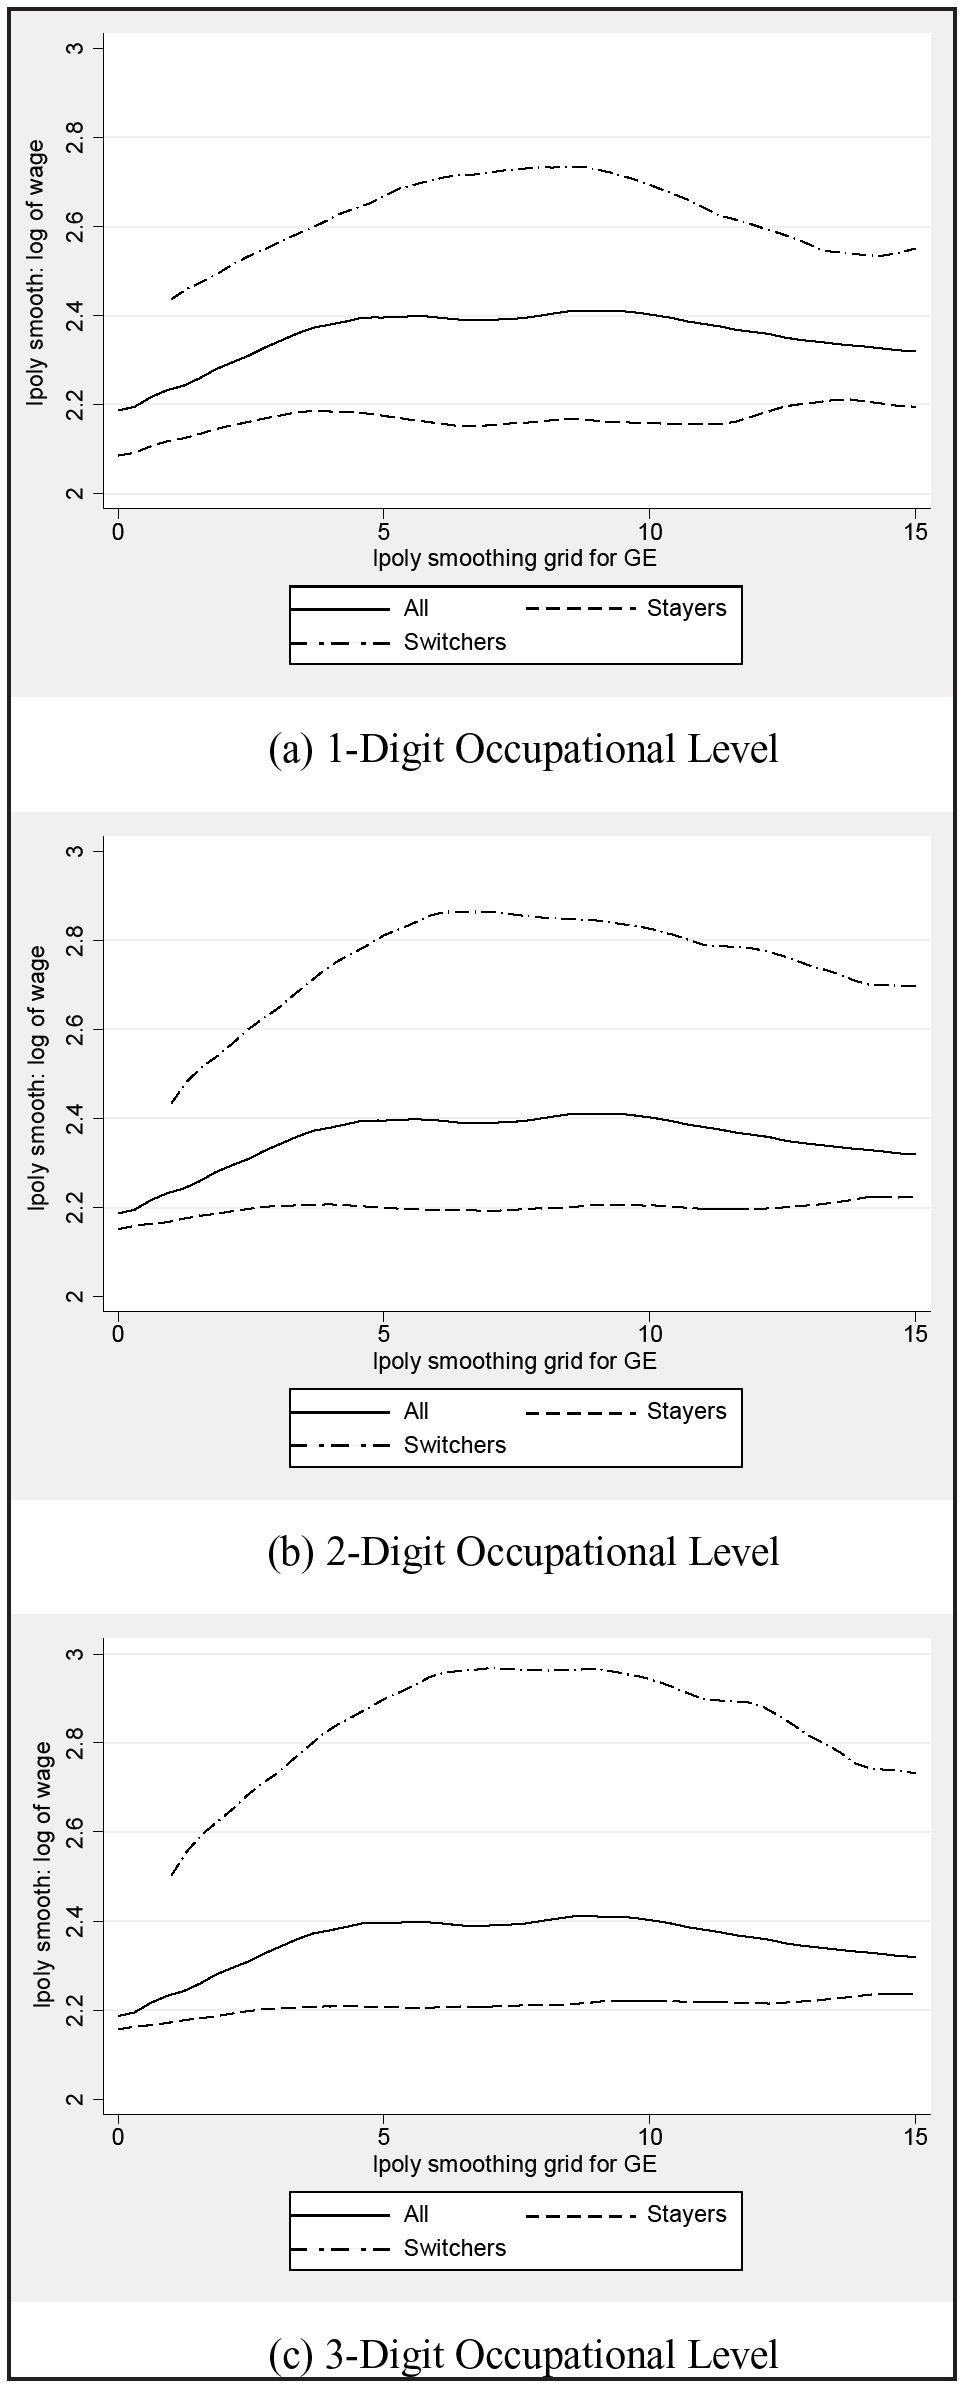
Figure 2
Kernel-weighted local polynomial – returns to general experience.
Notes: (a) One-digit occupational level. (b) Two-digit occupational level. (c) Three-digit occupational level.
Table 4
OLS: returns to source country general experience (quartic)
| Parameters | All | Stayers | Switchers | ||||
|---|---|---|---|---|---|---|---|
| 1-Digit | 2-Digit | 3-Digit | 1-Digit | 2-Digit | 3-Digit | ||
| GE | 0.0441*** (0.0165) | 0.0671** (0.0308) | 0.0968** (0.0394) | 0.1091** (0.0461) | 0.0220 (0.0183) | 0.0182 (0.0177) | 0.0191 (0.0170) |
| Square | −3.1734** (1.5939) | −5.3253* (3.0278) | −7.8664** (3.9854) | −8.4873* (4.6013) | −1.1747 (1.7558) | −0.8613 (1.7095) | −1.0127 (1.6480) |
| Cubic | 0.0798 (0.0572) | 0.1577 (0.1100) | 0.2429 (0.1493) | 0.2601 (0.1714) | 0.0149 (0.0627) | 0.0053 (0.0608) | 0.0117 (0.0590) |
| Quartic | −0.0007 (0.0007) | −0.0016 (0.0013) | −0.0026 (0.0018) | −0.0029 (0.0021) | 0.0000 (0.0007) | 0.0001 (0.0007) | 0.0001 (0.0007) |
| Female | −0.1146*** (0.0234) | −0.1306*** (0.0421) | −0.1394*** (0.0505) | −0.1811*** (0.0589) | −0.0833*** (0.0270) | −0.1000*** (0.0255) | −0.0954*** (0.0246) |
| Education | 0.0343*** (0.0035) | 0.0425*** (0.0066) | 0.0395*** (0.0089) | 0.0421*** (0.0111) | 0.0282*** (0.0040) | 0.0313*** (0.0037) | 0.0312*** (0.0036) |
| English: very good | 0.1901*** (0.0370) | 0.2190*** (0.0653) | 0.3175*** (0.0858) | 0.3378*** (0.1110) | 0.1424*** (0.0424) | 0.1196*** (0.0399) | 0.1397*** (0.0382) |
| English: good | 0.0464 (0.0382) | 0.1140* (0.0631) | 0.2325*** (0.0854) | 0.3001*** (0.1075) | 0.0098 (0.0478) | 0.0101 (0.0432) | 0.0127 (0.0409) |
| English: average | 0.0030 (0.0431) | 0.1244 (0.1023) | 0.1690 (0.1462) | 0.1922 (0.1663) | 0.0323 (0.0450) | 0.0036 (0.0445) | 0.0074 (0.0434) |
| English: poor | −0.0051 (0.0468) | −0.0613 (0.0953) | 0.0757 (0.1242) | −0.0095 (0.1597) | 0.0339 (0.0494) | −0.0210 (0.0480) | −0.0014 (0.0450) |
| Constant | 1.8596*** (0.1590) | 1.5168*** (0.2438) | 1.5945*** (0.2741) | 1.4258*** (0.2974) | 2.2338*** (0.2412) | 1.9325*** (0.2461) | 1.9323*** (0.2362) |
| Other controls | |||||||
| Work gap | X | X | X | X | X | X | X |
| Visa type | X | X | X | X | X | X | X |
| Region | X | X | X | X | X | X | X |
| Entry year | X | X | X | X | X | X | X |
| Source FE | X | X | X | X | X | X | X |
| N | 2,459 | 1,006 | 694 | 551 | 1,453 | 1,765 | 1,908 |
| R2 | 0.41 | 0.47 | 0.48 | 0.48 | 0.30 | 0.32 | 0.32 |
[i] Note: Robust standard errors are reported in parentheses.
*0.10, **0.05, and ***0.01 denote significance levels.
Control “Work gap” denotes the time between immigration and employment in first U.S. job.
Visa types: employment based, spouse of an U.S. citizen, diversity, refugee or asylee, spouse of principal immigrant, and other (family based).
Table 5
OLS estimates of cumulative returns to source country general experience (quartic)
| Parameters | All | Stayers | Switchers | ||||
|---|---|---|---|---|---|---|---|
| 1-Digit | 2-Digit | 3-Digit | 1-Digit | 2-Digit | 3-Digit | ||
| 3 Years of GE | 0.1059*** (0.0371) | 0.1574** (0.0688) | 0.2260*** (0.0874) | 0.2576** (0.1026) | 0.0557 (0.0412) | 0.0471 (0.0399) | 0.0486 (0.0383) |
| 5 Years of GE | 0.1508*** (0.0506) | 0.2208** (0.0933) | 0.3161*** (0.1180) | 0.3638*** (0.1391) | 0.0823 (0.0564) | 0.0704 (0.0544) | 0.0718 (0.0523) |
| 10 Years of GE | 0.1969*** (0.0606) | 0.2792** (0.1100) | 0.3980*** (0.1378) | 0.4734*** (0.1639) | 0.1175* (0.0683) | 0.1029 (0.0651) | 0.1021 (0.0627) |
| N | 2,459 | 1,006 | 694 | 551 | 1,453 | 1,765 | 1,908 |
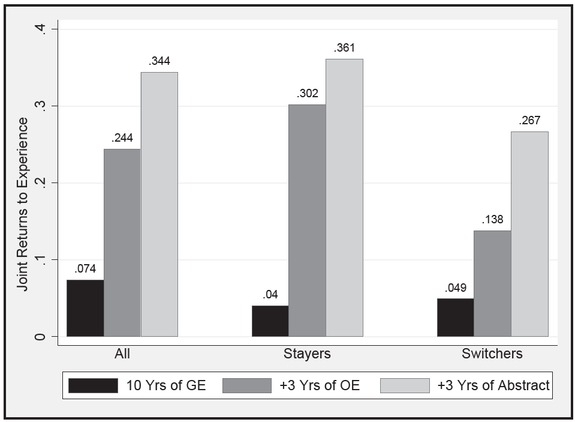
Figure 3
Joint returns to experience – two-digit level. Returns to 10 years of GE and 0 years of OE and TE are not statistically significant at any of the conventional levels for the samples of “All immigrants”, “Stayers”, and “Switchers”. Returns to 10 years of GE, 3 years of OE, and no TE are significant at the 1% and 10% levels for the “All immigrants” and “Stayer” samples, respectively. Returns to 10 years of GE, 3 years of OE, and no TE are not significant at any of the conventional levels for the Switcher sample. Return to 10 years of GE, 3 years of OE, and 3 years of Abstract TE is significant at the 1%, 5%, and 1% levels for the “All immigrants”, “Stayers”, and “Switcher” samples, respectively.
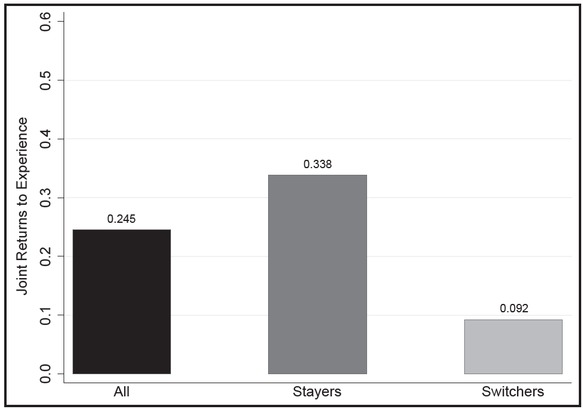
Figure 4
Returns to source country experience for the average immigrant – two-digit level. Returns for “All workers” are significant at the 1% level, returns for “Stayers” are significant at the 10% level, and returns for the Switchers sample are not significant at any of the conventional levels.
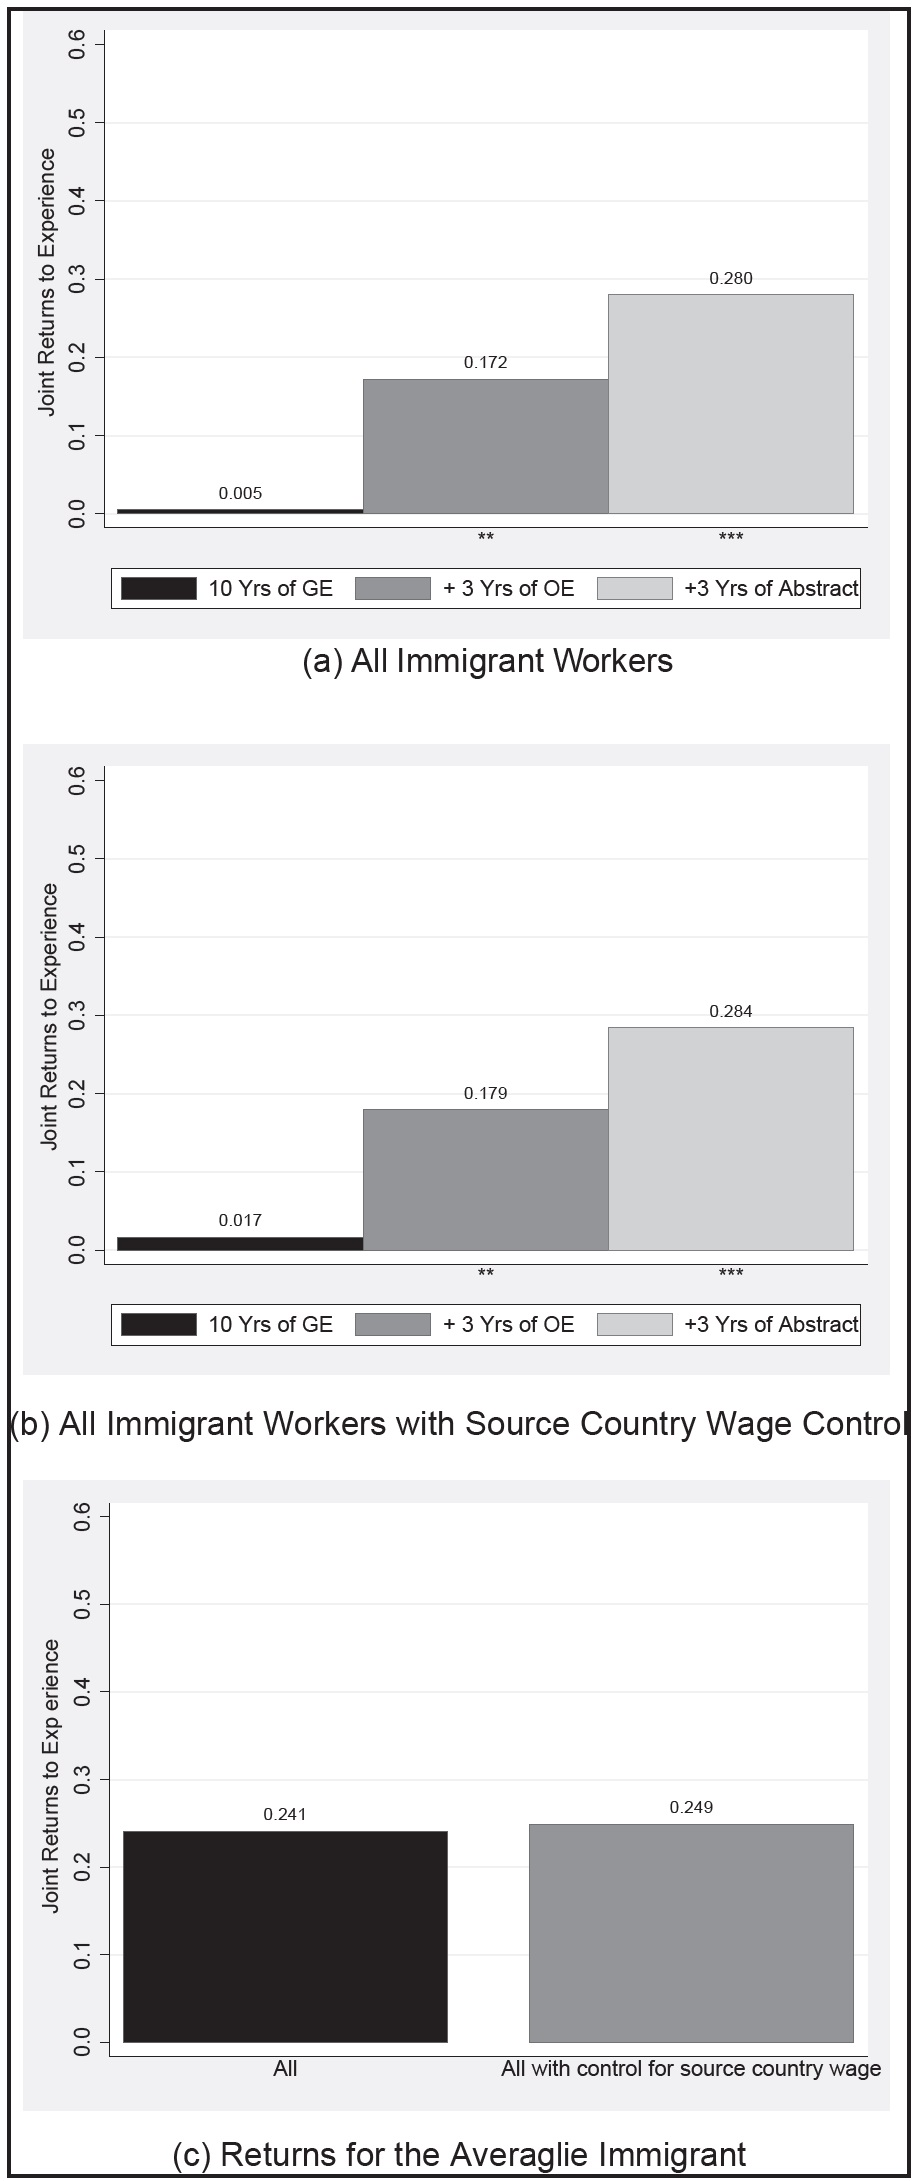
Figure 5
Returns to experience: source country wage sample – two-digit level.
Note: (a) All immigrant workers. (b) All immigrant workers with source country wage control. (c) Returns for the average immigrant.
Note: *0.1, ** 0.05, and ** 0.01 denote significance levels under each bar in panels (a) and (b). In panel (c), estimates are significant at the 0.01 level.
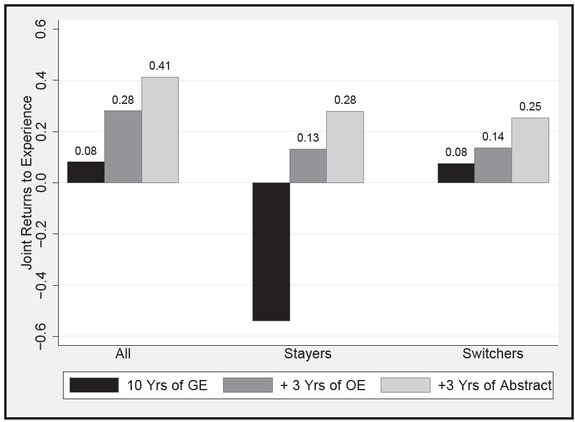
Figure 6
Joint returns to experience, excluding employment principals – two-digit level. Return to 10 years of GE and 0 years of OE and TE are not statistically significant at any of the conventional levels for the “All immigrants” and “Switchers” samples. Return to 10 years of GE and 0 years of OE and TE is significant at the 5% level for the “Stayers” sample. Returns to 10 years of GE, 3 years of OE, and no TE are significant at the 1% level for “All immigrants”. Return to 10 years of GE, 3 years of OE, and 0 years of TE is not significant at any of the conventional levels for the “Stayers” and “Switchers” samples. Return to 10 years of GE, 3 years of OE, and 3 years of Abstract TE is significant at the 1% level for the “All immigrants” and “Switchers” samples. Returns to 10 years of GE, 3 years of OE, and 3 years of Abstract TE are not significant at any of the conventional significance levels for the “Stayers” sample.
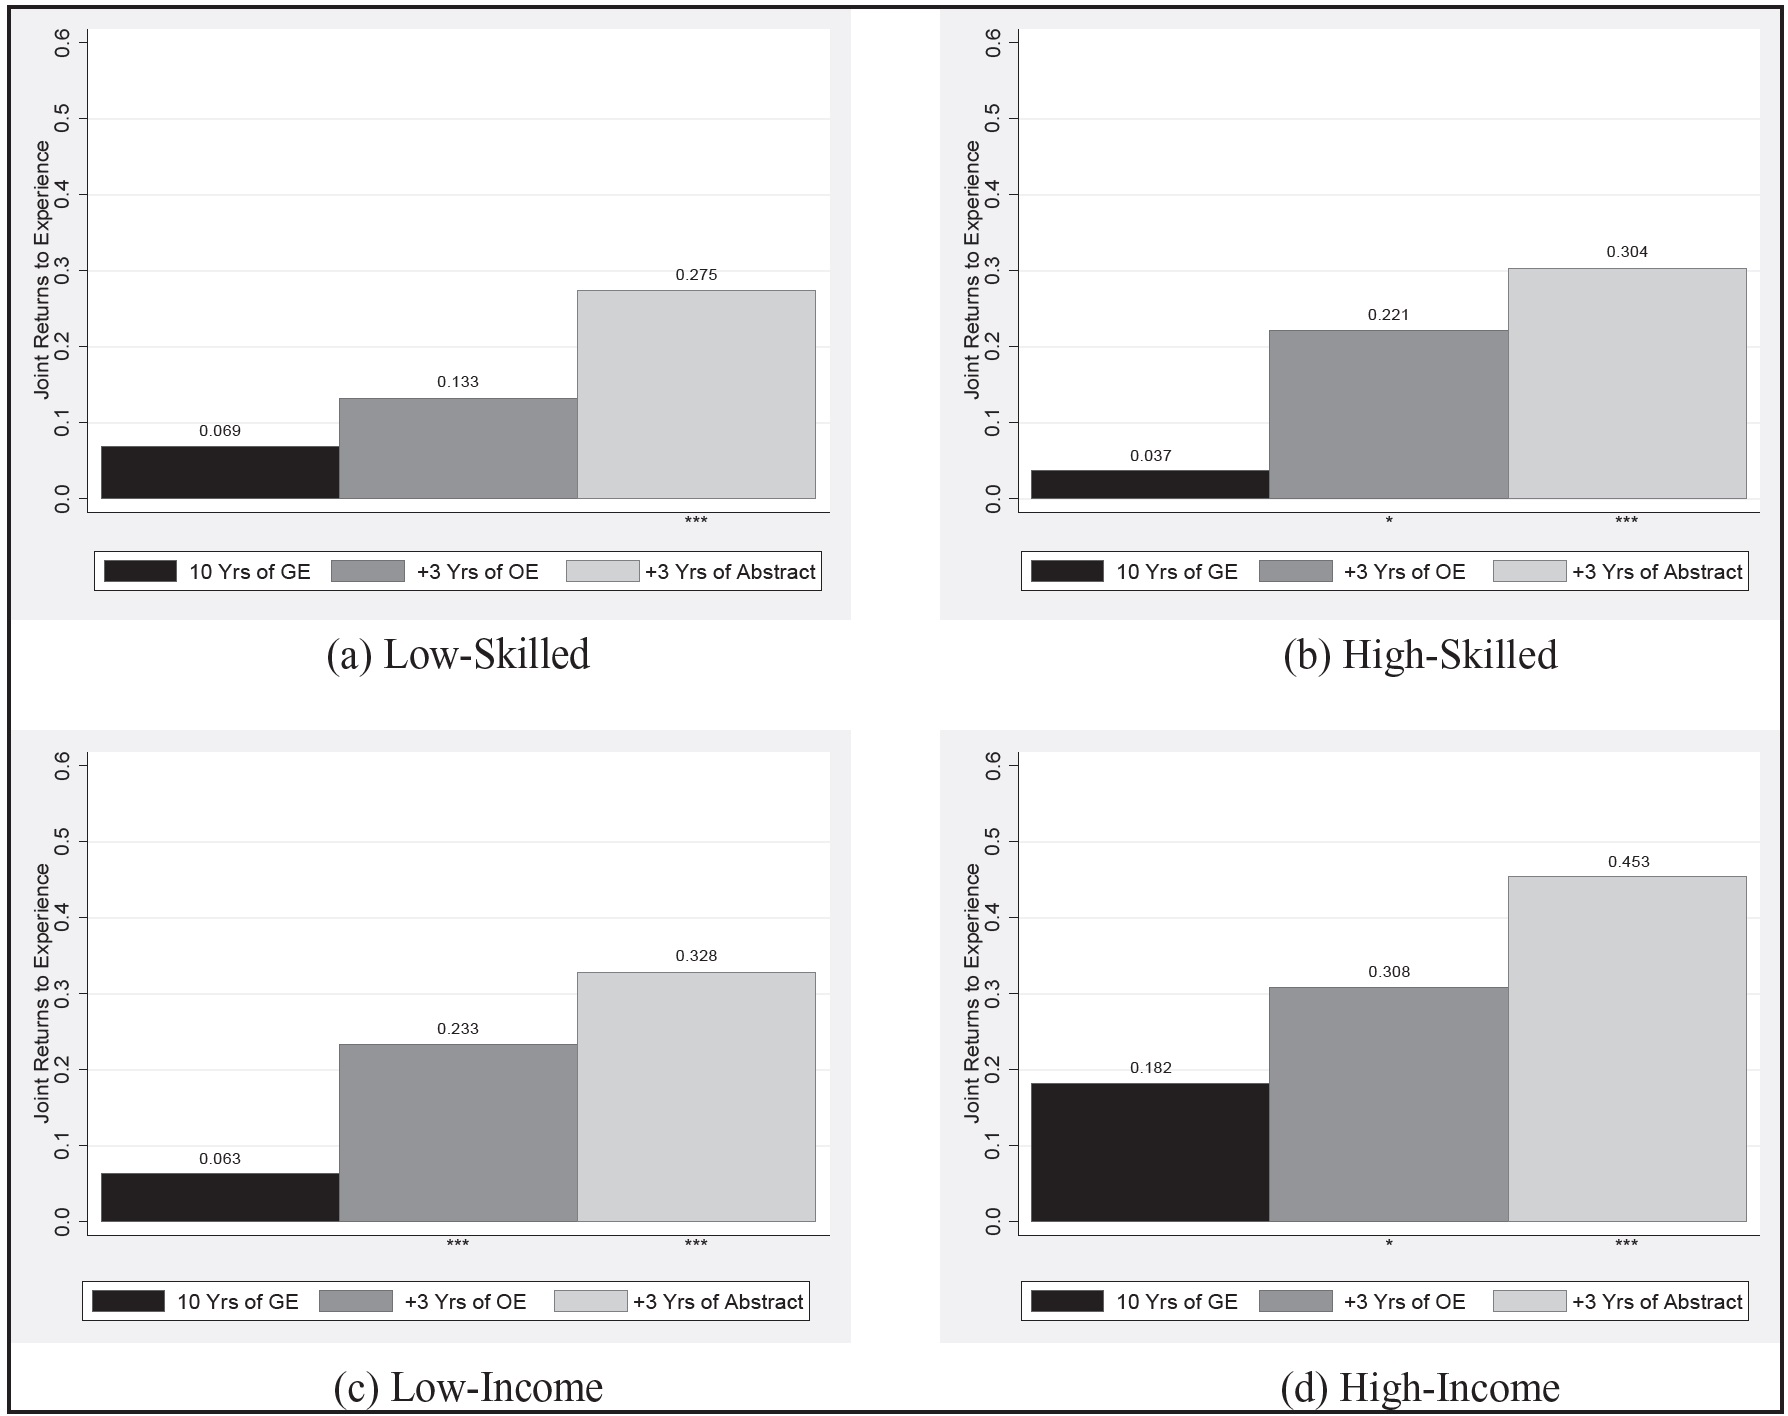
Figure 7
Heterogeneity in returns to experience – two-digit level.
Notes: (a) Low-skilled; (b) high-skilled; (c) low income; and (d) high income.
Notes: *0.1, ** 0.05, and ** 0.01 denote the significance level. Returns shown are for all workers in each subsample.
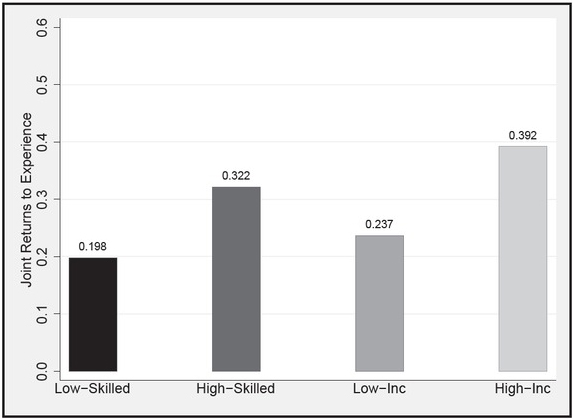
Figure 8
Average returns to experience – worker heterogeneity (two-digit level).
Notes: All returns are significant at the 1% level.
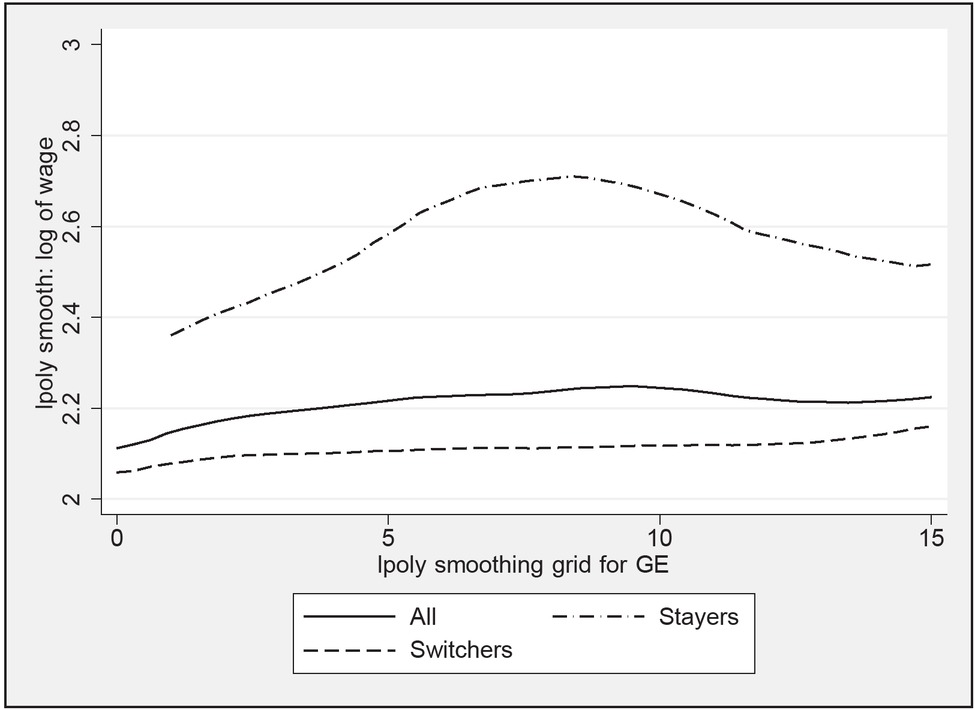
Figure S1
Kernel-weighted local polynomial – returns to general experience, employment principals excluded.
Table S1
OLS estimates of cumulative returns to source country GE, OE, and TE (quartic)
| Parameters | All immigrant workers | Stayers | Switchers | ||||||
|---|---|---|---|---|---|---|---|---|---|
| 1-Digit | 2-Digit | 3-Digit | 1-Digit | 2-Digit | 3-Digit | 1-Digit | 2-Digit | 3-Digit | |
| 3 Years of GE | 0.0291 | 0.0478 | 0.0421 | 0.0658 | 0.0507 | 0.1632 | 0.0449 | 0.0254 | 0.0114 |
| (0.0368) | (0.0373) | (0.0368) | (0.1165) | (0.1336) | (0.1556) | (0.0429) | (0.0401) | (0.0386) | |
| 5 Years of GE | 0.0402 | 0.0654 | 0.0593 | 0.0838 | 0.0617 | 0.2297 | 0.0645 | 0.0367 | 0.0185 |
| (0.0502) | (0.0510) | (0.0504) | (0.1573) | (0.1806) | (0.2080) | (0.0588) | (0.0548) | (0.0528) | |
| 10 Years of GE | 0.0470 | 0.0744 | 0.0718 | 0.0707 | 0.0395 | 0.3011 | 0.0866 | 0.0490 | 0.0283 |
| (0.0606) | (0.0621) | (0.0614) | (0.1845) | (0.2148) | (0.2457) | (0.0715) | (0.0667) | (0.0641) | |
| 3 Years of OE | 0.1526*** | 0.1699*** | 0.2024*** | 0.1043 | 0.2623** | 0.1176 | 0.1109 | 0.0891 | 0.1184* |
| (0.0250) | (0.0306) | (0.0337) | (0.1199) | (0.1255) | (0.1449) | (0.0754) | (0.0577) | (0.0660) | |
| 5 Years of OE | 0.2033*** | 0.2251*** | 0.2719*** | 0.1387 | 0.3516** | 0.1596 | 0.0642 | 0.1056 | 0.2672** |
| (0.0316) | (0.0374) | (0.0413) | (0.1575) | (0.1640) | (0.1868) | (0.0899) | (0.0752) | (0.1224) | |
| 10 Years of OE | 0.2262*** | 0.2381*** | 0.3059*** | 0.1582 | 0.3941** | 0.1910 | -0.0871 | 0.0513 | 0.1871 |
| (0.0390) | (0.0414) | (0.0458) | (0.1704) | (0.1758) | (0.1933) | (0.1314) | (0.1341) | (0.1827) | |
| 3 Years of Abstract | 0.1239*** | 0.0997*** | 0.1066*** | 0.0911*** | 0.0588* | 0.0443 | 0.1272*** | 0.1292*** | 0.1541*** |
| (0.0196) | (0.0186) | (0.0186) | (0.0267) | (0.0304) | (0.0384) | (0.0428) | (0.0295) | (0.0300) | |
| 5 Years of Abstract | 0.2017*** | 0.1623*** | 0.1738*** | 0.1376*** | 0.0846* | 0.0609 | 0.2065*** | 0.2086*** | 0.2473*** |
| (0.0311) | (0.0295) | (0.0295) | (0.0450) | (0.0500) | (0.0628) | (0.0658) | (0.0466) | (0.0470) | |
| 10 Years of Abstract | 0.3614*** | 0.2898*** | 0.3104*** | 0.1911** | 0.0944 | 0.0508 | 0.3653*** | 0.3588*** | 0.4141*** |
| (0.0505) | (0.0478) | (0.0484) | (0.0955) | (0.1067) | (0.1334) | (0.0929) | (0.0736) | (0.0715) | |
| 3 Years of Routine | -0.0317 | -0.0380 | -0.0204 | -0.0223 | 0.0281 | 0.0011 | -0.0452 | -0.0384 | -0.0079 |
| (0.0252) | (0.0292) | (0.0216) | (0.0294) | (0.0593) | (0.0864) | (0.0725) | (0.0399) | (0.0247) | |
| 5 Years of Routine | -0.0542 | -0.0593 | -0.0314 | -0.0287 | 0.0629 | 0.0047 | -0.0247 | -0.0574 | -0.0116 |
| (0.0400) | (0.0460) | (0.0347) | (0.0465) | (0.0934) | (0.1362) | (0.1029) | (0.0624) | (0.0395) | |
| 10 Years of Routine | -0.1124* | -0.0866 | -0.0445 | -0.0124 | 0.2059 | 0.0217 | 0.2636 | -0.0636 | -0.0121 |
| (0.0638) | (0.0715) | (0.0579) | (0.0799) | (0.1498) | (0.2213) | (0.2620) | (0.0927) | (0.0655) | |
| 3 Years of Manual | -0.0273 | -0.0128 | -0.0295* | -0.0262 | -0.0157 | -0.0371 | -0.0281 | -0.0040 | -0.0209 |
| (0.0194) | (0.0185) | (0.0175) | (0.0336) | (0.0468) | (0.0553) | (0.0357) | (0.0210) | (0.0184) | |
| 5 Years of Manual | -0.0437 | -0.0225 | -0.0490* | -0.0389 | -0.0319 | -0.0583 | -0.0411 | -0.0084 | -0.0355 |
| (0.0313) | (0.0296) | (0.0280) | (0.0563) | (0.0765) | (0.0929) | (0.0552) | (0.0337) | (0.0296) | |
| 10 Years of Manual | -0.0744 | -0.0522 | -0.0935** | -0.0458 | -0.0963 | -0.0953 | -0.0426 | -0.0269 | -0.0727 |
| (0.0533) | (0.0495) | (0.0465) | (0.1135) | (0.1459) | (0.1949) | (0.0797) | (0.0570) | (0.0503) | |
| N | 2,459 | 2,459 | 2,459 | 1,006 | 694 | 551 | 1,453 | 1,765 | 1,908 |
Table S2
OLS estimates of cumulative returns to source country GE, OE, and TE (quartic)
| Parameters | All immigrant workers | Stayers | Switchers | ||||||
|---|---|---|---|---|---|---|---|---|---|
| 1-Digit | 2-Digit | 3-Digit | 1-Digit | 2-Digit | 3-Digit | 1-Digit | 2-Digit | 3-Digit | |
| 3 Years of GE | 0.0398 | 0.0448 | 0.0443 | 0.1139 | -0.0043 | 0.1525 | 0.0575 | 0.0319 | 0.0245 |
| (0.0365) | (0.0375) | (0.0373) | (0.1192) | (0.1380) | (0.1543) | (0.0424) | (0.0404) | (0.0394) | |
| 5 Years of GE | 0.0568 | 0.0654 | 0.0650 | 0.1471 | 0.0042 | 0.2298 | 0.0841 | 0.0485 | 0.0386 |
| (0.0498) | (0.0514) | (0.0510) | (0.1605) | (0.1849) | (0.2069) | (0.0582) | (0.0554) | (0.0539) | |
| 10 Years of GE | 0.0763 | 0.0901 | 0.0885 | 0.1346 | 0.0432 | 0.3502 | 0.1216* | 0.0728 | 0.0590 |
| (0.0604) | (0.0628) | (0.0620) | (0.1866) | (0.2133) | (0.2405) | (0.0718) | (0.0678) | (0.0653) | |
| 3 Years of OE | 0.1492*** | 0.1678*** | 0.1872*** | 0.0394 | 0.2944** | 0.1157 | 0.5501*** | 0.0519 | 0.0719 |
| (0.0261) | (0.0319) | (0.0349) | (0.1216) | (0.1288) | (0.1437) | (0.1616) | (0.0675) | (0.0789) | |
| 5 Years of OE | 0.1981*** | 0.2232*** | 0.2539*** | 0.0558 | 0.3836** | 0.1505 | 1.4284** | 0.0544 | 0.1610 |
| (0.0335) | (0.0392) | (0.0431) | (0.1598) | (0.1675) | (0.1852) | (0.5558) | (0.0844) | (0.1443) | |
| 10 Years of OE | 0.2163*** | 0.2388*** | 0.2897*** | 0.0787 | 0.3852** | 0.1610 | 7.5671** | 0.0246 | 0.1821 |
| (0.0419) | (0.0427) | (0.0479) | (0.1729) | (0.1768) | (0.1905) | (3.7792) | (0.1355) | (0.2131) | |
| 3 years of NRCA | 0.1725*** | 0.1693*** | 0.1305*** | 0.1306*** | 0.0892* | 0.0376 | 0.5014*** | 0.5412*** | 0.2400*** |
| (0.0301) | (0.0355) | (0.0239) | (0.0346) | (0.0456) | (0.0406) | (0.1671) | (0.1274) | (0.0690) | |
| 5 years of NRCA | 0.2708*** | 0.2690*** | 0.2103*** | 0.2026*** | 0.1195 | 0.0438 | 0.1480 | 0.7628*** | 0.3798*** |
| (0.0476) | (0.0552) | (0.0379) | (0.0593) | (0.0734) | (0.0726) | (0.2060) | (0.1839) | (0.1065) | |
| 10 years of NRCA | 0.4272*** | 0.4366*** | 0.3582*** | 0.3089** | 0.0711 | -0.0093 | -5.8783** | 0.5968** | 0.5885*** |
| (0.0775) | (0.0832) | (0.0628) | (0.1448) | (0.1445) | (0.1874) | (2.8815) | (0.2753) | (0.1538) | |
| 3 years of NRCI | 0.0708** | -0.0106 | -0.0377 | 0.0697** | -0.0733 | -0.1589** | -0.1333 | 0.0309 | -0.0246 |
| (0.0291) | (0.0333) | (0.0365) | (0.0341) | (0.0628) | (0.0731) | (0.1665) | (0.0381) | (0.0500) | |
| 5 years of NRCI | 0.1144** | -0.0153 | -0.0583 | 0.0991* | -0.1207 | -0.2650** | -0.7963** | 0.0468 | -0.0372 |
| (0.0457) | (0.0520) | (0.0581) | (0.0552) | (0.1011) | (0.1216) | (0.3748) | (0.0592) | (0.0799) | |
| 10 years of NRCI | 0.1985*** | -0.0089 | -0.0843 | 0.0952 | -0.2041 | -0.4890* | -6.1920** | 0.0625 | -0.0477 |
| (0.0719) | (0.0782) | (0.0946) | (0.1031) | (0.1819) | (0.2511) | (3.0430) | (0.0870) | (0.1333) | |
| 3 years of RCOG | -0.0404 | 0.0558* | 0.0049 | -0.0343 | 0.0524 | 0.0123 | -0.2918*** | 0.0767 | 0.0228 |
| (0.0263) | (0.0290) | (0.0287) | (0.0297) | (0.0466) | (0.0997) | (0.1039) | (0.0560) | (0.0339) | |
| 5 years of RCOG | -0.0693* | 0.0866* | 0.0075 | -0.0513 | 0.0888 | 0.0204 | -0.8822*** | 0.1237 | 0.0365 |
| (0.0415) | (0.0456) | (0.0458) | (0.0467) | (0.0769) | (0.1564) | (0.3146) | (0.0850) | (0.0538) | |
| 10 years of RCOG | -0.1430** | 0.1274* | 0.0100 | -0.0671 | 0.1708 | 0.0265 | -5.5867** | 0.2133* | 0.0589 |
| (0.0656) | (0.0714) | (0.0745) | (0.0789) | (0.1539) | (0.2615) | (2.7181) | (0.1112) | (0.0869) | |
| 3 years of RMAN | -0.0713** | -0.1062*** | -0.1233*** | -0.0249 | -0.1196 | -0.1748 | -0.3068*** | -0.0993** | -0.1217** |
| (0.0361) | (0.0361) | (0.0476) | (0.0537) | (0.0770) | (0.1368) | (0.0990) | (0.0491) | (0.0522) | |
| 5 years of RMAN | -0.1086* | -0.1617*** | -0.1869** | -0.0212 | -0.1583 | -0.2506 | -0.9394*** | -0.1500** | -0.1830** |
| (0.0572) | (0.0563) | (0.0734) | (0.0876) | (0.1234) | (0.2118) | (0.3196) | (0.0746) | (0.0793) | |
| 10 years of RMAN | -0.1418 | -0.2143** | -0.2329** | 0.0829 | -0.0590 | -0.2258 | -5.8974** | -0.1916* | -0.2180* |
| (0.0913) | (0.0850) | (0.1069) | (0.1618) | (0.2164) | (0.3226) | (2.8076) | (0.1000) | (0.1151) | |
| 3 years of NRMN | -0.0646** | -0.0167 | -0.0482** | -0.0598 | 0.0143 | -0.0204 | -0.2996*** | -0.0085 | -0.0368 |
| (0.0327) | (0.0220) | (0.0219) | (0.0469) | (0.0513) | (0.0656) | (0.1016) | (0.0260) | (0.0251) | |
| 5 years of NRMN | -0.0978* | -0.0273 | -0.0771** | -0.0921 | 0.0182 | -0.0315 | -0.9177*** | -0.0142 | -0.0594 |
| (0.0528) | (0.0352) | (0.0349) | (0.0803) | (0.0814) | (0.1089) | (0.3269) | (0.0417) | (0.0397) | |
| 10 years of NRMN | -0.1335 | -0.0532 | -0.1314** | -0.1293 | -0.0043 | -0.0566 | -5.7884** | -0.0302 | -0.1055* |
| (0.0915) | (0.0588) | (0.0577) | (0.1834) | (0.1390) | (0.2267) | (2.8214) | (0.0703) | (0.0637) | |
| N | 2,459 | 2,459 | 2,459 | 1,006 | 694 | 551 | 1,453 | 1,765 | 1,908 |
Table S3
OLS estimates of cumulative returns to source country GE, OE, and TE (quartic) - with source country wage
| Parameters | All immigrant workers | Stayers | Switchers | ||||||
|---|---|---|---|---|---|---|---|---|---|
| 1-Digit | 2-Digit | 3-Digit | 1-Digit | 2-Digit | 3-Digit | 1-Digit | 2-Digit | 3-Digit | |
| 3 Years of GE | -0.0195 | -0.0124 | -0.0195 | 0.1548 | 0.0692 | 0.4922* | 0.0610 | 0.0105 | 0.0030 |
| (0.0466) | (0.0472) | (0.0475) | (0.1875) | (0.2111) | (0.2893) | (0.0570) | (0.0512) | (0.0490) | |
| 5 Years of GE | -0.0150 | -0.0079 | -0.0147 | 0.2055 | 0.1009 | 0.6256* | 0.0930 | 0.0215 | 0.0145 |
| (0.0624) | (0.0635) | (0.0637) | (0.2465) | (0.2692) | (0.3569) | (0.0768) | (0.0692) | (0.0661) | |
| 10 Years of GE | 0.0223 | 0.0218 | 0.0201 | 0.2150 | 0.1635 | 0.6601* | 0.1506* | 0.0488 | 0.0483 |
| (0.0725) | (0.0740) | (0.0739) | (0.2667) | (0.2736) | (0.3366) | (0.0908) | (0.0817) | (0.0779) | |
| 3 Years of OE | 0.1700*** | 0.1568*** | 0.1821*** | -0.0341 | 0.0601 | -0.4223 | 0.4687*** | 0.0303 | 0.0282 |
| (0.0317) | (0.0388) | (0.0424) | (0.1853) | (0.2104) | (0.2668) | (0.1773) | (0.0827) | (0.1008) | |
| 5 Years of OE | 0.2234*** | 0.2191*** | 0.2476*** | -0.0315 | 0.1028 | -0.4835 | 1.0855* | -0.0674 | 0.0866 |
| (0.0399) | (0.0449) | (0.0487) | (0.2398) | (0.2628) | (0.3216) | (0.5809) | (0.1763) | (0.2094) | |
| 10 Years of OE | 0.2417*** | 0.2639*** | 0.2861*** | 0.0177 | 0.1623 | -0.3262 | 4.5032 | -0.0570 | -0.0487 |
| (0.0520) | (0.0518) | (0.0556) | (0.2482) | (0.2499) | (0.2772) | (4.0280) | (0.3098) | (0.3089) | |
| 3 years of NRCA | 0.1722*** | 0.2147*** | 0.1882*** | 0.1136** | 0.0826 | -0.0102 | 0.5413** | 0.5159*** | 0.4403*** |
| (0.0402) | (0.0418) | (0.0386) | (0.0551) | (0.0591) | (0.0554) | (0.2176) | (0.1154) | (0.1195) | |
| 5 years of NRCA | 0.2670*** | 0.3316*** | 0.2905*** | 0.1859* | 0.0860 | -0.0858 | 0.3632** | 0.7872*** | 0.6519*** |
| (0.0612) | (0.0627) | (0.0566) | (0.1126) | (0.1038) | (0.0958) | (0.1756) | (0.1675) | (0.1678) | |
| 10 years of NRCA | 0.3993*** | 0.4748*** | 0.4102*** | 0.3450 | -0.1110 | -0.5139** | -3.7969 | 1.0420*** | 0.7375*** |
| (0.0902) | (0.0862) | (0.0734) | (0.3805) | (0.2727) | (0.2445) | (3.0452) | (0.2512) | (0.1912) | |
| 3 years of NRCI | 0.0703* | -0.0159 | -0.0646 | 0.0570 | -0.1298 | -0.1282 | -0.0536 | 0.0248 | -0.0847 |
| (0.0413) | (0.0424) | (0.0435) | (0.0481) | (0.0892) | (0.1335) | (0.1866) | (0.0483) | (0.0526) | |
| 5 years of NRCI | 0.1142* | -0.0231 | -0.0984 | 0.0939 | -0.1964 | -0.2305 | -0.8242** | 0.0373 | -0.1310 |
| (0.0629) | (0.0662) | (0.0688) | (0.0776) | (0.1427) | (0.2044) | (0.3591) | (0.0754) | (0.0835) | |
| 10 years of NRCI | 0.2047** | -0.0119 | -0.1251 | 0.1756 | -0.2299 | -0.5080 | 15.9488*** | 0.0514 | -0.1809 |
| (0.0865) | (0.0994) | (0.1081) | (0.1595) | (0.2893) | (0.3149) | (5.0011) | (0.1122) | (0.1354) | |
| 3 years of RCOG | -0.0689** | 0.0629 | -0.0102 | -0.0581 | 0.0015 | -0.0134 | -0.2584** | 0.1217* | 0.0005 |
| (0.0318) | (0.0408) | (0.0300) | (0.0425) | (0.0633) | (0.1919) | (0.1222) | (0.0705) | (0.0329) | |
| 5 years of RCOG | -0.1164** | 0.1019 | -0.0154 | -0.0880 | 0.0123 | 0.0314 | -0.7541** | 0.2015* | 0.0014 |
| (0.0501) | (0.0631) | (0.0480) | (0.0737) | (0.1063) | (0.2811) | (0.3393) | (0.1069) | (0.0526) | |
| 10 years of RCOG | -0.2326*** | 0.1798* | -0.0191 | -0.1195 | 0.0798 | 0.3691 | -3.8501 | 0.3832*** | 0.0071 |
| (0.0792) | (0.0937) | (0.0800) | (0.1832) | (0.2485) | (0.3505) | (2.9752) | (0.1406) | (0.0876) | |
| 3 years of RMAN | -0.0437 | -0.0712 | -0.0618 | -0.0184 | -0.1597* | -0.1242 | -0.2327 | -0.0430 | -0.0344 |
| (0.0776) | (0.0475) | (0.0870) | (0.1052) | (0.0887) | (0.1785) | (0.1509) | (0.0633) | (0.1042) | |
| 5 years of RMAN | -0.0673 | -0.1047 | -0.0936 | 0.0003 | -0.2173 | -0.1384 | -0.6033* | -0.0568 | -0.0476 |
| (0.1193) | (0.0743) | (0.1347) | (0.1669) | (0.1449) | (0.2681) | (0.3569) | (0.0973) | (0.1590) | |
| 10 years of RMAN | -0.0935 | -0.1166 | -0.1152 | 0.1843 | -0.1249 | 0.1254 | -3.3147 | -0.0182 | -0.0265 |
| (0.1640) | (0.1122) | (0.1916) | (0.2899) | (0.2959) | (0.3855) | (2.9932) | (0.1346) | (0.2162) | |
| 3 years of NRMN | -0.0572 | -0.0058 | -0.0639* | -0.0786 | 0.1113 | -0.0907 | -0.3180*** | 0.0026 | -0.0662* |
| (0.0372) | (0.0291) | (0.0369) | (0.0673) | (0.1020) | (0.1091) | (0.1201) | (0.0366) | (0.0355) | |
| 5 years of NRMN | -0.0865 | -0.0134 | -0.1033* | -0.1596 | 0.1618 | -0.1241 | -0.7497** | 0.0007 | -0.1041* |
| (0.0597) | (0.0463) | (0.0556) | (0.1370) | (0.1617) | (0.1697) | (0.3457) | (0.0587) | (0.0544) | |
| 10 years of NRMN | -0.1181 | -0.0519 | -0.1805** | -0.4455 | 0.1418 | -0.0717 | -3.5858 | -0.0231 | -0.1593** |
| (0.1025) | (0.0766) | (0.0726) | (0.4207) | (0.3003) | (0.2907) | (3.0164) | (0.0983) | (0.0784) | |
| N | 1,693 | 1,693 | 1,693 | 745 | 528 | 436 | 948 | 1,165 | 1,257 |
Table S4
OLS estimates of cumulative returns to source country GE, OE, and TE (quartic): low-skilled workers
| Parameters | All immigrant workers | Stayers | Switchers | ||||||
|---|---|---|---|---|---|---|---|---|---|
| 1-Digit | 2-Digit | 3-Digit | 1-Digit | 2-Digit | 3-Digit | 1-Digit | 2-Digit | 3-Digit | |
| 3 Years of GE | 0.0321 | 0.0111 | 0.0281 | 0.0204 | -0.0784 | 0.1812 | 0.0492 | 0.0050 | 0.0024 |
| (0.0424) | (0.0435) | (0.0432) | (0.2204) | (0.2901) | (0.4032) | (0.0552) | (0.0471) | (0.0453) | |
| 5 Years of GE | 0.0487 | 0.0226 | 0.0456 | 0.0415 | -0.1135 | 0.2176 | 0.0751 | 0.0153 | 0.0106 |
| (0.0582) | (0.0600) | (0.0596) | (0.2914) | (0.3826) | (0.5436) | (0.0763) | (0.0653) | (0.0627) | |
| 10 Years of GE | 0.0744 | 0.0548 | 0.0805 | 0.0851 | -0.1422 | 0.1868 | 0.1250 | 0.0519 | 0.0393 |
| (0.0713) | (0.0745) | (0.0737) | (0.3240) | (0.4218) | (0.6501) | (0.0954) | (0.0823) | (0.0783) | |
| 3 Years of OE | 0.0021 | 0.0469 | 0.0690 | -0.0337 | 0.2275 | 0.1953 | 0.1271 | -0.0590 | -0.0385 |
| (0.0345) | (0.0446) | (0.0513) | (0.2391) | (0.2964) | (0.4180) | (0.1631) | (0.0867) | (0.1096) | |
| 5 Years of OE | -0.0031 | 0.0633 | 0.0938 | -0.0673 | 0.2975 | 0.2536 | 0.0668 | -0.0619 | -0.1182 |
| (0.0435) | (0.0548) | (0.0625) | (0.3101) | (0.3933) | (0.5641) | (0.2445) | (0.0995) | (0.2185) | |
| 10 Years of OE | -0.0099 | 0.0753 | 0.1122* | -0.1301 | 0.2918 | 0.2250 | -0.0404 | 0.0352 | 0.2721** |
| (0.0505) | (0.0560) | (0.0635) | (0.3230) | (0.4352) | (0.6658) | (0.5675) | (0.1542) | (0.1153) | |
| 3 Years of NRCA | 0.4488*** | 0.3350** | 0.3329*** | 0.4362*** | 0.4590*** | 0.3877*** | 1.3619 | 0.0272 | -1.8790 |
| (0.1081) | (0.1662) | (0.0781) | (0.1004) | (0.1700) | (0.1298) | (1.2122) | (0.2084) | (1.8057) | |
| 5 Years of NRCA | 0.6995*** | 0.5224** | 0.5329*** | 0.6630*** | 0.6845** | 0.6143*** | 1.7608 | 0.0427 | -13.5495 |
| (0.1664) | (0.2519) | (0.1233) | (0.1676) | (0.2638) | (0.2115) | (1.5745) | (0.2720) | (12.1213) | |
| 10 Years of NRCA | 1.0409*** | 0.7750** | 0.8846*** | 0.8944** | 0.8183* | 0.9816** | -1.2174 | 0.0629 | -124.7749 |
| (0.2348) | (0.3232) | (0.1933) | (0.3570) | (0.4395) | (0.4049) | (1.2194) | (0.2713) | (109.8213) | |
| 3 Years of NRCI | 0.1920*** | 0.1447** | 0.0464 | 0.1659* | 0.0843 | 0.0650 | -0.6430 | 0.0837 | 0.0127 |
| (0.0649) | (0.0650) | (0.0523) | (0.0860) | (0.1811) | (0.1587) | (1.0663) | (0.0640) | (0.0663) | |
| 5 Years of NRCI | 0.3022*** | 0.2188** | 0.0752 | 0.2506* | 0.1210 | 0.0573 | -4.2488 | 0.1220 | 0.0229 |
| (0.1021) | (0.0982) | (0.0835) | (0.1362) | (0.2850) | (0.2501) | (5.5933) | (0.0973) | (0.1063) | |
| 10 Years of NRCI | 0.4650*** | 0.2744** | 0.1316 | 0.3238 | 0.1206 | -0.1886 | -18.0374 | 0.1154 | 0.0594 |
| (0.1574) | (0.1293) | (0.1388) | (0.2206) | (0.4585) | (0.4406) | (22.5806) | (0.1301) | (0.1780) | |
| 3 Years of RCOG | 0.0695** | 0.1542** | 0.0210 | 0.0784** | 0.2713*** | -0.2451 | -0.1316 | 0.1670 | 0.0292 |
| (0.0319) | (0.0687) | (0.0368) | (0.0397) | (0.0954) | (0.2045) | (0.1350) | (0.2104) | (0.0437) | |
| 5 Years of RCOG | 0.1081** | 0.2450** | 0.0362 | 0.1357* | 0.4236** | -0.3285 | -0.1305 | 0.2679 | 0.0509 |
| (0.0505) | (0.1081) | (0.0580) | (0.0709) | (0.1641) | (0.3469) | (0.2233) | (0.2912) | (0.0682) | |
| 10 Years of RCOG | 0.1597** | 0.3911** | 0.0799 | 0.2807 | 0.6208* | -0.1600 | 0.3139 | 0.4407* | 0.1167 |
| (0.0810) | (0.1659) | (0.0902) | (0.1931) | (0.3596) | (0.7545) | (0.6260) | (0.2657) | (0.1020) | |
| 3 Years of RMAN | 0.0223 | -0.0267 | -0.0564 | 0.0023 | 0.0399 | -0.0587 | 0.0302 | -0.0398 | -0.0611 |
| (0.0406) | (0.0402) | (0.0523) | (0.0672) | (0.1097) | (0.2125) | (0.1273) | (0.0538) | (0.0585) | |
| 5 Years of RMAN | 0.0362 | -0.0413 | -0.0830 | 0.0111 | 0.0981 | -0.0493 | 0.0243 | -0.0617 | -0.0889 |
| (0.0644) | (0.0630) | (0.0808) | (0.1113) | (0.1833) | (0.3372) | (0.2105) | (0.0813) | (0.0903) | |
| 10 Years of RMAN | 0.0610 | -0.0606 | -0.0836 | 0.0660 | 0.3485 | 0.1781 | -0.1116 | -0.0878 | -0.0823 |
| (0.1031) | (0.0954) | (0.1190) | (0.2241) | (0.3701) | (0.5942) | (0.5349) | (0.1080) | (0.1336) | |
| 3 Years of NRMN | 0.0451 | 0.0393 | 0.0093 | 0.0608 | 0.0528 | 0.0084 | -0.0012 | 0.0344 | 0.0230 |
| (0.0370) | (0.0251) | (0.0225) | (0.0558) | (0.0600) | (0.0990) | (0.1388) | (0.0301) | (0.0250) | |
| 5 Years of NRMN | 0.0777 | 0.0599 | 0.0117 | 0.1188 | 0.0850 | -0.0344 | 0.0055 | 0.0512 | 0.0317 |
| (0.0597) | (0.0402) | (0.0360) | (0.1093) | (0.0990) | (0.1636) | (0.2321) | (0.0484) | (0.0398) | |
| 10 Years of NRMN | 0.1545 | 0.0785 | -0.0010 | 0.3158 | 0.1344 | -0.3411 | 0.0492 | 0.0603 | 0.0185 |
| (0.1032) | (0.0677) | (0.0601) | (0.3388) | (0.2402) | (0.3839) | (0.4685) | (0.0828) | (0.0655) | |
| N | 1,230 | 1,230 | 1,230 | 423 | 251 | 188 | 807 | 979 | 1,042 |
Table S5
OLS estimates of cumulative returns to source country GE, OE, and TE (quartic): high-skilled workers
| Parameters | All immigrant workers | Stayers | Switchers | ||||||
|---|---|---|---|---|---|---|---|---|---|
| 1-Digit | 2-Digit | 3-Digit | 1-Digit | 2-Digit | 3-Digit | 1-Digit | 2-Digit | 3-Digit | |
| 3 Years of GE | 0.0423 | 0.0579 | 0.0487 | 0.1302 | 0.1119 | 0.2343 | 0.0340 | 0.0601 | 0.0577 |
| (0.0613) | (0.0647) | (0.0631) | (0.1642) | (0.1854) | (0.2139) | (0.0713) | (0.0732) | (0.0701) | |
| 5 Years of GE | 0.0613 | 0.0796 | 0.0696 | 0.1705 | 0.1479 | 0.3446 | 0.0530 | 0.0826 | 0.0818 |
| (0.0834) | (0.0881) | (0.0860) | (0.2212) | (0.2460) | (0.2852) | (0.0973) | (0.0993) | (0.0953) | |
| 10 Years of GE | 0.0824 | 0.0906 | 0.0829 | 0.1500 | 0.1623 | 0.4883 | 0.0874 | 0.0911 | 0.0930 |
| (0.1023) | (0.1070) | (0.1046) | (0.2588) | (0.2803) | (0.3233) | (0.1204) | (0.1192) | (0.1148) | |
| 3 Years of OE | 0.2438*** | 0.2027*** | 0.2390*** | 0.1312 | 0.2045 | 0.2030 | 0.4011* | 0.0811 | 0.1384 |
| (0.0406) | (0.0499) | (0.0517) | (0.1702) | (0.2173) | (0.2467) | (0.2423) | (0.1263) | (0.1223) | |
| 5 Years of OE | 0.3249*** | 0.2753*** | 0.3170*** | 0.1838 | 0.2857 | 0.2550 | 0.5252 | 0.0791 | 0.1467 |
| (0.0511) | (0.0579) | (0.0601) | (0.2193) | (0.2640) | (0.2964) | (0.7759) | (0.1918) | (0.1956) | |
| 10 Years of OE | 0.3598*** | 0.3231*** | 0.3559*** | 0.2491 | 0.3471 | 0.2623 | -1.8924 | 0.0520 | 0.1421 |
| (0.0657) | (0.0691) | (0.0792) | (0.2275) | (0.2343) | (0.2472) | (6.0921) | (0.2221) | (0.3705) | |
| 3 Years of NRCA | 0.0974*** | 0.1193*** | 0.0819*** | 0.0540 | 0.0802 | -0.0774 | 0.3670* | 0.4823*** | 0.1625** |
| (0.0349) | (0.0398) | (0.0265) | (0.0458) | (0.0545) | (0.0553) | (0.1877) | (0.1485) | (0.0735) | |
| 5 Years of NRCA | 0.1509*** | 0.1891*** | 0.1320*** | 0.0735 | 0.0963 | -0.1754* | 0.5738 | 0.6747*** | 0.2585** |
| (0.0551) | (0.0623) | (0.0425) | (0.0895) | (0.0913) | (0.1007) | (0.3603) | (0.2191) | (0.1140) | |
| 10 Years of NRCA | 0.2305** | 0.3050*** | 0.2177*** | 0.0633 | -0.0232 | -0.5464** | 0.8697 | 0.4930 | 0.4028** |
| (0.0915) | (0.0957) | (0.0753) | (0.2778) | (0.2112) | (0.2492) | (4.3292) | (0.3183) | (0.1679) | |
| 3 Years of NRCI | 0.0162 | -0.0716 | -0.1577** | 0.0280 | -0.1441 | -0.3815** | -0.0802 | -0.0096 | -0.0705 |
| (0.0333) | (0.0449) | (0.0738) | (0.0463) | (0.0875) | (0.1541) | (0.2275) | (0.0520) | (0.1040) | |
| 5 Years of NRCI | 0.0281 | -0.1128 | -0.2451** | 0.0399 | -0.2501* | -0.5796** | -0.7691 | -0.0165 | -0.1131 |
| (0.0528) | (0.0704) | (0.1127) | (0.0825) | (0.1399) | (0.2328) | (0.4741) | (0.0809) | (0.1602) | |
| 10 Years of NRCI | 0.0630 | -0.1668 | -0.3592** | 0.0427 | -0.5063** | -0.7201** | 10.9744 | -0.0271 | -0.1993 |
| (0.0867) | (0.1076) | (0.1536) | (0.2151) | (0.2573) | (0.3350) | (8.7966) | (0.1203) | (0.2293) | |
| 3 Years of RCOG | -0.1492*** | 0.0115 | -0.0114 | -0.1664*** | -0.0353 | -0.0696 | -0.2244 | 0.0343 | -0.0110 |
| (0.0433) | (0.0413) | (0.0493) | (0.0579) | (0.0772) | (0.3235) | (0.1660) | (0.0619) | (0.0568) | |
| 5 Years of RCOG | -0.2445*** | 0.0179 | -0.0197 | -0.2632*** | -0.0480 | -0.0967 | -0.4034 | 0.0589 | -0.0179 |
| (0.0678) | (0.0623) | (0.0783) | (0.0892) | (0.1191) | (0.4602) | (0.4411) | (0.0941) | (0.0903) | |
| 10 Years of RCOG | -0.4438*** | 0.0316 | -0.0472 | -0.4201*** | -0.0254 | -0.0584 | 0.6228 | 0.1290 | -0.0359 |
| (0.1042) | (0.0851) | (0.1260) | (0.1373) | (0.2005) | (0.4174) | (4.3398) | (0.1245) | (0.1456) | |
| 3 Years of RMAN | -0.4502*** | -0.3661*** | -0.4460*** | -0.3804** | -0.3015 | -1.1005 | -0.5958*** | -0.3799** | -0.4468*** |
| (0.1383) | (0.0750) | (0.1238) | (0.1640) | (0.1998) | (0.8093) | (0.2085) | (0.1478) | (0.1422) | |
| 5 Years of RMAN | -0.6460*** | -0.5367*** | -0.6527*** | -0.5204** | -0.4058 | -1.5851 | -0.9189* | -0.5363** | -0.5378*** |
| (0.1986) | (0.1131) | (0.1772) | (0.2375) | (0.2865) | (1.1642) | (0.4862) | (0.2090) | (0.1701) | |
| 10 Years of RMAN | -0.5692*** | -0.5387*** | -0.6689*** | -0.2808 | -0.1717 | -1.4468 | 0.7358 | -0.3697 | -0.2453 |
| (0.2193) | (0.1488) | (0.1997) | (0.2893) | (0.3203) | (1.0872) | (4.3437) | (0.2373) | (0.1909) | |
| 3 Years of NRMN | -0.4705*** | -0.1811*** | -0.2608*** | -0.5581*** | -0.3921*** | -0.3708 | -0.4584*** | -0.1374** | -0.2441*** |
| (0.0912) | (0.0570) | (0.0632) | (0.1313) | (0.1247) | (0.2681) | (0.1676) | (0.0695) | (0.0758) | |
| 5 Years of NRMN | -0.7159*** | -0.2863*** | -0.4073*** | -0.8678*** | -0.6327*** | -0.5690 | -0.5130 | -0.2160** | -0.3776*** |
| (0.1344) | (0.0894) | (0.0974) | (0.2000) | (0.1989) | (0.4329) | (0.5157) | (0.1087) | (0.1163) | |
| 10 Years of NRMN | -0.9025*** | -0.4533*** | -0.6119*** | -1.2103*** | -1.0613*** | -0.8278 | 1.3055 | -0.3355** | -0.5412*** |
| (0.1434) | (0.1346) | (0.1379) | (0.2992) | (0.3252) | (0.7594) | (5.0752) | (0.1630) | (0.1624) | |
| N | 1,229 | 1,229 | 1,229 | 583 | 443 | 363 | 646 | 786 | 866 |
Table S6
OLS estimates of cumulative returns to source country GE, OE, and TE (quartic): high income source countries
| Parameters | All immigrant workers | Stayers | Switchers | ||||||
|---|---|---|---|---|---|---|---|---|---|
| 1-Digit | 2-Digit | 3-Digit | 1-Digit | 2-Digit | 3-Digit | 1-Digit | 2-Digit | 3-Digit | |
| 3 Years of GE | 0.0180 | 0.0266 | 0.0307 | 0.0277 | -0.0723 | 0.2615 | 0.0658 | 0.0145 | 0.0204 |
| (0.0411) | (0.0417) | (0.0414) | (0.1459) | (0.1544) | (0.1816) | (0.0462) | (0.0444) | (0.0434) | |
| 5 Years of GE | 0.0310 | 0.0431 | 0.0489 | 0.0393 | -0.0863 | 0.3481 | 0.0993 | 0.0284 | 0.0368 |
| (0.0558) | (0.0572) | (0.0566) | (0.1943) | (0.2050) | (0.2401) | (0.0634) | (0.0610) | (0.0595) | |
| 10 Years of GE | 0.0593 | 0.0732 | 0.0784 | 0.0345 | -0.0617 | 0.3828 | 0.1545** | 0.0627 | 0.0704 |
| (0.0669) | (0.0702) | (0.0689) | (0.2188) | (0.2326) | (0.2718) | (0.0780) | (0.0753) | (0.0726) | |
| 3 Years of OE | 0.1531*** | 0.1718*** | 0.2031*** | 0.0287 | 0.3280** | -0.1074 | 0.6426*** | 0.0545 | 0.0597 |
| (0.0305) | (0.0380) | (0.0444) | (0.1528) | (0.1474) | (0.1829) | (0.2021) | (0.0819) | (0.1031) | |
| 5 Years of OE | 0.2035*** | 0.2281*** | 0.2722*** | 0.0424 | 0.4316** | -0.1012 | 1.6618** | -0.0088 | 0.0935 |
| (0.0391) | (0.0469) | (0.0536) | (0.1986) | (0.1884) | (0.2280) | (0.6835) | (0.1130) | (0.1837) | |
| 10 Years of OE | 0.2266*** | 0.2423*** | 0.2989*** | 0.0715 | 0.4554** | 0.0150 | 9.1869** | 0.0798 | 0.1186 |
| (0.0494) | (0.0512) | (0.0601) | (0.2082) | (0.1905) | (0.2178) | (4.5871) | (0.1503) | (0.2858) | |
| 3 Years of NRCA | 0.1756*** | 0.1786*** | 0.1396*** | 0.1183** | 0.0969* | 0.0679 | 0.5889*** | 0.4800*** | 0.3998*** |
| (0.0386) | (0.0418) | (0.0320) | (0.0510) | (0.0561) | (0.0565) | (0.2100) | (0.1504) | (0.1181) | |
| 5 Years of NRCA | 0.2747*** | 0.2827*** | 0.2214*** | 0.1815** | 0.1395 | 0.1016 | 0.1511 | 0.7524*** | 0.5892*** |
| (0.0603) | (0.0650) | (0.0489) | (0.0855) | (0.0900) | (0.0941) | (0.2535) | (0.1960) | (0.1632) | |
| 10 Years of NRCA | 0.4220*** | 0.4513*** | 0.3505*** | 0.2626 | 0.1489 | 0.1317 | -6.7602* | 0.9597** | 0.6208*** |
| (0.0937) | (0.0972) | (0.0718) | (0.1768) | (0.1697) | (0.2001) | (3.4645) | (0.4552) | (0.1697) | |
| 3 Years of NRCI | 0.0880** | -0.0595 | -0.0809* | 0.1123** | -0.2228*** | -0.2877** | 0.0174 | 0.0830* | -0.0588 |
| (0.0412) | (0.0431) | (0.0426) | (0.0478) | (0.0753) | (0.1180) | (0.2173) | (0.0492) | (0.0627) | |
| 5 Years of NRCI | 0.1356** | -0.0955 | -0.1306* | 0.1597** | -0.3620*** | -0.4878** | -0.7791* | 0.1176 | -0.0953 |
| (0.0635) | (0.0655) | (0.0677) | (0.0757) | (0.1218) | (0.2057) | (0.4380) | (0.0755) | (0.1000) | |
| 10 Years of NRCI | 0.1865** | -0.1547* | -0.2281** | 0.1387 | -0.6065*** | -0.9448** | -7.7002** | 0.0908 | -0.1704 |
| (0.0893) | (0.0883) | (0.1100) | (0.1291) | (0.2201) | (0.4450) | (3.6392) | (0.1038) | (0.1644) | |
| 3 Years of RCOG | -0.0691** | 0.0718** | -0.0321 | -0.0939*** | 0.0547 | -0.0772 | -0.3377*** | 0.1110* | -0.0010 |
| (0.0307) | (0.0349) | (0.0345) | (0.0344) | (0.0573) | (0.0958) | (0.1301) | (0.0634) | (0.0427) | |
| 5 Years of RCOG | -0.1161** | 0.1115** | -0.0519 | -0.1490** | 0.0995 | -0.1288 | -1.0500*** | 0.1792* | -0.0016 |
| (0.0485) | (0.0550) | (0.0549) | (0.0606) | (0.0933) | (0.1539) | (0.3978) | (0.0965) | (0.0679) | |
| 10 Years of RCOG | -0.2268*** | 0.1614* | -0.0877 | -0.2404 | 0.2271 | -0.2512 | -6.7981** | 0.3069** | -0.0022 |
| (0.0767) | (0.0860) | (0.0890) | (0.1619) | (0.1864) | (0.2990) | (3.3230) | (0.1304) | (0.1092) | |
| 3 Years of RMAN | -0.0969** | -0.1025** | -0.1291** | -0.0441 | -0.1279 | 0.4435 | -0.4116*** | -0.0773 | -0.1443** |
| (0.0437) | (0.0451) | (0.0580) | (0.0612) | (0.0928) | (0.5220) | (0.1274) | (0.0578) | (0.0592) | |
| 5 Years of RMAN | -0.1507** | -0.1560** | -0.1954** | -0.0480 | -0.1715 | 0.7323 | -1.1908*** | -0.1221 | -0.2212** |
| (0.0693) | (0.0706) | (0.0902) | (0.1013) | (0.1480) | (0.8107) | (0.4040) | (0.0881) | (0.0896) | |
| 10 Years of RMAN | -0.2158* | -0.2072* | -0.2399* | 0.0641 | -0.0787 | 1.3198 | -7.1982** | -0.2003 | -0.2970** |
| (0.1114) | (0.1072) | (0.1362) | (0.2030) | (0.2539) | (1.1685) | (3.4165) | (0.1232) | (0.1327) | |
| 3 Years of NRMN | -0.0475 | -0.0337 | -0.0595** | -0.0090 | -0.0168 | 0.0084 | -0.3276*** | -0.0213 | -0.0580* |
| (0.0369) | (0.0276) | (0.0302) | (0.0543) | (0.0795) | (0.1077) | (0.1232) | (0.0328) | (0.0339) | |
| 5 Years of NRMN | -0.0702 | -0.0563 | -0.0964** | -0.0083 | -0.0396 | 0.0112 | -1.0685*** | -0.0358 | -0.0920* |
| (0.0597) | (0.0442) | (0.0475) | (0.0956) | (0.1252) | (0.1712) | (0.4053) | (0.0527) | (0.0527) | |
| 10 Years of NRMN | -0.0867 | -0.1128 | -0.1717** | 0.0252 | -0.1458 | -0.0054 | -7.0638** | -0.0728 | -0.1499* |
| (0.1044) | (0.0738) | (0.0741) | (0.2303) | (0.2056) | (0.3009) | (3.4280) | (0.0890) | (0.0805) | |
| N | 1,875 | 1,875 | 1,875 | 779 | 532 | 426 | 1,096 | 1,343 | 1,449 |
Table S7
OLS estimates of cumulative returns to source country GE, OE, and TE (quartic): low income source countries
| Parameters | All immigrant workers | Stayers | Switchers | ||||||
|---|---|---|---|---|---|---|---|---|---|
| 1-Digit | 2-Digit | 3-Digit | 1-Digit | 2-Digit | 3-Digit | 1-Digit | 2-Digit | 3-Digit | |
| 3 Years of GE | 0.1760* | 0.1846* | 0.1500 | 0.4061* | 0.3633 | 0.1398 | 0.0831 | 0.1185 | 0.0798 |
| (0.0923) | (0.1041) | (0.0948) | (0.2311) | (0.4090) | (0.6474) | (0.1229) | (0.1230) | (0.1103) | |
| 5 Years of GE | 0.2305* | 0.2469* | 0.2016 | 0.5301* | 0.5082 | 0.2693 | 0.1101 | 0.1547 | 0.1022 |
| (0.1254) | (0.1400) | (0.1287) | (0.3123) | (0.5486) | (0.8239) | (0.1676) | (0.1646) | (0.1489) | |
| 10 Years of GE | 0.2472 | 0.2745* | 0.2245 | 0.5553 | 0.6785 | 0.6249 | 0.1226 | 0.1559 | 0.0898 |
| (0.1515) | (0.1626) | (0.1540) | (0.3731) | (0.6325) | (0.8101) | (0.2040) | (0.1881) | (0.1751) | |
| 3 Years of OE | 0.0987* | 0.1500** | 0.0937 | 0.0756 | 0.5110 | 0.5710 | 0.6353* | 0.1689 | -0.0209 |
| (0.0526) | (0.0655) | (0.0654) | (0.2357) | (0.3857) | (0.4987) | (0.3402) | (0.1401) | (0.2099) | |
| 5 Years of OE | 0.1441** | 0.2115*** | 0.1642** | 0.1103 | 0.6086 | 0.6925 | 1.1647** | 0.1131 | -0.0394 |
| (0.0673) | (0.0754) | (0.0764) | (0.3068) | (0.4993) | (0.6220) | (0.5758) | (0.2205) | (0.2622) | |
| 10 Years of OE | 0.1960** | 0.2680*** | 0.3069*** | 0.1567 | 0.4459 | 0.5522 | -7.5834 | 0.1198 | -0.0221 |
| (0.0812) | (0.0816) | (0.0874) | (0.3279) | (0.5255) | (0.6007) | (6.6156) | (0.2012) | (0.2296) | |
| 3 Years of NRCA | 0.1723*** | 0.1410** | 0.1517*** | 0.2172** | 0.0608 | 0.0792 | -0.0269 | 0.3468 | 0.1511 |
| (0.0523) | (0.0672) | (0.0533) | (0.0888) | (0.1396) | (0.1496) | (0.3994) | (0.2272) | (0.1445) | |
| 5 Years of NRCA | 0.2676*** | 0.2311** | 0.2454*** | 0.3888** | 0.1367 | 0.1243 | 0.1969 | 0.4681 | 0.2497 |
| (0.0836) | (0.1043) | (0.0851) | (0.1783) | (0.2369) | (0.2941) | (1.0138) | (0.3039) | (0.2300) | |
| 10 Years of NRCA | 0.4144*** | 0.4183*** | 0.4202*** | 0.8856 | 0.4486 | 0.1879 | 0.7902 | 0.2194 | 0.4688 |
| (0.1432) | (0.1583) | (0.1434) | (0.5842) | (0.5449) | (0.8443) | (3.9783) | (0.3063) | (0.3723) | |
| 3 Years of NRCI | 0.1345** | 0.0440 | -0.0247 | 0.1439 | 0.0879 | -0.1406 | -0.3496 | -0.0334 | -0.1156 |
| (0.0582) | (0.0606) | (0.0850) | (0.0889) | (0.1111) | (0.1372) | (0.3881) | (0.0898) | (0.1134) | |
| 5 Years of NRCI | 0.2115** | 0.0794 | -0.0282 | 0.2344 | 0.1776 | -0.2412 | -2.4397 | -0.0488 | -0.1663 |
| (0.0926) | (0.0951) | (0.1330) | (0.1420) | (0.1814) | (0.2131) | (2.4121) | (0.1405) | (0.1778) | |
| 10 Years of NRCI | 0.3247** | 0.1974 | 0.0336 | 0.3979 | 0.5180 | -0.4738 | -71.7340 | -0.0476 | -0.1348 |
| (0.1511) | (0.1490) | (0.2000) | (0.2515) | (0.4038) | (0.3974) | (121.2068) | (0.2160) | (0.2685) | |
| 3 Years of RCOG | 0.0276 | 0.0365 | 0.1361* | 0.0657 | 0.0443 | 0.5681* | -0.3210 | -0.0994 | 0.0686 |
| (0.0499) | (0.0562) | (0.0766) | (0.0715) | (0.1214) | (0.3288) | (0.2633) | (0.1271) | (0.0818) | |
| 5 Years of RCOG | 0.0412 | 0.0519 | 0.2159* | 0.0976 | 0.0502 | 0.8328* | -0.9807* | -0.1457 | 0.1130 |
| (0.0789) | (0.0889) | (0.1178) | (0.1130) | (0.1990) | (0.4768) | (0.5243) | (0.1921) | (0.1253) | |
| 10 Years of RCOG | 0.0554 | 0.0487 | 0.3447** | 0.1191 | -0.0423 | 0.8509 | 3.5206 | -0.1366 | 0.2125 |
| (0.1251) | (0.1412) | (0.1620) | (0.1890) | (0.3736) | (0.5677) | (3.6925) | (0.2496) | (0.1678) | |
| 3 Years of RMAN | -0.0849 | -0.2065*** | -0.1132 | -0.2363 | -0.6024* | -1.2319*** | -0.2865 | -0.2539 | -0.0172 |
| (0.0705) | (0.0704) | (0.0823) | (0.2273) | (0.3363) | (0.4279) | (0.2435) | (0.1583) | (0.1004) | |
| 5 Years of RMAN | -0.1167 | -0.3115*** | -0.1732 | -0.3285 | -0.7913 | -1.8159*** | -1.0651** | -0.3592* | -0.0099 |
| (0.1077) | (0.1061) | (0.1242) | (0.3321) | (0.4966) | (0.6387) | (0.5105) | (0.2123) | (0.1522) | |
| 10 Years of RMAN | -0.0699 | -0.3810*** | -0.2265 | -0.2156 | -0.2468 | -1.9637** | 3.3255 | -0.2931* | 0.1144 |
| (0.1500) | (0.1407) | (0.1630) | (0.4088) | (0.6613) | (0.9023) | (3.6683) | (0.1712) | (0.2037) | |
| 3 Years of NRMN | -0.2291** | 0.0164 | -0.0255 | -0.5392*** | -0.0428 | -0.1844 | -0.4149 | 0.0315 | 0.0074 |
| (0.1133) | (0.0358) | (0.0378) | (0.1923) | (0.1098) | (0.1508) | (0.2724) | (0.0473) | (0.0452) | |
| 5 Years of NRMN | -0.3224** | 0.0298 | -0.0381 | -0.8002*** | -0.1575 | -0.2577 | -0.6793 | 0.0542 | 0.0130 |
| (0.1537) | (0.0577) | (0.0607) | (0.2754) | (0.1932) | (0.2623) | (0.4553) | (0.0742) | (0.0715) | |
| 10 Years of NRMN | -0.2811 | 0.0660 | -0.0518 | -0.9859 | -0.7656 | -0.2248 | -1.2970 | 0.0997 | 0.0210 |
| (0.3164) | (0.0992) | (0.1034) | (0.6329) | (0.4689) | (0.6095) | (0.9176) | (0.1156) | (0.1151) | |
| N | 584 | 584 | 584 | 227 | 162 | 125 | 357 | 422 | 459 |