
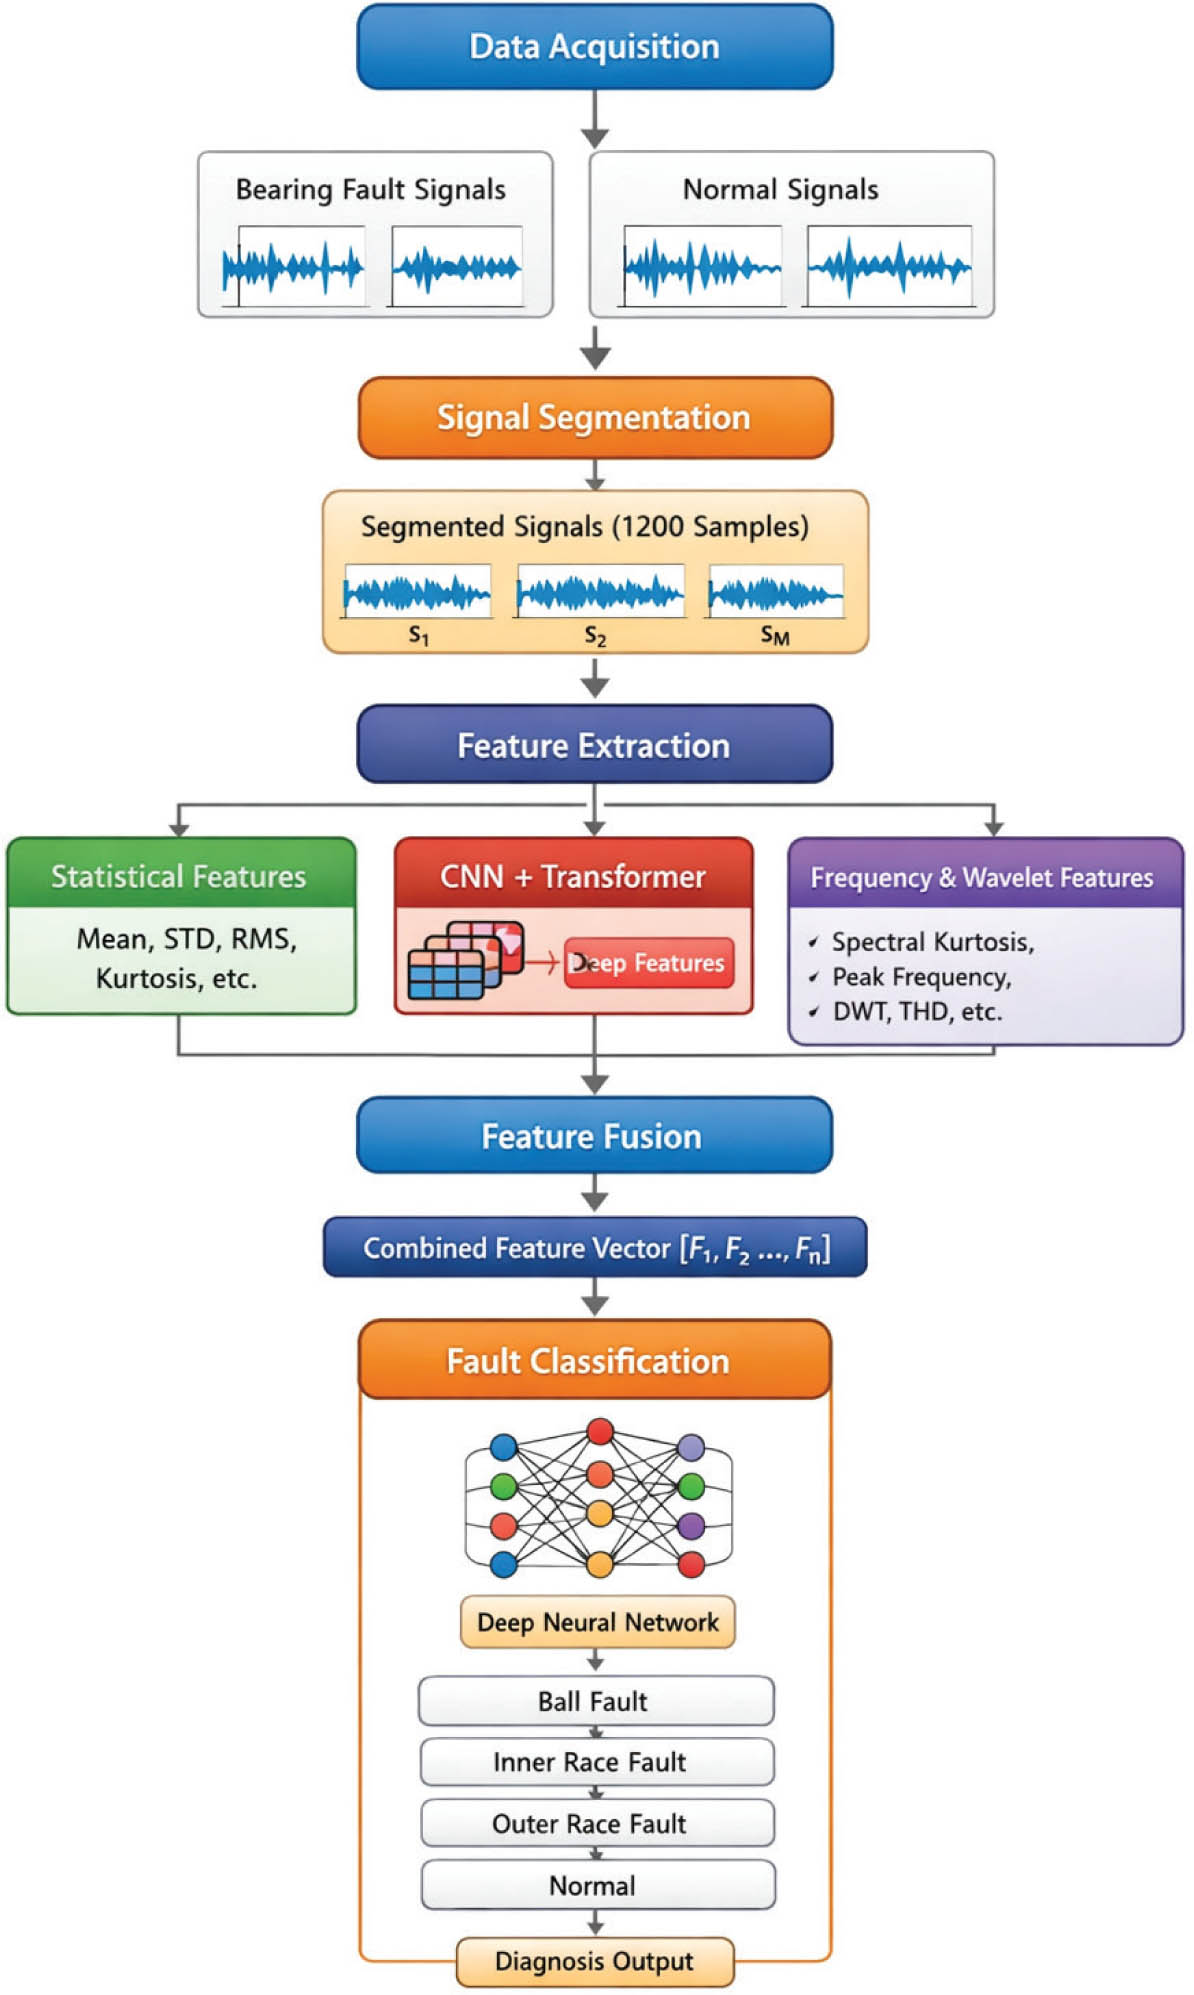
Figure 1:
The proposed FaultFormer framework for induction motor bearing faults classification. CNNs, convolutional neural networks; RMS, root mean square.
Table 1:
Statistical features
| Sr. No. | Feature | Mathematical Expression | Advantage |
|---|---|---|---|
| 1. | Maximum & Minimum amplitude | Indicators of mechanical impacts | |
| 2. | Mean | Average vibration level | |
| 3. | Standard Deviation | Indicate increased vibration fluctuations associated with faults | |
| 4. | Root Mean Square | Analyzing vibrations. An indicator of the severity of mechanical faults. | |
| 5. | Skewness | Sensitive to impulsive behavior in vibration signals | |
| 6. | Kurtosis | Indicate the presence of sharp impulses generated by localized bearing defects | |
| 7. | Crest Factor | Detects impulsive shocks caused by localized defects, making it highly sensitive to early stage bearing faults | |
| 8. | Form Factor | Indicates changes in waveform shape and vibration energy distribution, helping differentiate normal and abnormal operating conditions |
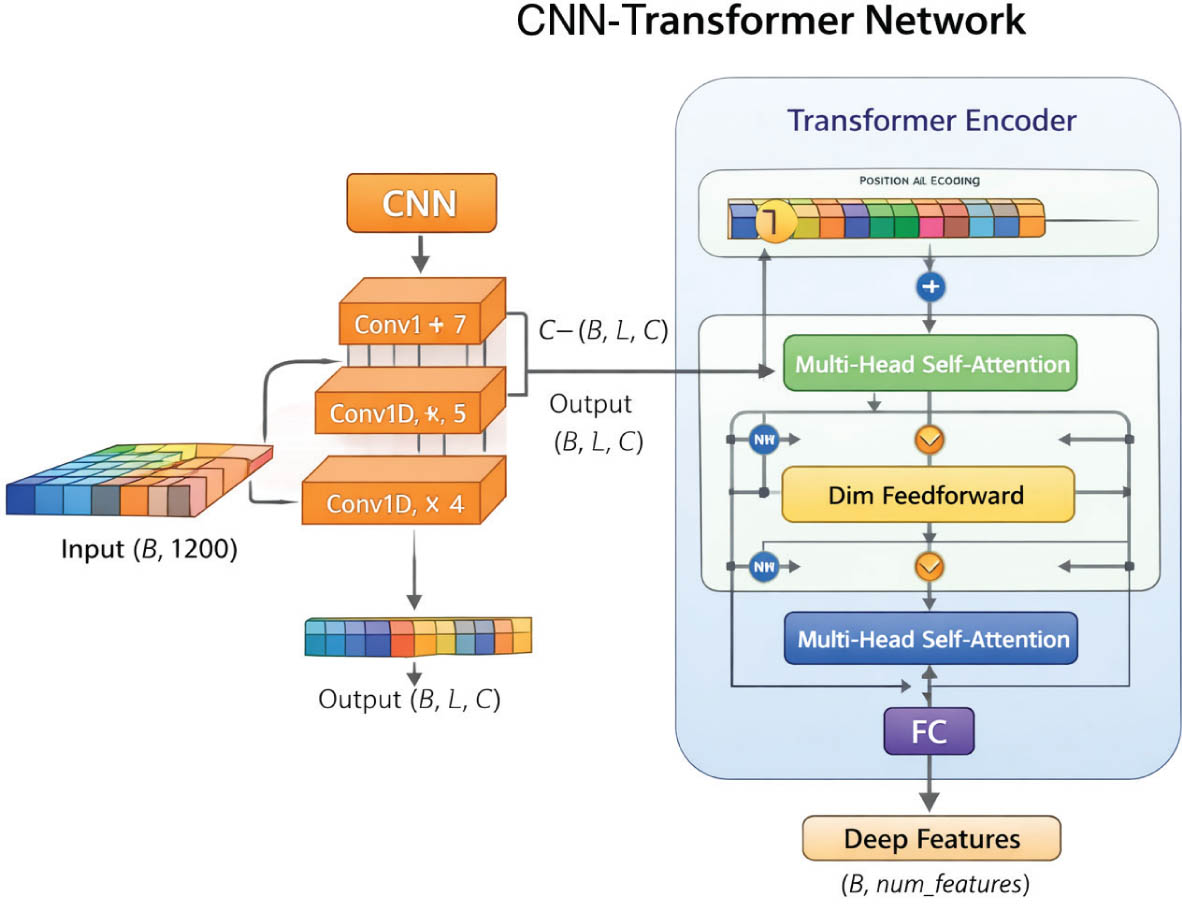
Figure 2:
Deep features extraction using CNN-transformer. CNNs, convolutional neural networks.
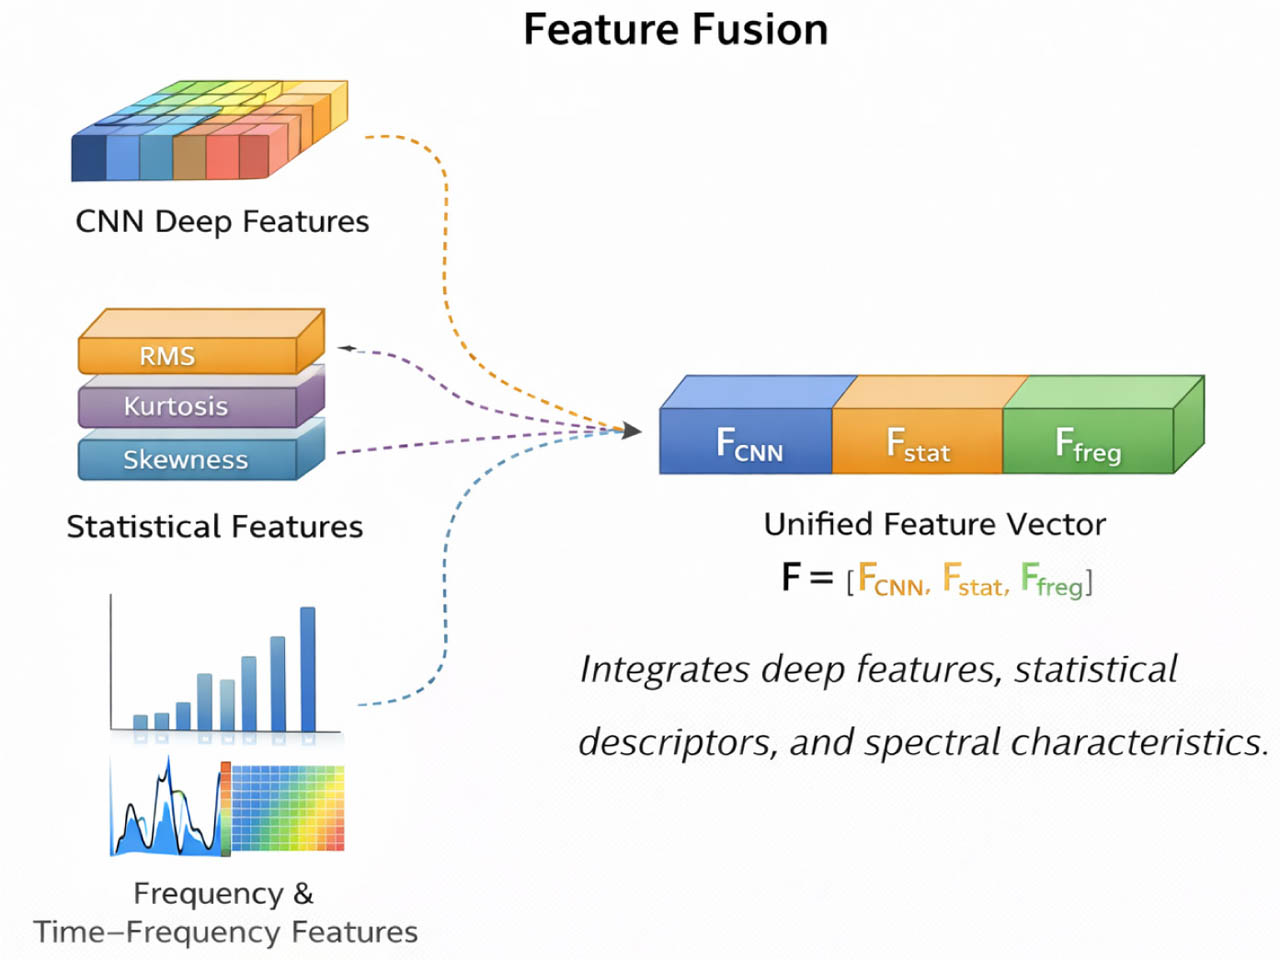
Figure 3:
The feature fusion integrating diverse features. CNNs, convolutional neural networks; RMS, root mean square.
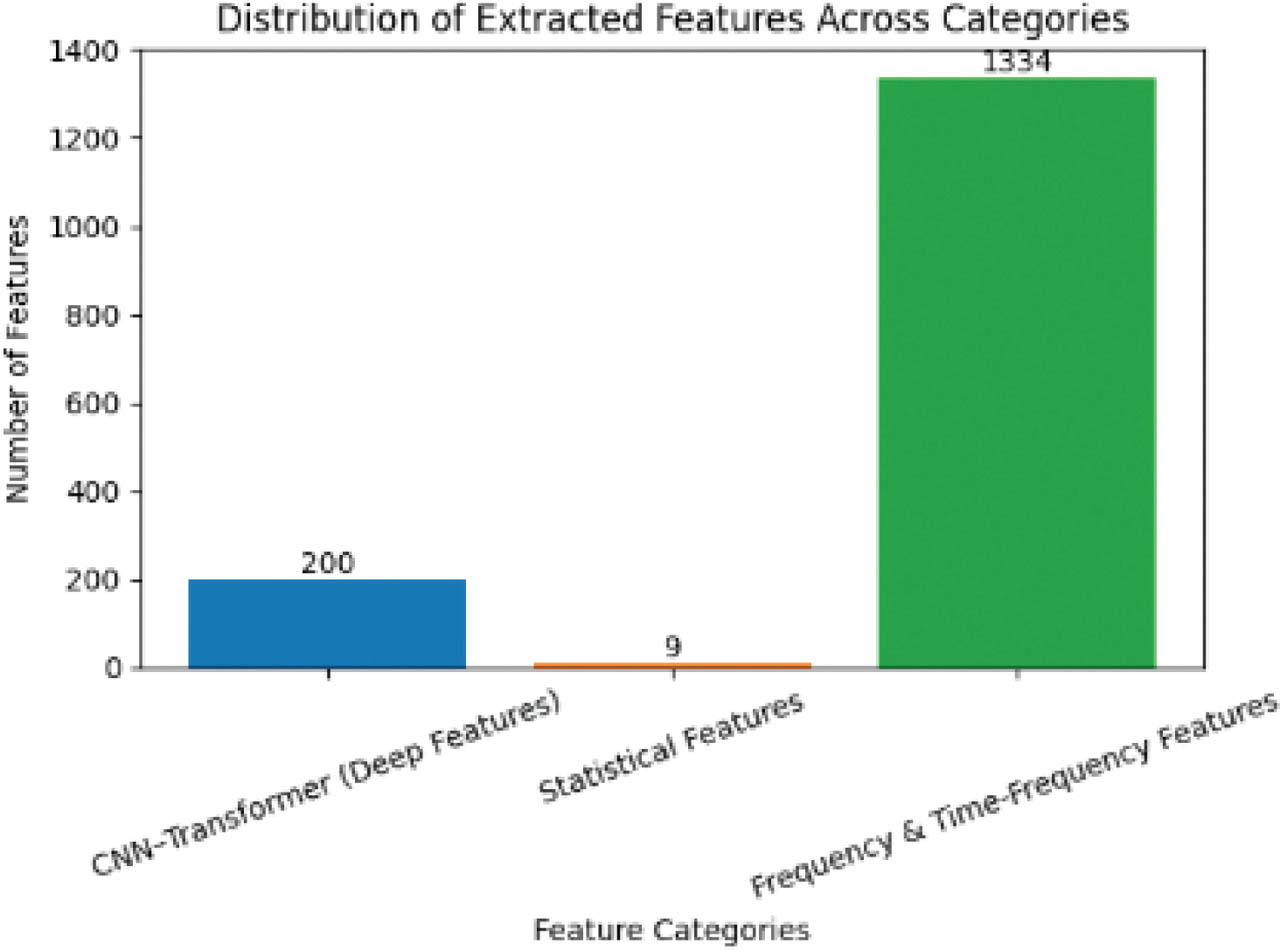
Figure 4:
Distribution of extracted features across different feature categories, illustrating the contribution of deep learning features, statistical descriptors, and frequency/time–frequency features in the fused feature representation. CNNs, convolutional neural networks.
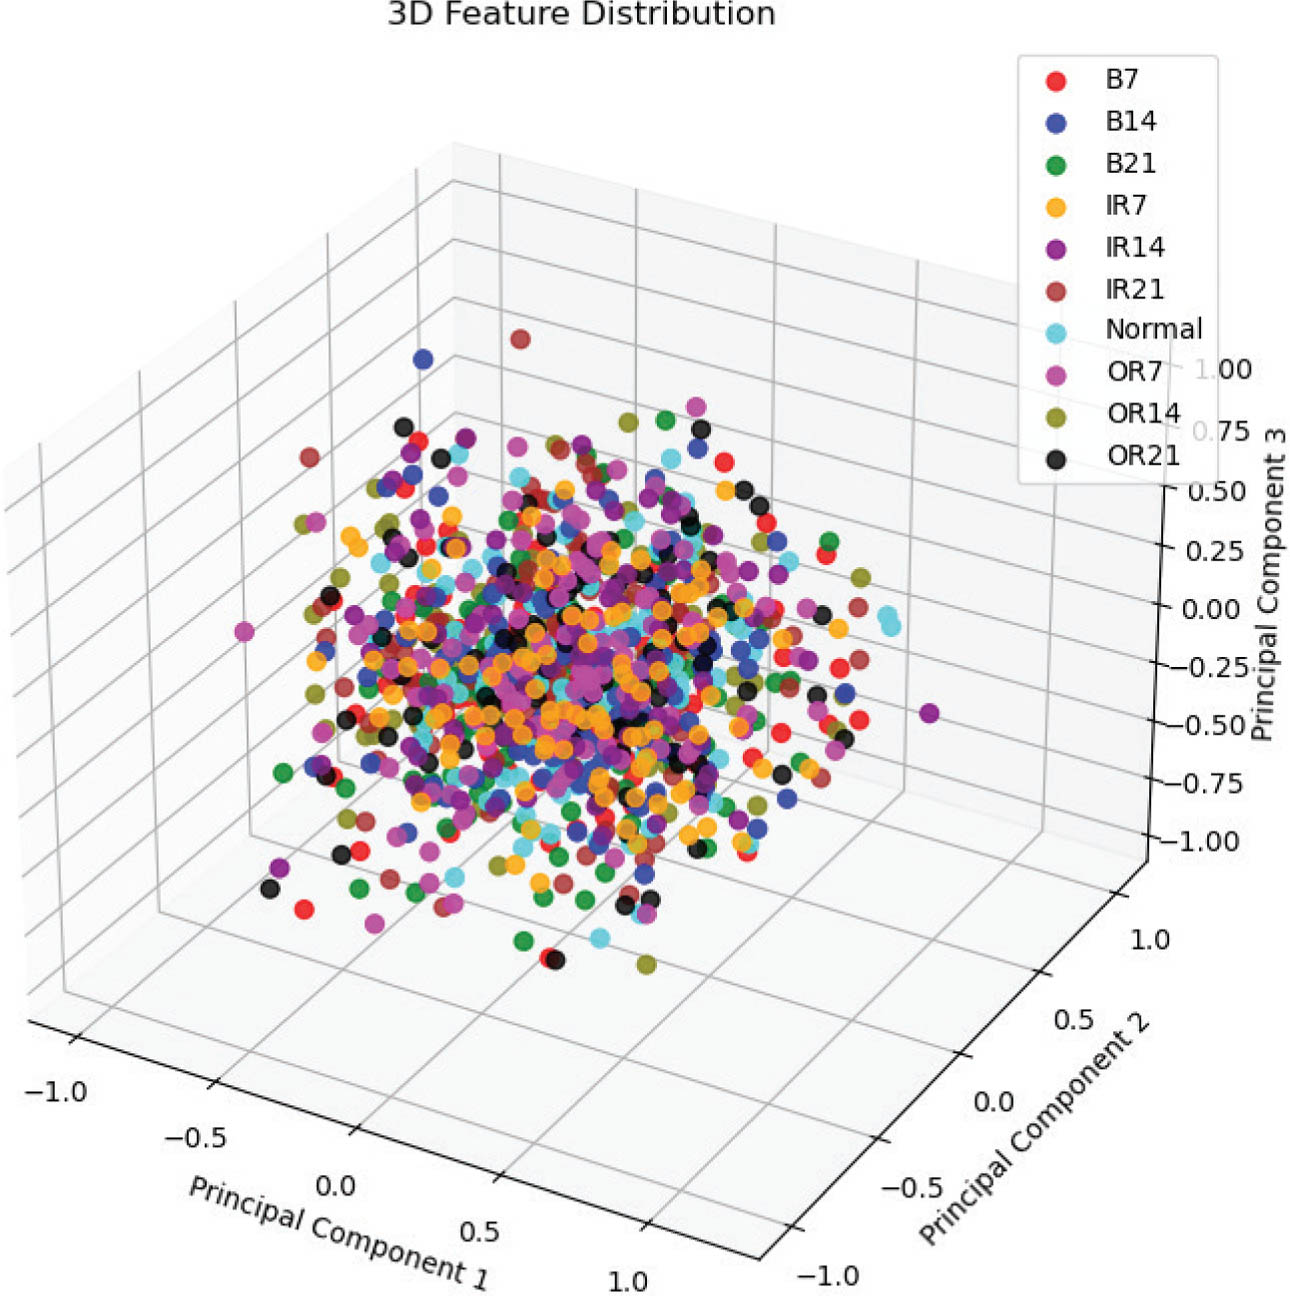
Figure 5:
3D visualization of the extracted hybrid feature space obtained using PCA dimensionality reduction, illustrating the separability of the 10 bearing fault categories.
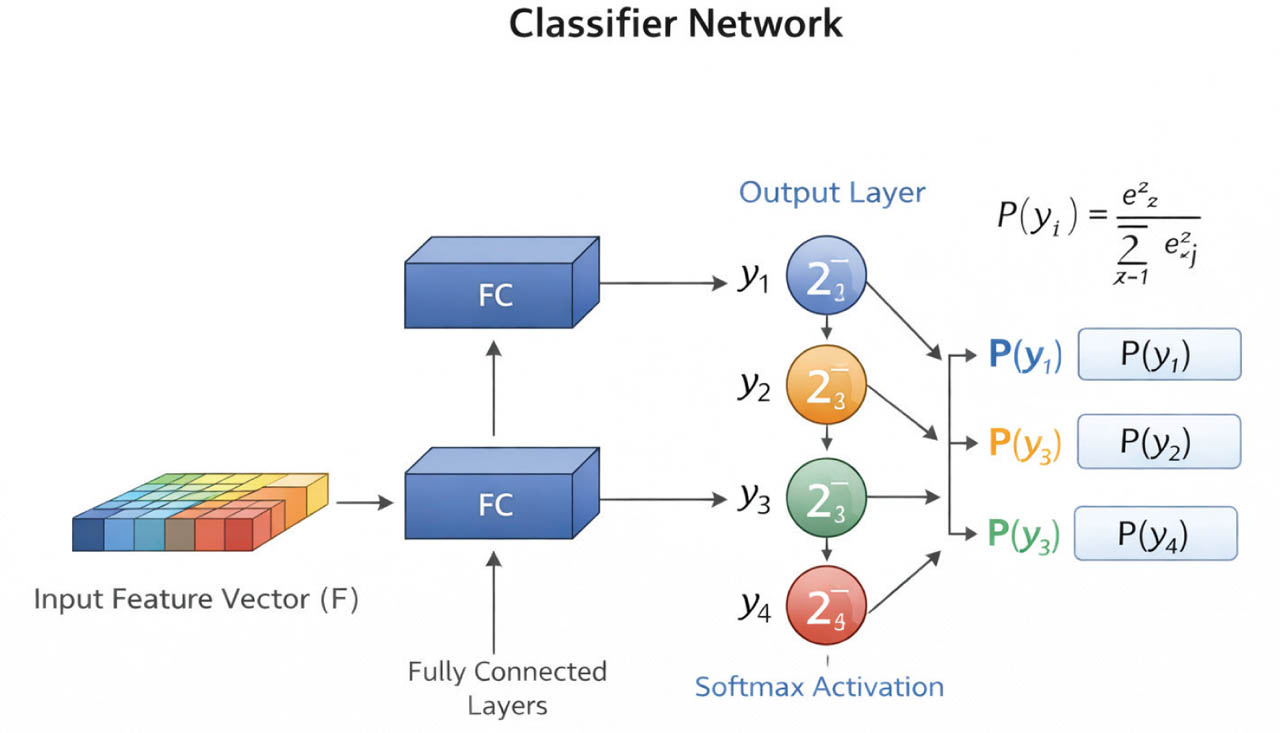
Figure 6:
The fault classifier network.
Table 2:
Initial configuration parameters and hyperparameter settings used in the proposed fault diagnosis framework, including signal segmentation parameters, CNN-transformer architecture settings, and classifier training configurations
| Parameter | Value used | Description |
|---|---|---|
| Sampling frequency | 48,000 Hz | Sampling rate used for vibration signal acquisition in the dataset |
| Segment length | 1,200 samples | Number of signal samples used in each segment |
| Number of segments per class | 318 | Total segments extracted from each bearing condition |
| Total classes | 10 | Number of bearing conditions (B7, B14, B21, IR7, IR14, IR21, Normal, OR7, OR14, OR21) |
| CNN input length | 1,200 | Length of the signal segment fed into the CNN |
| Transformer attention heads | 8 | Number of heads used in multi-head self-attention |
| Transformer layers | 2 | Number of stacked transformer encoder layers |
| Deep feature dimension | 200 | Output feature size from CNN-transformer feature extractor |
| Statistical features | 9 | Max, Min, Mean, Std, RMS, Skewness, Kurtosis, Crest Factor, Form Factor |
| Wavelet type | Haar | The mother wavelet used in the discrete wavelet transform |
| Wavelet decomposition level | 3 | Number of decomposition levels in DWT |
| Batch size | 32 | Number of samples processed per training batch |
| Training epochs | 400 | Total number of training iterations |
| Train-test split | 80%/20% | Dataset division for training and testing |
| Dropout rate (Layer 1) | 0.5 | Dropout applied after the first dense layer |
| Dropout rate (Layer 2) | 0.2 | Dropout applied after the second dense layer |
| Output layer neurons | 10 | Corresponds to the number of fault classes |
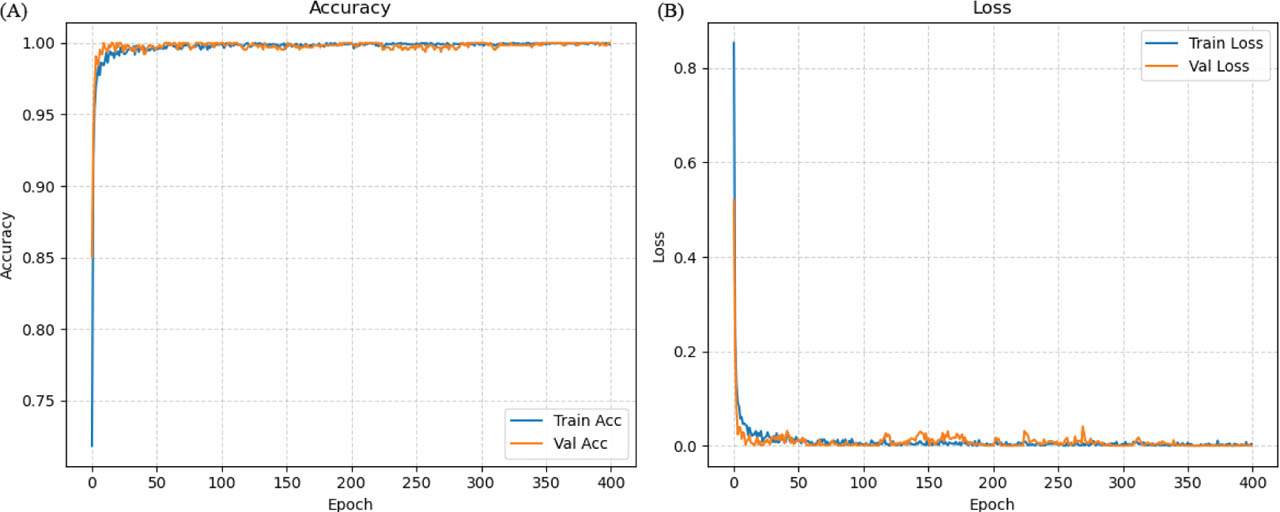
Figure 7:
Training performance of the proposed fault diagnosis model over 400 epochs, showing (A) training and validation accuracy curves and (B) training and validation loss curves, illustrating stable convergence and strong generalization capability.
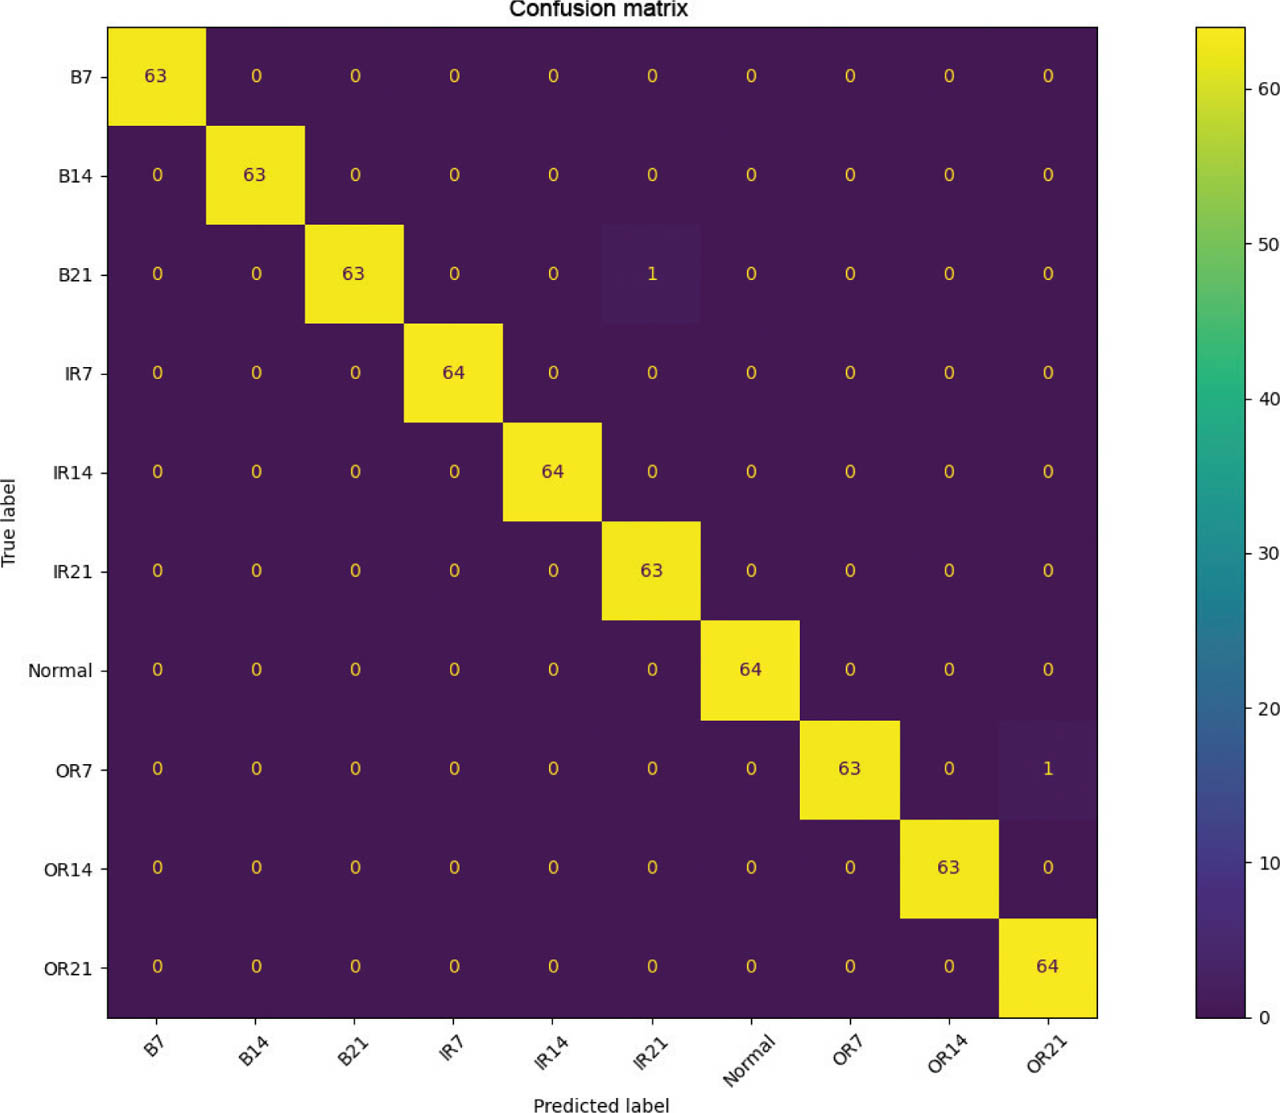
Figure 8:
Confusion matrix of the proposed CNN-transformer-based hybrid features fusion model for multi-class bearing fault diagnosis, showing the distribution of correctly and incorrectly classified samples across 10 fault categories. CNNs, convolutional neural networks.
Table 3:
Performance comparison between CNN-only and CNN + transformer-based feature extraction
| Model | Accuracy (%) | Precision (%) | Recall (%) | F1-score (%) |
|---|---|---|---|---|
| CNN-only | 96.12 | 95.84 | 95.67 | 95.80 |
| CNN + transformer | 99.98 | 99.68 | 99.68 | 99.80 |
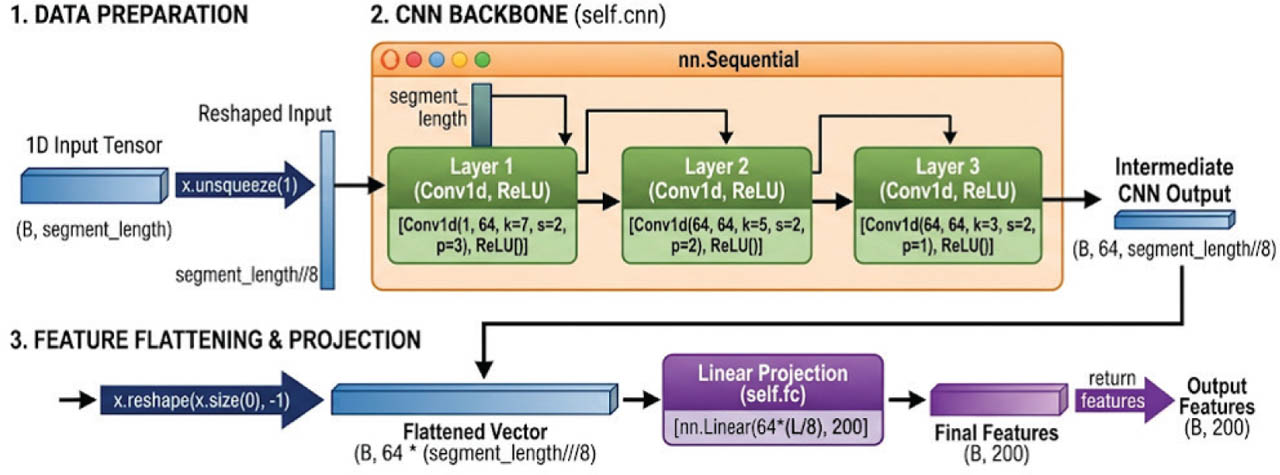
Figure 9:
Architecture of the CNN-only feature extractor module, illustrating the transformation of a 1D sequence into a fixed-size feature vector through successive convolutional downsampling and linear projection. 1D, one-dimensional; CNNs, convolutional neural networks.
Table 4:
Performance comparison of different wavelet functions for feature extraction in bearing fault diagnosis, showing classification accuracy and computational efficiency
| Wavelet | Accuracy (%) | Training Time | Interpretation |
|---|---|---|---|
| Haar (db1) | 99.98 | Low | Best performance, fastest computation |
| db4 | 98.3 | Medium | Good frequency localization, but lower accuracy |
| sym4 | 98.1 | Medium | Smooth wavelet, but slightly less effective here |
Table 5:
Comparative evaluation of optimization algorithms for training the proposed CNN-transformer model in terms of accuracy, convergence speed, and stability
| Optimizer | Accuracy | Convergence speed | Stability | Interpretation |
|---|---|---|---|---|
| RMSprop | 99.98% | Fast | High | Best overall performance |
| Adam | 98.1% | Fast | Medium | Good, but less stable here |
| AdamW | 98.2% | Medium | Medium | Regularized but slower convergence |
Table 6:
Ablation study evaluating the contribution of individual and combined feature sets (deep, statistical, and frequency-domain features) on classification performance using accuracy, precision, recall, and F1-score
| Feature Type | Accuracy (%) | Precision (%) | Recall (%) | F1-score (%) |
|---|---|---|---|---|
| Deep features (CNN only) | 94.23 | 94.68 | 93.54 | 94.10 |
| Statistical features only | 91.66 | 90.28 | 89.57 | 89.97 |
| Frequency features only | 93.66 | 95.89 | 95.89 | 95.89 |
| Deep + statistical | 96.22 | 97.0 | 96.98 | 97.03 |
| Deep + frequency | 97.10 | 96.30 | 96.30 | 96.30 |
| Statistical + frequency | 95.00 | 97.12 | 95.55 | 96.12 |
| All fused (proposed) | 99.98 | 99.68 | 99.68 | 99.80 |
Table 7:
Comparative performance analysis of the proposed bearing fault diagnosis framework with recent state-of-the-art methods on the CWRU dataset
| Reference | Model | Accuracy | Precision | Recall | F1-score |
|---|---|---|---|---|---|
| Yoo et al. [20] | Resnet50 (Lite CNN) | 99.97 | - | - | - |
| Mohiuddin et al. [21] | Modified AlexNet | 98.30 | 98.41 | 100 | 99.20 |
| Zhang et al. [22] | Convolutional spiking neural network | 99.83 | - | - | - |
| Lee et al. [23] | XGBoost + PSO | 99.10 | 99.3 | 99.2 | 99.1 |
| Hatipoglu et al. [24] | LSTM-Attention and LASSO | 98.50 | - | - | 98.742 |
| Khan et al. [25] | RNN-XGBoostNet | 99.57 | 99.54 | 99.21 | 99.37 |
| Proposed | FaultFormer-Net | 99.98 | 99.68 | 99.68 | 99.80 |