
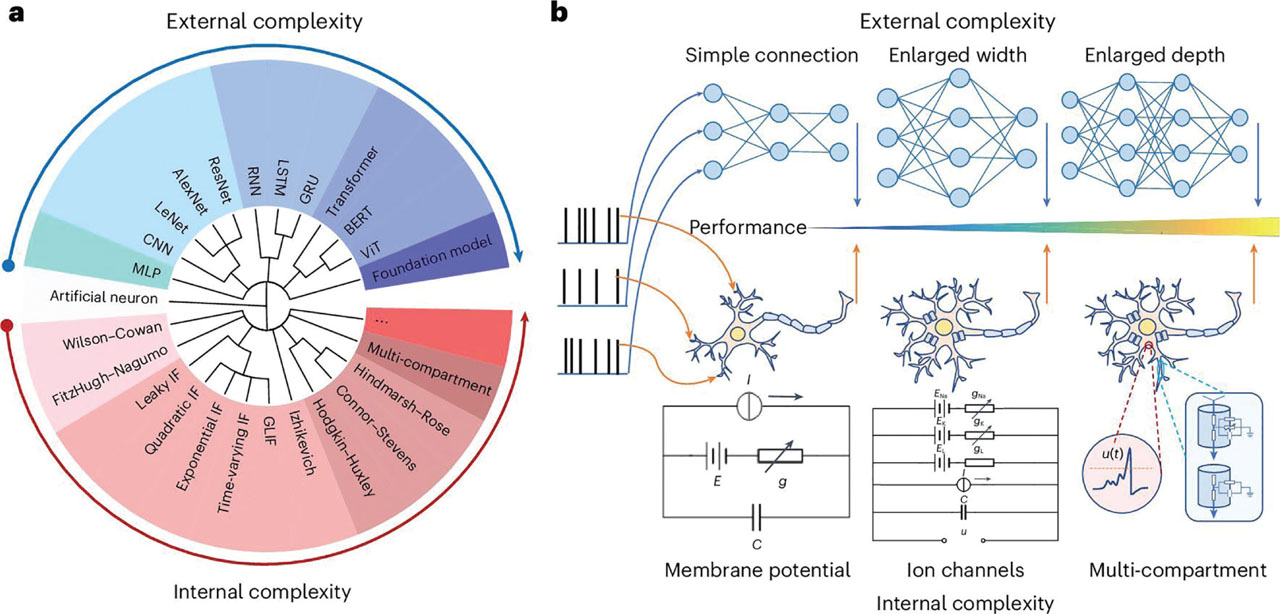
Figure 1:
(A) Conceptual relationship between AI and neuroscience through brain-inspired neural models. (B) Evolution of neural network architectures toward biologically inspired multi-compartment spiking neuron models. AI, artificial intelligence; LSTM, long short-term memory; RNN, recurrent neural network.
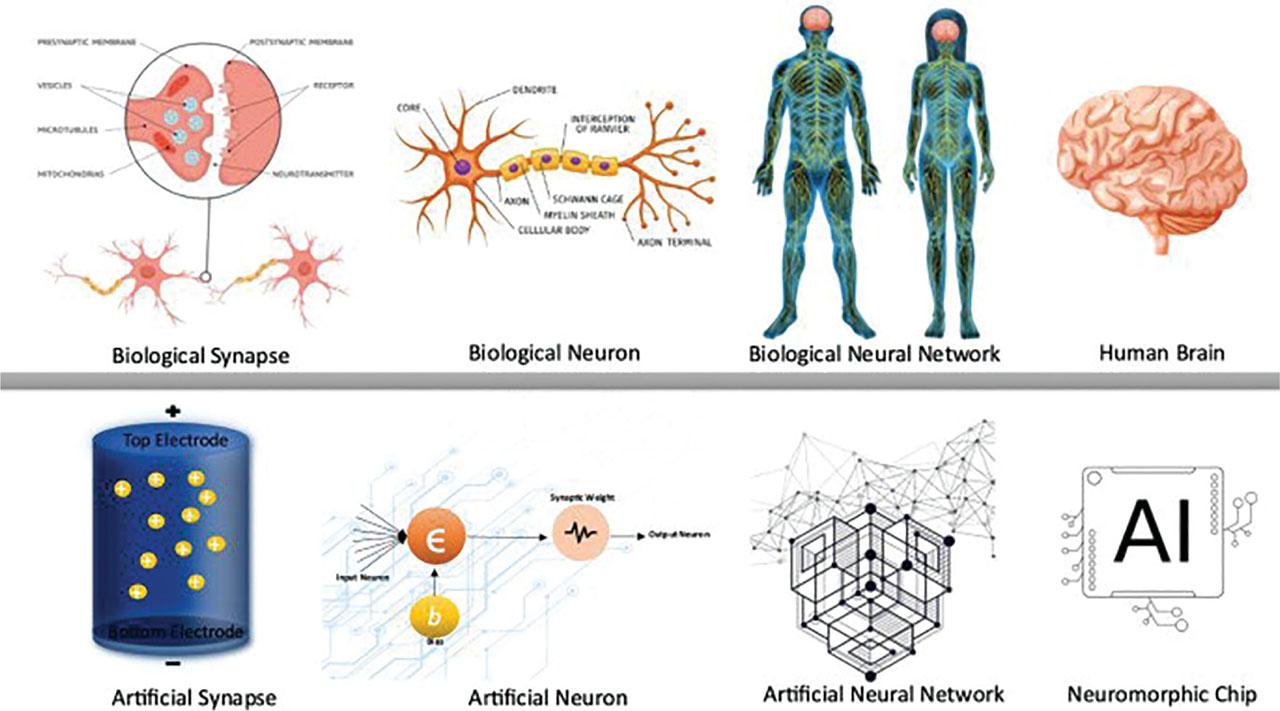
Figure 2:
Neuromorphic computing for modeling neurological and psychiatric disorders. AI, artificial intelligence.
Table 1:
Comparative analysis of neuromorphic hardware platforms
| Platform/technology | Operating principle | Advantages | Limitations |
|---|---|---|---|
| Intel Loihi [12] | Digital neuromorphic many-core processor with on-chip learning | Energy-efficient, adaptive learning, scalable architecture | Complex hardware integration |
| IBM TrueNorth [13] | Event-driven spike-based neuromorphic chip | Ultralow power inference, real-time processing | Limited online learning capability |
| RRAM crossbar arrays [15] | In-memory analog computation using memristive switching | Low latency, reduced memory bottleneck | Device variability and noise sensitivity |
| Organic electrochemical transistors [16] | Bio-inspired analog synaptic emulation | Flexible, biocompatible, low-voltage operation | Limited long-term stability |
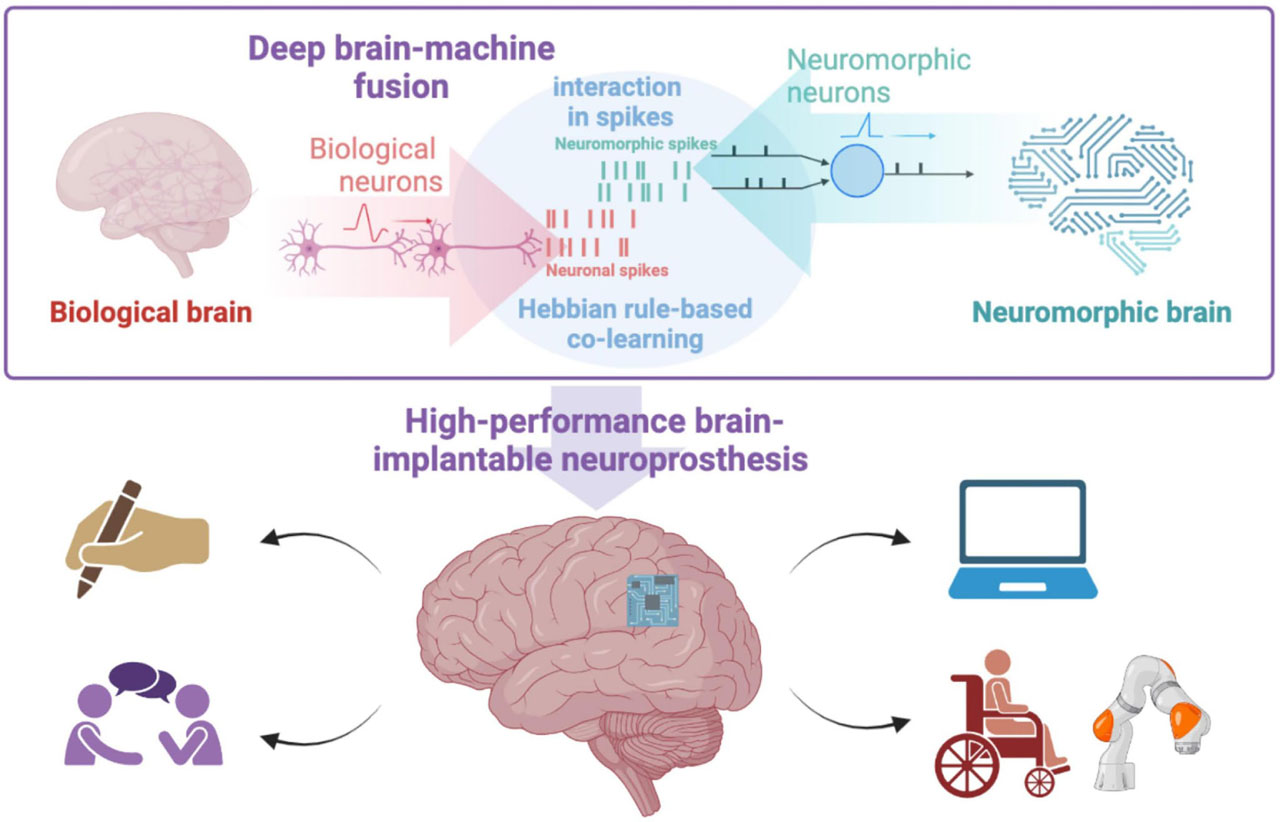
Figure 3:
Architecture of SNN and spike-based processing. SNN, spiking neural network.
Table 2:
Comparative performance of learning algorithms on the MNIST dataset
| Algorithm | Acc. (%) | Train time (s) | Memory (MB) | Precision (%) | Recall (%) |
|---|---|---|---|---|---|
| SNN | 92.5 | 150 | 128 | 92.1 | 92.9 |
| STDP | 89.3 | 180 | 140 | 88.4 | 89.5 |
| Hebbian learning | 90.1 | 200 | 120 | 89.8 | 90.4 |
| RNN | 93.2 | 220 | 200 | 93.0 | 93.4 |
Table 3:
Comparative performance of learning algorithms on the CIFAR-10 dataset
| Algorithm | Acc. (%) | Train time (s) | Memory (MB) | Precision (%) | Recall (%) |
|---|---|---|---|---|---|
| SNN | 80.0 | 350 | 200 | 78.5 | 79.2 |
| STDP | 75.5 | 400 | 210 | 74.8 | 75.3 |
| Hebbian Learning | 78.0 | 380 | 180 | 77.3 | 78.1 |
| RNN | 84.7 | 450 | 300 | 83.9 | 85.1 |
Table 4:
Comparative performance of learning algorithms on synthetic spike data
| Algorithm | Acc. (%) | Train time (s) | Memory (MB) | Precision (%) | Recall (%) |
|---|---|---|---|---|---|
| SNN | 92.0 | 180 | 150 | 91.5 | 92.3 |
| STDP | 85.4 | 210 | 160 | 74.8 | 75.3 |
| Hebbian learning | 80.5 | 190 | 130 | 79.7 | 80.9 |
| RNN | 88.2 | 240 | 250 | 87.5 | 88.9 |
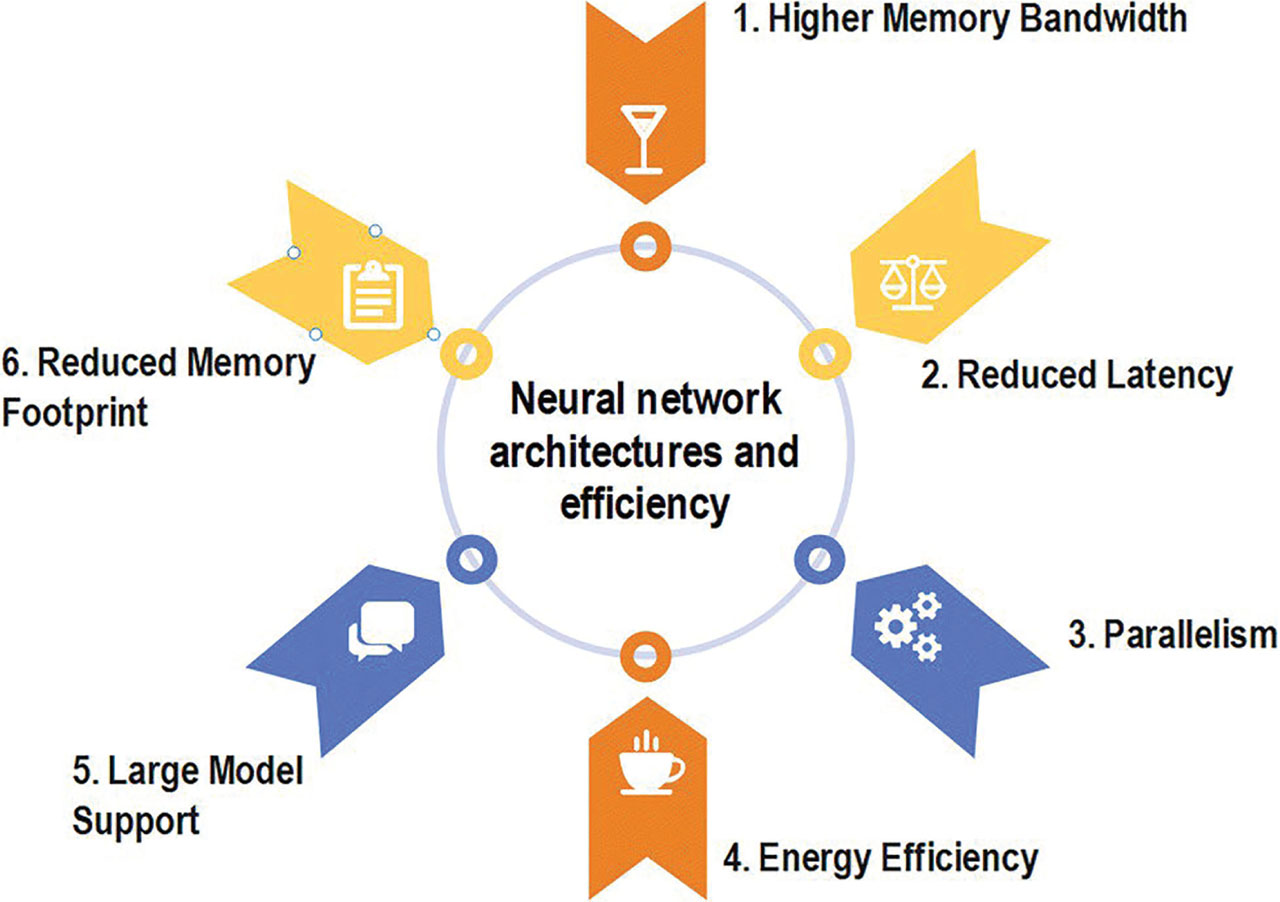
Figure 4:
Computing of neuromorphic materials.
Table 5:
Comparative accuracy analysis of proposed models with related studies
| Algorithm | Accuracy in the present study (%) | Reported accuracy in related studies (%) | Comment |
|---|---|---|---|
| SNN | 92.5 | 89.2 | Outperformed most traditional models |
| STDP | 89.3 | 87.1 | Comparable to existing |
| Hebbian learning | 90.1 | 88.5 | Slightly higher accuracy than prior studies |
| RNN | 93.2 | 91.6 | Strong performance |
Table 6:
Comparative analysis of conventional deep learning and neuromorphic architectures
| Feature | Conventional deep learning | Neuromorphic architecture |
|---|---|---|
| Learning method | Backpropagation | STDP/local learning |
| Data encoding | Continuous values | Spike-based timing |
| Energy consumption | High | Low |
| Biological plausibility | Moderate | High |
| Hardware platform | GPU/TPU | Neuromorphic chips |