
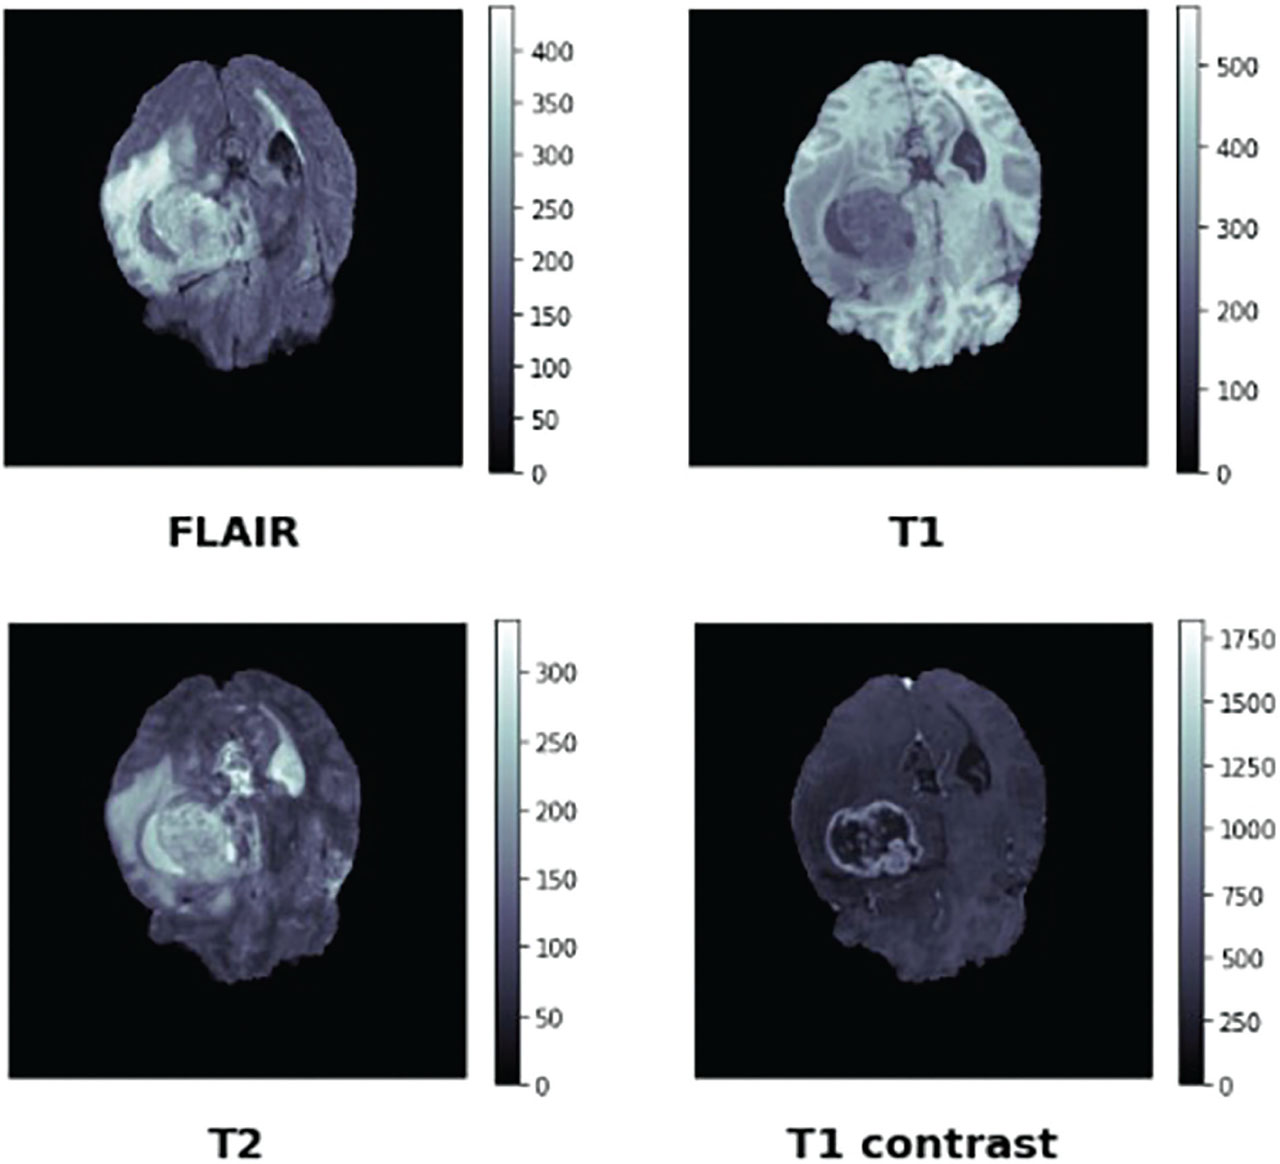
Figure 1:
BraTS 2020 dataset structure showing the multi-modal MRI sequences (T1, T1ce, T2, FLAIR) and ground truth segmentation labels for brain tumor cases. BraTS, brain tumor segmentation; MRI, magnetic resonance imaging.
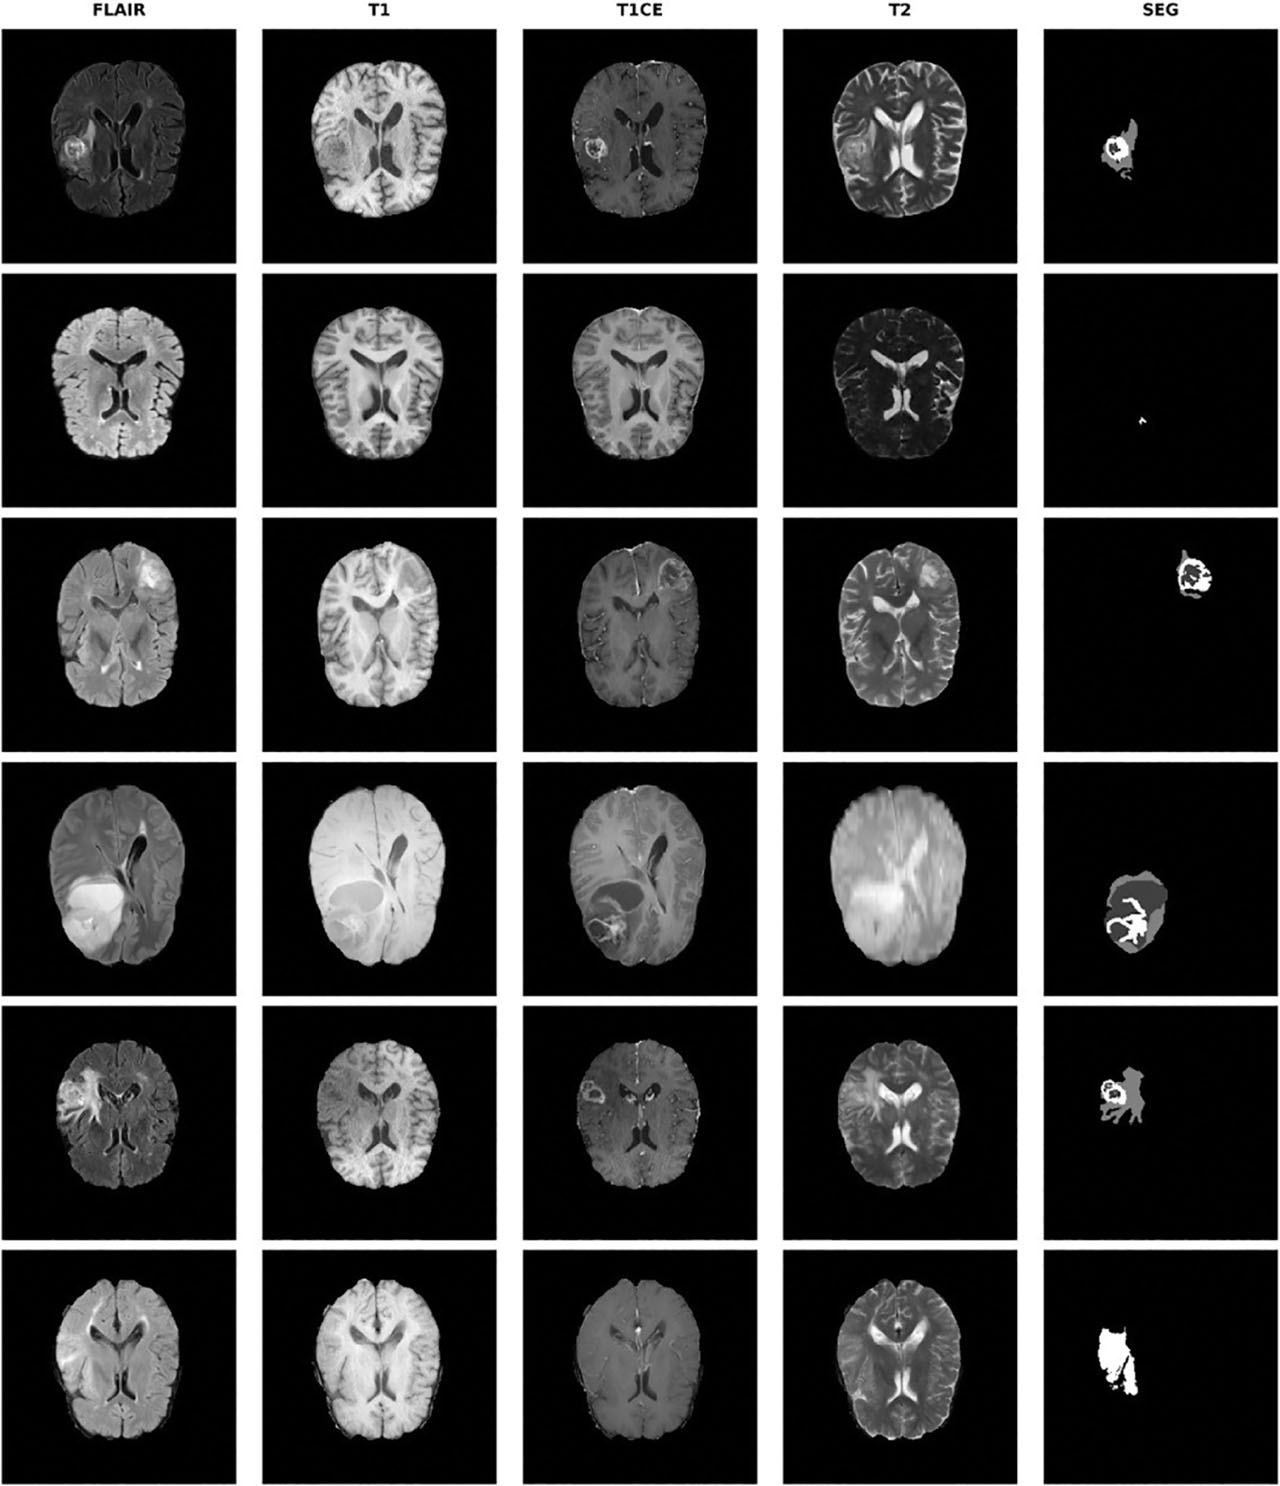
Figure 2:
Class distribution in the BraTS 2020 dataset illustrating the severe imbalance between background and tumor sub-regions. BraTS, brain tumor segmentation.
Table 1:
Validation ECE for different MC dropout weights in the combined uncertainty map.
| α | 0.5 | 0.6 | 0.7 | 0.8 | 0.9 | 1.0 |
|---|---|---|---|---|---|---|
| ECE | 0.0741 | 0.0703 | 0.0661 | 0.0679 | 0.0697 | 0.0718 |
[i] Note: Bold text indicates the optimal (lowest) validation Expected Calibration Error (ECE = 0.0661 at α = 0.7), establishing the selected weighting factor for the combined-uncertainty formulation in Eq. (14).
Table 2:
Loss-weighting sensitivity for L = λLDice + (1 − λ)LFocal.
| λ | Mean DSC↑ | NCR↑ | ET↑ | ECE↓ |
|---|---|---|---|---|
| 0.3 | 0.7691 | 0.6984 | 0.7801 | 0.0712 |
| 0.4 | 0.7754 | 0.7101 | 0.7912 | 0.0688 |
| 0.5 | 0.7812 | 0.7223 | 0.7987 | 0.0655 |
| 0.6 | 0.7798 | 0.7189 | 0.7941 | 0.0669 |
| 0.7 | 0.7761 | 0.7142 | 0.7889 | 0.0701 |
| 1.0 | 0.7703 | 0.7031 | 0.7812 | 0.0731 |
[i] Note: Bold text denotes the optimal configuration (λ = 0.5), which simultaneously achieves the highest Mean DSC, NCR Dice, and ET Dice, as well as the lowest ECE, confirming the equal-weight Dice/Focal loss retained for reported results (Eq. 17).
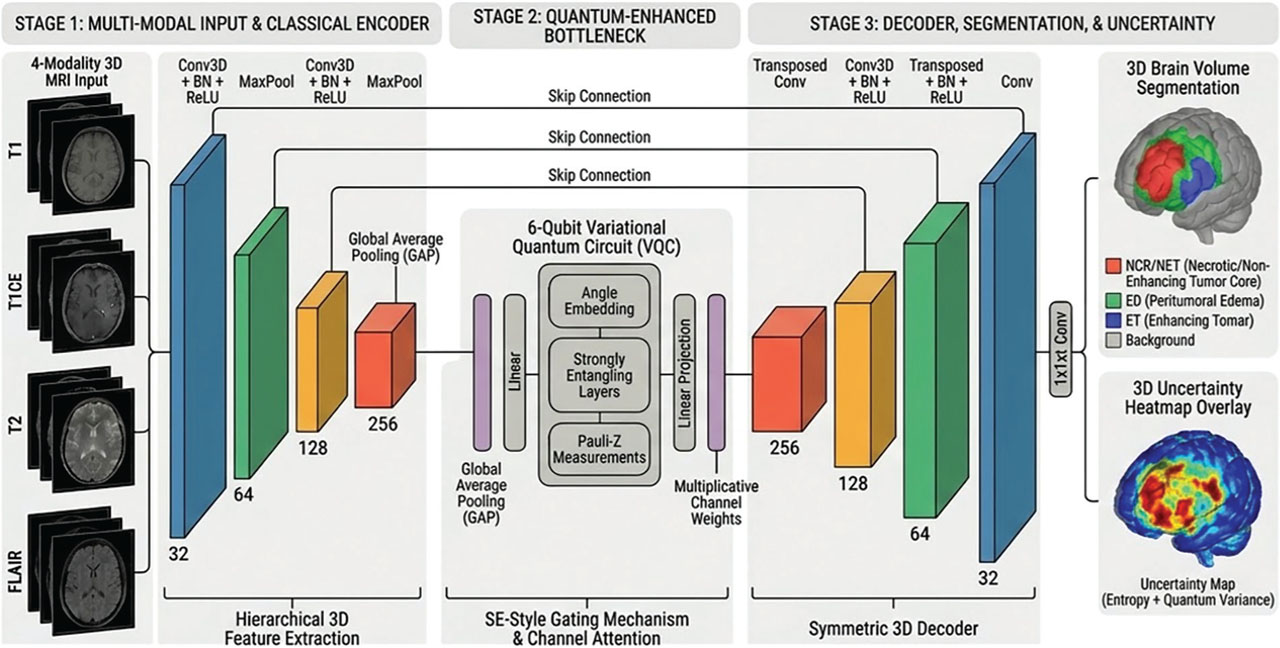
Figure 3:
Hybrid quantum-classical U-net architecture. The quantum SE module at the bottleneck recalibrates channel responses via a six-qubit VQC before the decoder reconstructs the segmentation map and uncertainty overlay. GAP, global average pooling; SE, squeeze-and-excitation; VQC, variational quantum circuit.
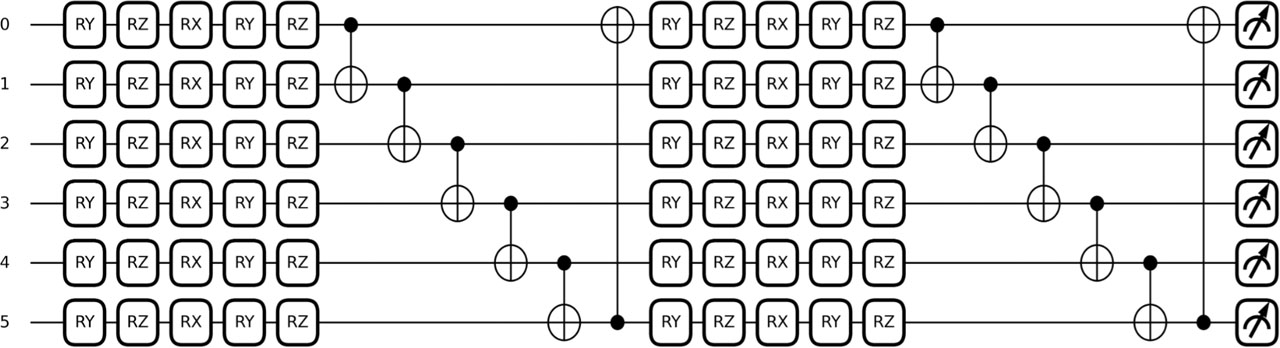
Figure 4:
VQC: layered RY/RZ rotations and CNOT entangling gates across six qubits over two variational layers. CNOT, controlled-NOT; RY/RZ, rotation gates about the Y-axis and Z-axis of the Bloch sphere; VQC, variational quantum circuit.
Table 3:
Single forward-pass runtime breakdown for one input volume, averaged over 100 runs.
| Component | Time (ms) | Share (%) |
|---|---|---|
| Classical encoder and bottleneck conv | 38.2 | 57.0 |
| Quantum VQC simulation | 12.4 | 18.5 |
| CPU to GPU attention transfer | 4.1 | 6.1 |
| Classical decoder | 10.8 | 16.1 |
| Output projection and softmax | 1.5 | 2.2 |
| Total single pass | 67.0 | 100 |
| Classical SE block only | 0.3 | – |
Table 4:
Training-time overhead compared with classical baselines.
| Model | Time/epoch (min) | Total time (hr) |
|---|---|---|
| Classical 3D U-Net | 14.2 | 16.6 |
| Classical SE block | 14.4 | 16.8 |
| Hybrid quantum U-Net | 21.3 | 24.9 |
Table 5:
Qubit-count ablation on the validation split.
| Qubits | Params | Val DSC↑ | Val ECE↓ | Time/pass (ms) |
|---|---|---|---|---|
| 4 | 24 | 0.7701 | 0.0748 | 8.1 |
| 6 | 36 | 0.7812 | 0.0655 | 12.4 |
| 8 | 48 | 0.7839 | 0.0641 | 17.3 |
| 10 | 60 | 0.7831 | 0.0638 | 25.9 |
[i] Note: Bold text highlights column-best values (Val DSC = 0.7839, Val ECE = 0.0638 at 8 qubits). The 6-qubit setup was selected for the final model as it represents the optimal performance-versus-simulation-cost trade-off, avoiding the ~40% per-pass runtime increase of 8 qubits. ↑ indicates higher is better; ↓ indicates lower is better.
Table 6:
Parameter-matched attention comparison.
| Model | Mean DSC↑ | NCR↑ | ECE↓ |
|---|---|---|---|
| Classical 3D U-Net | 0.7589 | 0.6890 | 0.0877 |
| Minimal linear attention (36 params) | 0.7601 | 0.6912 | 0.0862 |
| Classical SE block (3,334 params) | 0.7768 | 0.6985 | 0.0831 |
| Hybrid quantum U-Net (36 params) | 0.7812 | 0.7223 | 0.0655 |
Table 7:
Internal comparison of all nine model variants on the held-out brats 2020 test split (with TTA and adaptive thresholding)
| Model | Arch | Mean↑ | NCR↑ | ED↑ | ET↑ | HD95 NCR↓ | HD95 ET↓ | ECE↓ |
|---|---|---|---|---|---|---|---|---|
| Hybrid quantum U-Net (proposed) | HybridQ | 0.7812 | 0.7233 | 0.8210 | 0.7987 | 23.87 | 10.47 | 0.0655 |
| Classical attention U-Net + deep supervision | AttUNet | 0.7812 | 0.6942 | 0.8244 | 0.8249 | 44.1 | 16.7 | 0.0818 |
| Classical UNet++ | UNet++ | 0.7748 | 0.7187 | 0.8137 | 0.7921 | 24.1 | 17.3 | 0.0850 |
| Hybrid quantum U-Net, 1283 CosineWarmRestarts | HybridQ | 0.7745 | 0.7297 | 0.8022 | 0.7916 | 18.1 | 17.8 | 0.0728 |
| Hybrid quantum U-Net, 963 CosineWarmRestarts Run 2 | HybridQ | 0.7723 | 0.7141 | 0.8137 | 0.7890 | 18.2 | 17.7 | 0.0716 |
| Hybrid quantum U-Net, 963 CosineWarmRestarts Run 1 | HybridQ | 0.7705 | 0.7224 | 0.8137 | 0.7754 | 24.2 | 24.9 | 0.0775 |
| Classical 3D U-Net Baseline | PlainUNet | 0.7589 | 0.6890 | 0.8127 | 0.7750 | 44.3 | 25.3 | 0.0877 |
| Hybrid quantum U-Net, MONAI augmentation | HybridQ | 0.7132 | 0.5975 | 0.7714 | 0.7705 | 71.7 | 18.1 | 0.1547 |
| Hybrid quantum U-Net, LR decay | HybridQ | 0.6845 | 0.5627 | 0.7401 | 0.7508 | 59.4 | 19.2 | 0.2352 |
Table 8:
Architecture comparison across methods and datasets
| Method | Dataset | Mean↑ | NCR↑ | ED↑ | ET↑ |
|---|---|---|---|---|---|
| ME-Net [17]† | BraTS 2020 | 0.7746 | 0.7025 | 0.8827 | 0.7386 |
| HybridCSF [18] | BraTS 2020 | 0.7700 | 0.8100 | 0.8700 | 0.6300 |
| nnU-Net [21]‡ | BraTS-PEDs | 0.7767 | 0.6600 | 0.9000 | 0.7700 |
| Ensemble (nnU-Net + SwinUNETR) [19] | BraTS 2023 PED | 0.7627 | 0.8090 | 0.8260 | 0.6530 |
| SegResNet + Attn [20]‡ | BraTS-PEDs 2023 | 0.7133 | 0.6900 | 0.8500 | 0.6000 |
| Hybrid quantum U-Net (proposed) | BraTS 2020 | 0.7812 | 0.7233 | 0.8210 | 0.7987 |
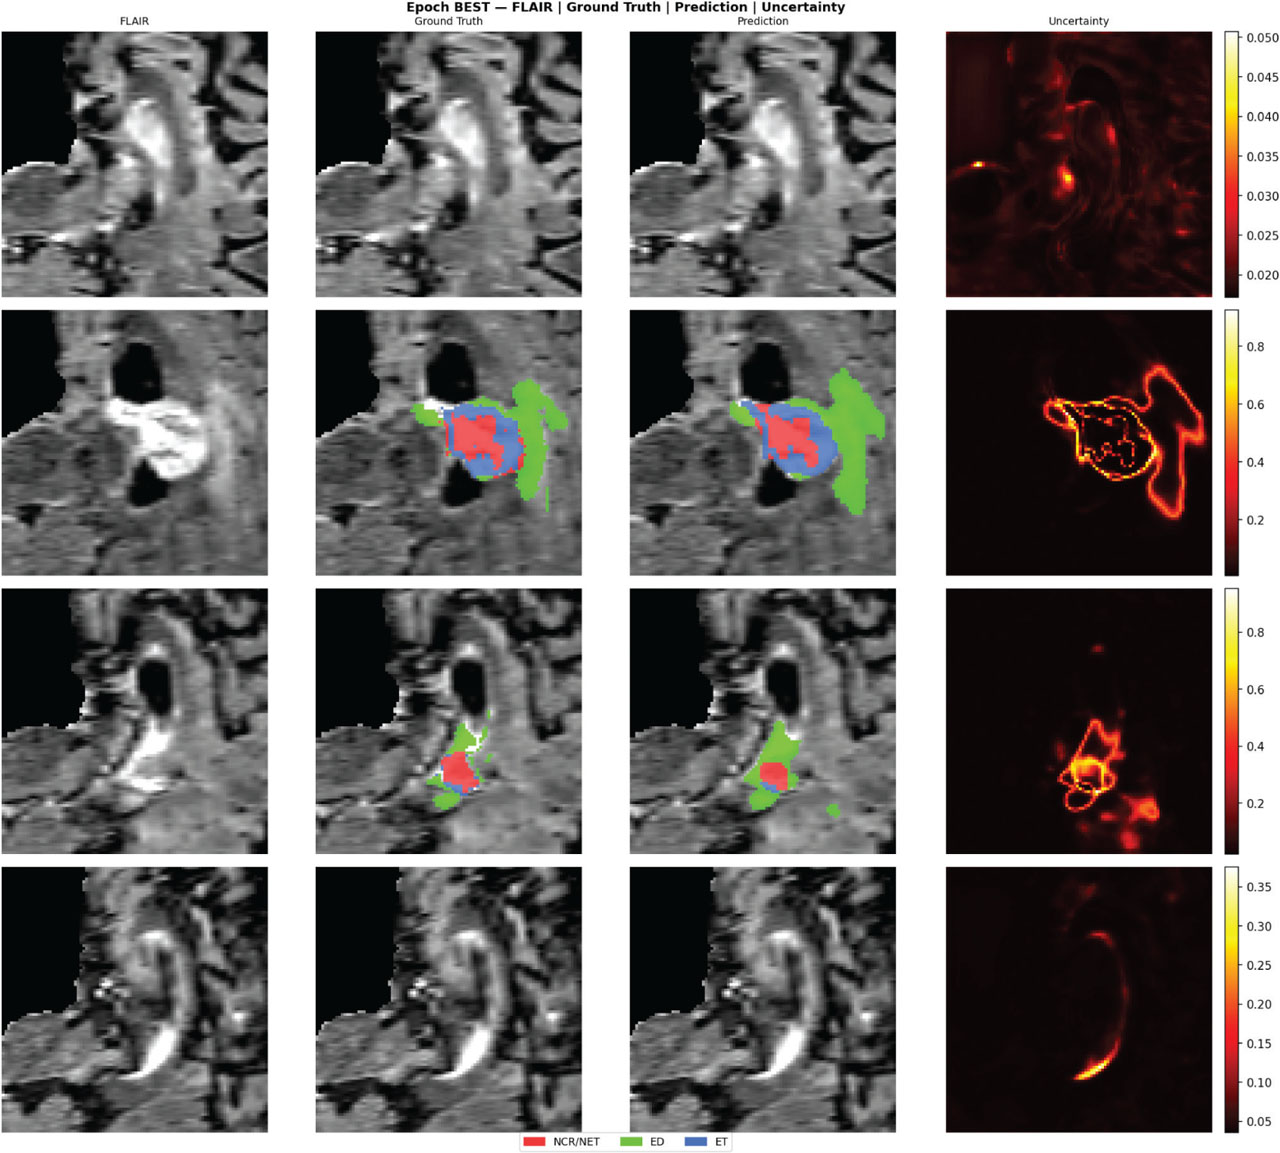
Figure 5:
Outcomes from segmentation in four validation cases. Columns: FLAIR image (input), ground truth, prediction, and uncertainty (combined) on both MC dropout and quantum variance. Tumor margins having highest level of uncertainty, where the model is most uncertain. MC, Monte Carlo.
Table 9:
Individual and combined uncertainty-source performance
| Source | Val ECE↓ | Boundary AUC↑ |
|---|---|---|
| MC dropout only | 0.0718 | 0.762 |
| Quantum variance only | 0.1031 | 0.694 |
| Combined uncertainty | 0.0655 | 0.801 |
[i] Note: Bold text marks the best calibration and boundary-error detection (Combined Uncertainty, Val ECE = 0.0655, Boundary AUC = 0.801), verifying that fusing MC-Dropout entropy with quantum measurement variance outperforms individual uncertainty sources. ↑ indicates higher is better; ↓ indicates lower is better.