
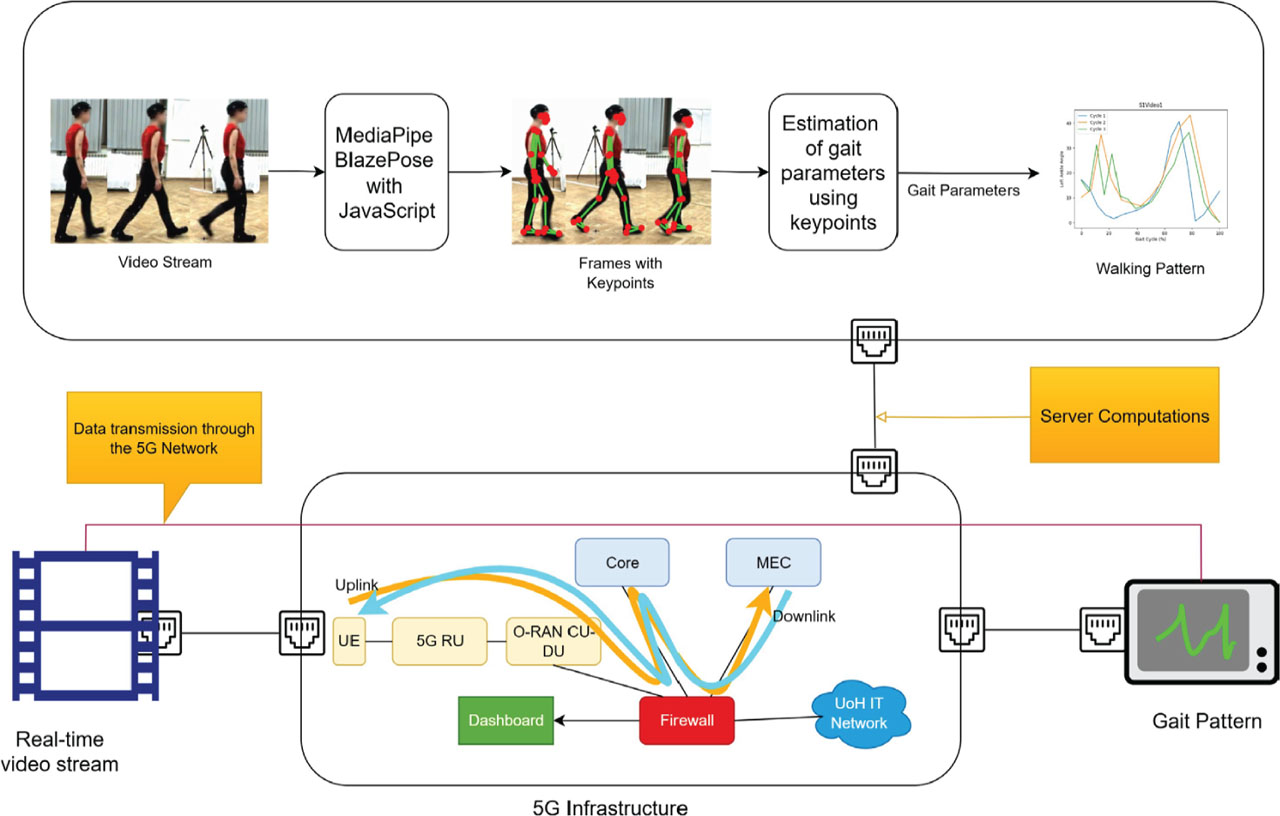
Figure 1:
Processing pipeline of the developed system. UE, user equipment.
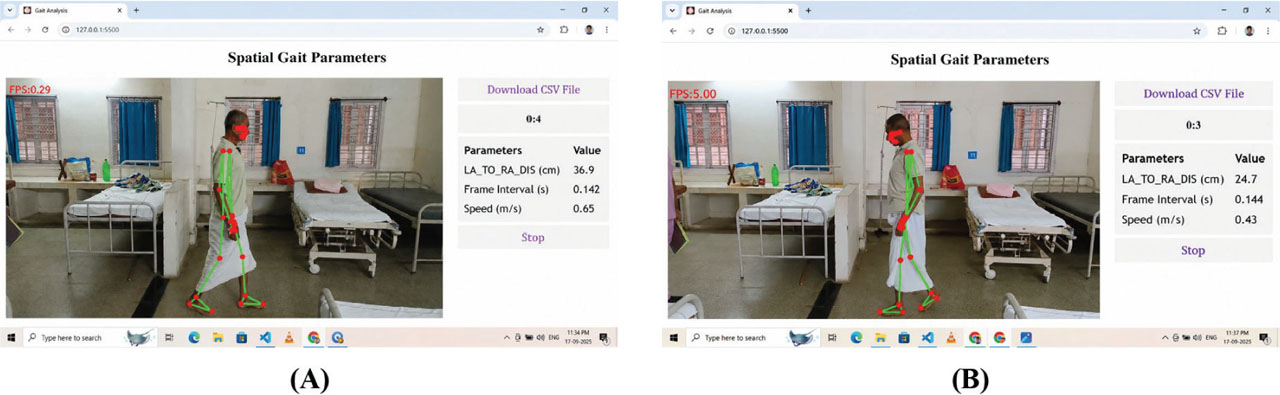
Figure 2:
Real-time elderly patient data collection in a hospital environment, (A) left-to-right. (B) right-to-left walking.
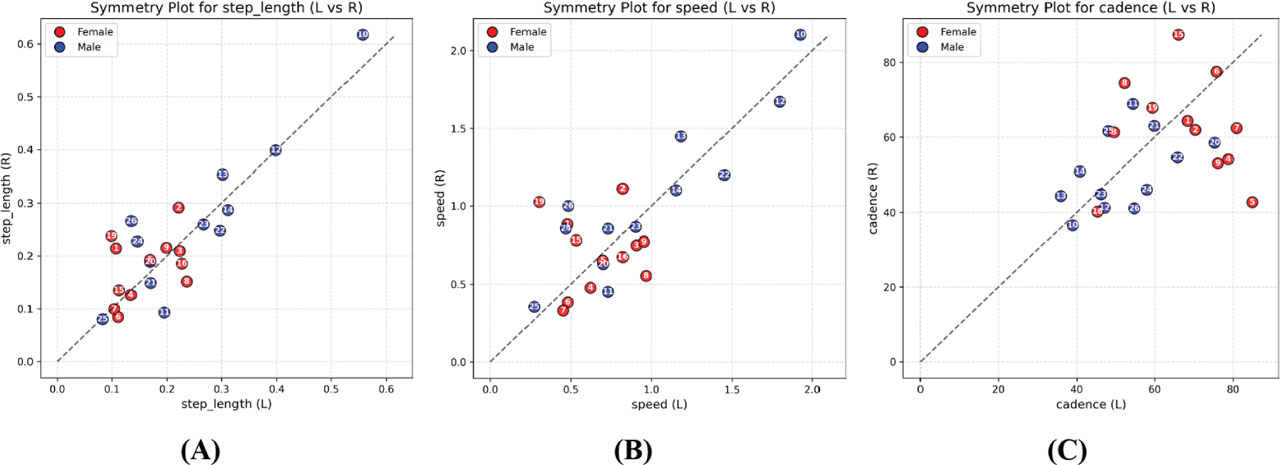
Figure 3:
Symmetry plots for spatiotemporal gait parameters of 26 elderly patients. (A) Symmetry plot for step length (Left vs Right); (B) Symmetry plot for speed (Left vs Right); (C) Symmetry plot for Cadence (Left vs Right).
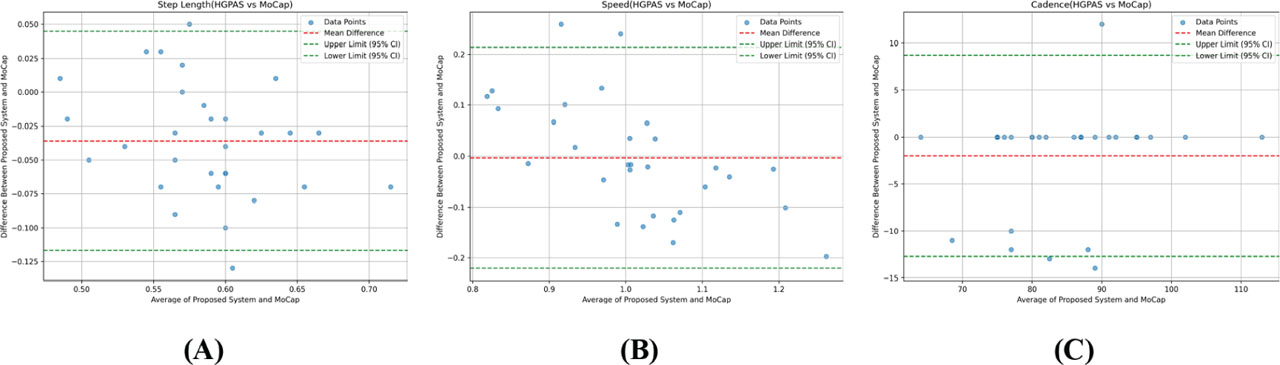
Figure 4:
Bland–Altman plots comparing the proposed gait parameter estimation method with reference measurements [27]. The figures illustrate the agreement between the two methods along with the mean bias and 95% limits of agreement. (A) Step Length (HGPAS vs MoCap); (B) Speed (HGPAS vs MoCap); (C) Cadence (HGPAS vs MoCap). HGPAS, human gait pattern analysis system; MoCap, motion capture.

Figure 5:
Deployed HGPAS on 5G-MEC server: Real-time execution (A) Before clicking the start button (B) after clicking the stop button. HGPAS: human gait pattern analysis system.

Figure 6:
Flow graph: Network messages from a UE connecting to a 5G (NR) network. UE, user equipment.