
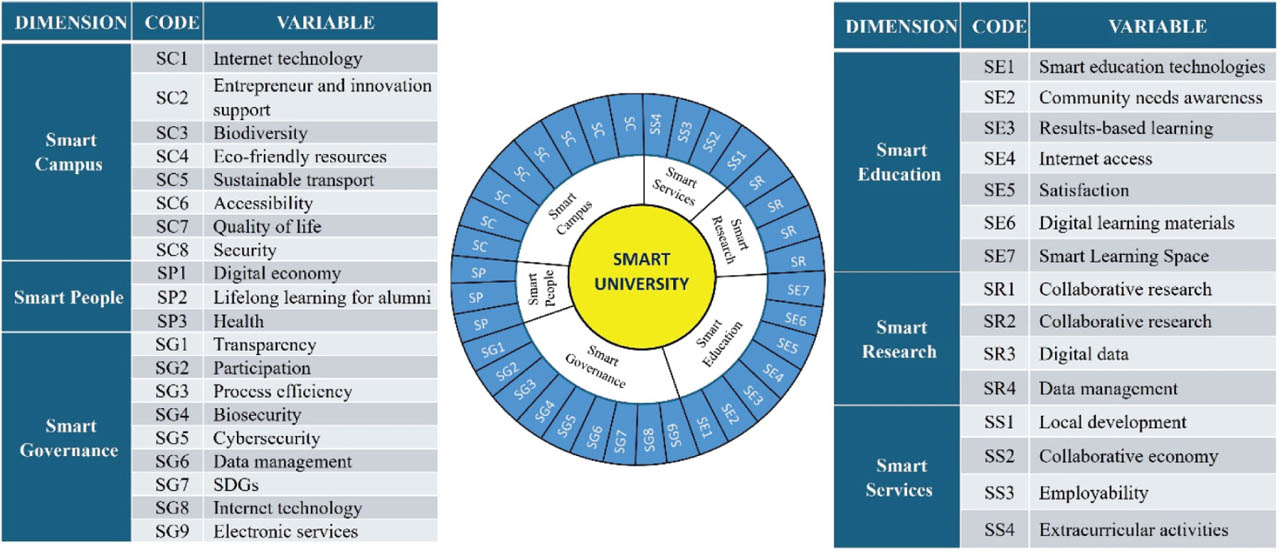
Figure 1:
A proposed framework for a smart sustainable campus. This was constructed based on current conditions at VU and adapted from [31, 32]. SC, smart campus; SE, smart education; SG, smart governance; SP, smart people; SR, smart research; SS, smart services; VU, Vinh University.
Table 1:
The smart-university dimensions, indicators, and variables for VU
| Dimensions | Indicators | Variables |
|---|---|---|
| SC | Our campuses use Internet technologies, such as the IoT. | Internet technology |
| Our campuses support business ideas through entrepreneurship centers, innovation centers, entrepreneur incubators, specialized centers, etc. | Entrepreneur and innovation support | |
| On our campuses, a protection program is available to manage biodiversity. | Biodiversity | |
| Our campus uses bioenergy and smart technologies to manage energy and resources, such as automatic lighting. | Eco-friendly resources | |
| VU encourages the use of low-carbon transport modes such as bicycles and electronic bikes. | Sustainable transport | |
| VU's main campus has wheelchair ramps for people with disabilities. | Accessibility | |
| VU has enough entertainment space and services to improve the users’ quality of life. | Quality of life | |
| VU has several security systems to ensure safety within the campuses (smart cameras, warning sensors, first aid, exit systems, and so on). | Security | |
| SP | All curriculums integrate modules to support learners in adapting to the challenges of the digital economy. | Digital economy |
| VU has lifelong learning support programs for alumni (including training, retraining, etc.). | Lifelong learning for alumni | |
| VU has healthcare programs for staff and learners. | Health | |
| SG | VU publishes an accountability program annually. | Transparency |
| VU implements strategic plans with the participation of stakeholders. | Participation | |
| VU has an online management platform. | Process efficiency | |
| Our campuses have biosafety protocols such as laboratory fume hoods, laboratory waste treatment systems, and systems/equipment/means to prevent the spread of diseases. | Biosecurity | |
| VU has a virtualized security system to prevent cyber-attacks. | Cybersecurity | |
| VU has a data management system with connectivity and sharing capabilities. | Data management | |
| VU develops actions toward the SDGs. | SDGs | |
| VU has systems such as webpages to offer and manage services to its stakeholders. | Internet technology | |
| Electronic transactions, such as paying university fees or making payments in stores, are available on campuses. | Electronic services | |
| SE | VU uses smart technologies for teaching, such as cloud computing, IoT, IA, and big data. | SE technologies |
| VU consults the community about its educational needs (e.g., course availability). | Community needs awareness | |
| VU utilizes results-based learning as the primary teaching methodology. | Results-based learning | |
| VU has an open and available internet bandwidth for all. | Internet access | |
| VU carries varying surveys frequently to identify the satisfaction level of students and staff. | Satisfaction | |
| VU has a system of digital learning resources to support learning needs. | Digital learning materials | |
| Smart learning space, such as an area for group activities (there are small rooms for 4–6 people and large rooms (15–20 people), self-study areas (where they ensure quiet surroundings, and have water purifiers to provide good drinking water to the students), and fast-food preparation areas, equipped with microwaves, washing areas, and so on. | Smart learning space | |
| SR | VU has cooperative connections with national scientists. | Collaborative research |
| VU has cooperative connections with international scientists for academic exchanges and sharing academic work. | Collaborative research | |
| VU has a digital data system to meet scientific research demands. | Digital data | |
| VU has a data management system to meet scientific research demands. | Data management | |
| SS | VU supports local economic development with community-oriented projects and actions. | Local development |
| VU has collaborative economy networks for sharing economic activities. | Collaborative economy | |
| VU has an employment support center. | Employability | |
| VU has extracurricular activities for the community. | Extracurricular activities |
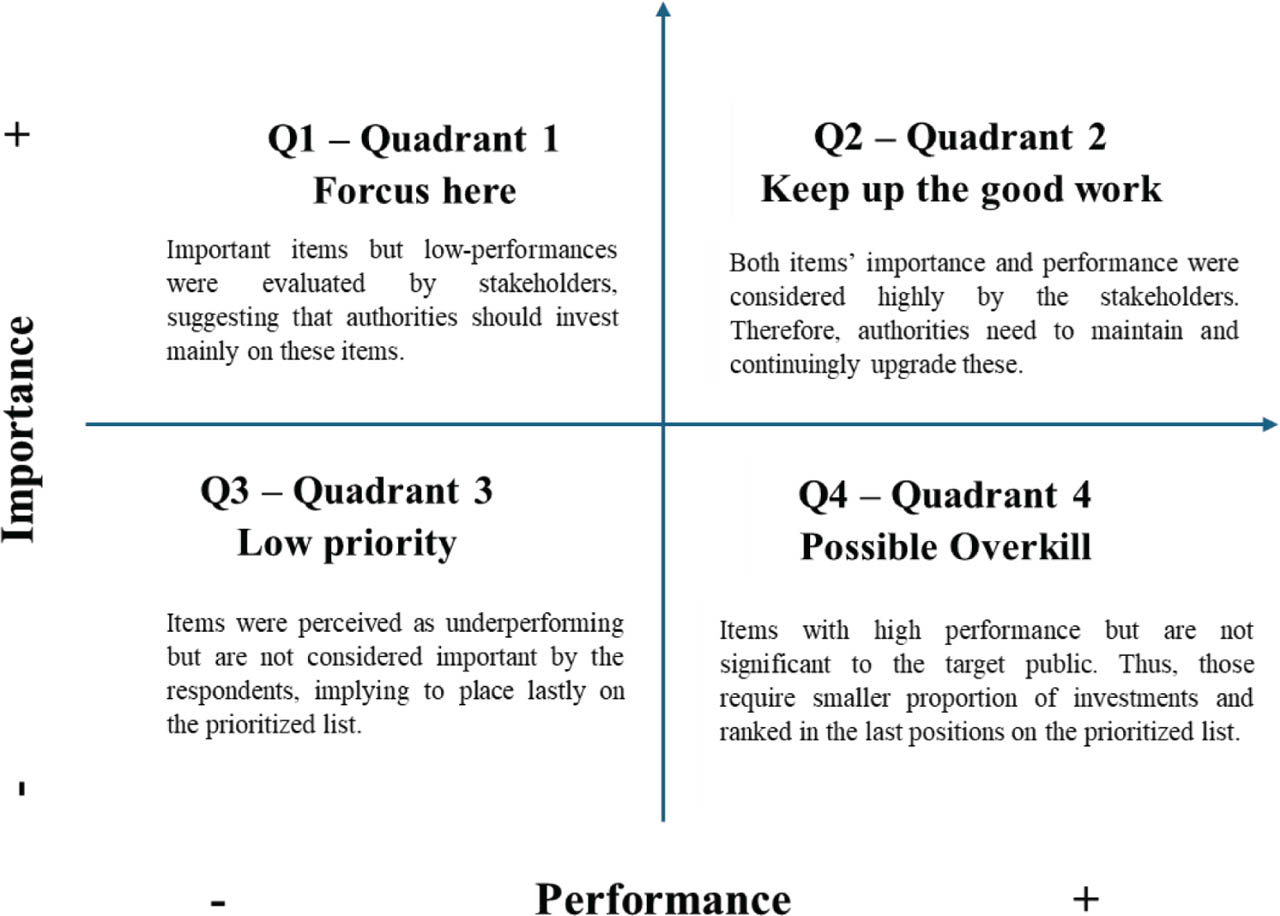
Figure 2:
IPA matrix. Contents of this figure were adapted from [32]. IPA, importance-performance analysis.
Table 2:
Demographic profile of respondents
| Characteristic | Number of respondents | Percentage (%) |
|---|---|---|
| Sex | ||
| Female | 199 | 52 |
| Male | 182 | 48 |
| Age | ||
| Between 18 and 30 years old | 270 | 70.9 |
| Between 31 and 40 years old | 51 | 13.4 |
| Between 41 and 50 years old | 54 | 14 |
| Between 51 and 60 years old | 5 | 1.3 |
| More than 60 years old | 1 | 0.4 |
| Stakeholders | ||
| Administrators | 17 | 4.5 |
| Lecturers | 57 | 15 |
| Administrative officers, specialists, technicians | 17 | 4.5 |
| Learners | 259 | 68 |
| Alumni | 15 | 3.9 |
| Employers | 16 | 4.2 |
Table 3:
Dimensions statistics
| Ranking | Importance | Performance | Gap | |||||||
|---|---|---|---|---|---|---|---|---|---|---|
| Dimension | Mean | SD | Alpha | Dimension | Mean | SD | Alpha | Dimension | I-P | |
| 1 | SG | 3.31 | 1.17 | 0.97 | SS_P | 2.99 | 1.09 | 0.94 | SE | 0.29 |
| 2 | SS | 3.28 | 1.20 | 0.95 | SE_P | 2.98 | 1.03 | 0.95 | SS | 0.29 |
| 3 | SE | 3.27 | 1.20 | 0.97 | SG_P | 2.97 | 1.01 | 0.96 | SG | 0.34 |
| 4 | SR | 3.27 | 1.23 | 0.95 | SR_P | 2.92 | 1.08 | 0.93 | SR | 0.35 |
| 5 | SP | 3.21 | 1.19 | 0.92 | SP_P | 2.84 | 1.06 | 0.87 | SP | 0.37 |
| 6 | SC | 3.20 | 1.16 | 0.96 | SC_P | 2.75 | 0.88 | 0.89 | SC | 0.45 |
| - | Total | 3.26 | 1.19 | 0.95 | Total | 2.91 | 1.03 | 0.92 | Total | 0.35 |
Table 4:
IPA results
| Variables | Importance | Performance | Gap | ||||||
|---|---|---|---|---|---|---|---|---|---|
| Code | Mean | SD | Rank | Mean | SD | Rank | I-P | Rank | |
| Internet technology | SC1 | 3.12 | 1.36 | 32 | 2.64 | 1.22 | 33 | 0.48 | 33 |
| Entrepreneur and innovation support | SC2 | 3.14 | 1.28 | 30 | 2.8 | 1.08 | 30 | 0.34 | 17 |
| Biodiversity | SC3 | 3.23 | 1.25 | 27 | 2.81 | 1.15 | 29 | 0.42 | 31 |
| Eco-friendly resources | SC4 | 3.08 | 1.31 | 34 | 2.46 | 1.13 | 34 | 0.62 | 34 |
| Sustainable transport | SC5 | 3.12 | 1.32 | 33 | 2.43 | 1.17 | 35 | 0.69 | 35 |
| Accessibility | SC6 | 3.24 | 1.33 | 23 | 2.87 | 1.14 | 27 | 0.37 | 23 |
| Quality of life | SC7 | 3.29 | 1.33 | 15 | 2.92 | 1.19 | 21 | 0.37 | 23 |
| Security | SC8 | 3.34 | 1.32 | 4 | 3.05 | 1.21 | 6 | 0.29 | 9 |
| SE technologies | SE1 | 3.03 | 1.38 | 35 | 2.71 | 1.22 | 32 | 0.32 | 15 |
| Community–based awareness | SE2 | 3.23 | 1.25 | 24 | 2.99 | 1.13 | 12 | 0.24 | 2 |
| Results-based learning | SE3 | 3.33 | 1.31 | 8 | 3.07 | 1.19 | 3 | 0.26 | 5 |
| Internet access | SE4 | 3.34 | 1.26 | 5 | 3.05 | 1.14 | 7 | 0.29 | 9 |
| Satisfaction | SE5 | 3.28 | 1.37 | 19 | 3.00 | 1.20 | 11 | 0.28 | 8 |
| Digital learning materials | SE6 | 3.31 | 1.31 | 10 | 3.06 | 1.19 | 5 | 0.25 | 3 |
| Smart learning space | SE7 | 3.39 | 1.34 | 2 | 3.02 | 1.24 | 9 | 0.37 | 23 |
| Transparency | SG1 | 3.21 | 1.35 | 29 | 2.84 | 1.23 | 28 | 0.37 | 23 |
| Participation | SG2 | 3.29 | 1.24 | 14 | 2.98 | 1.12 | 13 | 0.31 | 14 |
| Process efficiency | SG3 | 3.36 | 1.26 | 3 | 3.01 | 1.18 | 10 | 0.35 | 18 |
| Biosecurity | SG4 | 3.29 | 1.26 | 13 | 2.87 | 1.14 | 25 | 0.42 | 31 |
| Cybersecurity | SG5 | 3.31 | 1.29 | 12 | 2.92 | 1.17 | 22 | 0.39 | 27 |
| Data management | SG6 | 3.33 | 1.29 | 9 | 3.06 | 1.19 | 4 | 0.27 | 6 |
| SDGs | SG7 | 3.29 | 1.29 | 16 | 2.94 | 1.17 | 17 | 0.35 | 18 |
| Internet technology | SG8 | 3.29 | 1.29 | 17 | 2.94 | 1.13 | 15 | 0.35 | 18 |
| Electronic services | SG9 | 3.42 | 1.36 | 1 | 3.17 | 1.27 | 1 | 0.25 | 3 |
| Digital economy | SP1 | 3.13 | 1.31 | 31 | 2.72 | 1.18 | 31 | 0.41 | 29 |
| Lifelong learning for alumni | SP2 | 3.23 | 1.24 | 25 | 2.88 | 1.18 | 24 | 0.35 | 18 |
| Health | SP3 | 3.27 | 1.30 | 20 | 2.93 | 1.20 | 18 | 0.34 | 16 |
| Collaborative research | SR1 | 3.23 | 1.38 | 26 | 2.93 | 1.24 | 20 | 0.30 | 11 |
| Collaborative research | SR2 | 3.25 | 1.30 | 21 | 2.95 | 1.16 | 14 | 0.30 | 11 |
| Digital data | SR3 | 3.28 | 1.27 | 18 | 2.88 | 1.15 | 23 | 0.40 | 28 |
| Data management | SR4 | 3.34 | 1.28 | 6 | 2.93 | 1.21 | 19 | 0.41 | 29 |
| Local development | SS1 | 3.22 | 1.33 | 28 | 2.87 | 1.20 | 26 | 0.35 | 18 |
| Collaborative economy | SS2 | 3.24 | 1.20 | 22 | 2.94 | 1.12 | 16 | 0.30 | 13 |
| Employability | SS3 | 3.31 | 1.32 | 11 | 3.04 | 1.22 | 8 | 0.27 | 6 |
| Extracurricular activities | SS4 | 3.33 | 1.32 | 7 | 3.1 | 1.21 | 2 | 0.23 | 1 |
| AVERAGE | - | 3.26 | 1.30 | - | 2.91 | 1.18 | - | 0.35 | - |
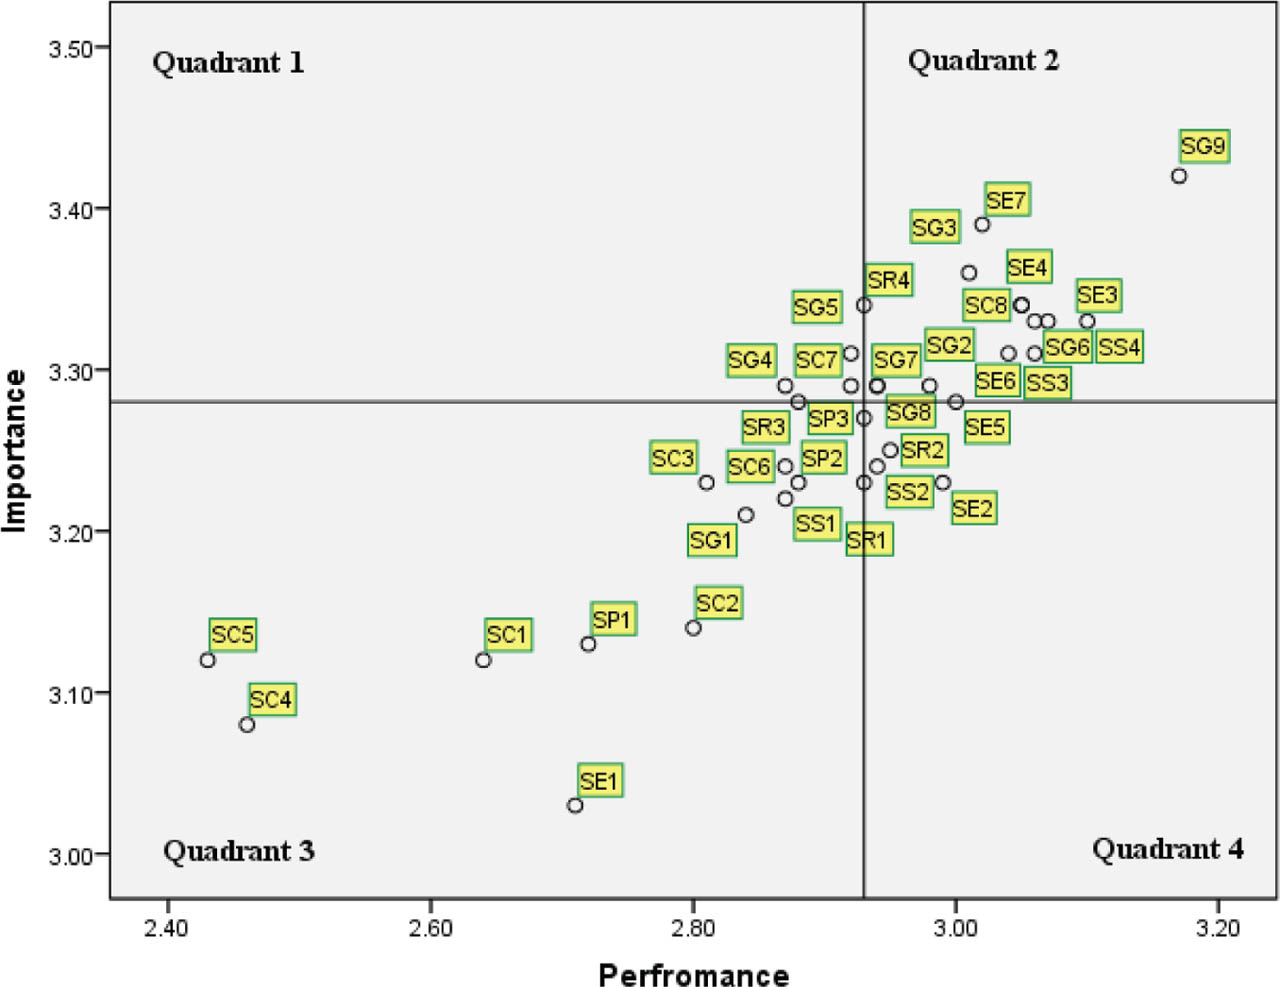
Figure 3:
IPA matrix results. IPA, importance-performance analysis.