
I. Introduction
Numerous universities worldwide have adjusted their goals to advance education and related fields in the rapidly evolving era of information technology [1, 2]. Innovations such as e-learning and the Internet of Things (IoT) are gradually reshaping the educational environment and fundamentally changing how teachers share knowledge with their students.
Several leading universities, such as the University of Minnesota (USA), Glasgow University (UK), and Deakin University (Australia), have developed miniature smart cities on their campuses. These models feature fully functioning roads, vehicles, buildings, libraries, and laboratories managed by advanced technology systems. The smart university model created by these institutions could serve as a blueprint for other universities looking to modernize. In Vietnam, the concept of smart universities is still relatively new and has not been fully implemented. Transitioning from a traditional university to a smart one requires careful planning and significant infrastructure and human resources investment.
A forward-thinking university uses internal technological advancements to achieve its objectives. It leverages cutting-edge hardware and software to introduce innovative and efficient methods for administrative tasks, teaching, learning, and other related activities. This includes a wide range of advanced technical applications, such as big data, sensors, social media networks, e-learning platforms, and even artificial intelligence (AI). These technologies provide the potential opportunity to revolutionize education by minimizing administrative affairs for enrollment, analyzing learners' and related parities' expectations, improving teaching and learning, offering new approaches to boost personalized learning, simplifying assessments, and reducing planning time for teachers.
II. Theoretical Background
For centuries, tertiary education has played a crucial role in the development of society in many countries. Scientists and scholars worldwide have dedicated time and effort to work with authorities and planners to develop their nations and communities.
Higher education institutions (HEIs) are not just places for imparting knowledge and educating human resources for a nation's development [3, 4], but also hubs for scientific research and technological advancement. Technologies such as cloud computing [5], big data [6], IoT [7], and AI [8] are essential tools for integrating traditional education and research, lifelong learning, innovation, and entrepreneurship driven by Industry 4.0. This integration is often referred to as a “smart campus” [9, 10, 11].
A smart campus (SC), as part of a sophisticated smart education (SE) system, provides a common information-based platform for users involved in intellectual learning, teaching, research, management, and other aspects of campus life. This concept has gained significant social and scientific attention worldwide, with a wide range of literature focusing on defining and predicting SCs. Examples include the vision of an intelligent campus [12], the taxonomy of smart universities outlining their primary components, features, and technologies [13], and the use of IoT and AI in a classroom within a SC [7].
Numerous scientists have proposed that technological advancements in economic, social, and environmental contexts will propel educational processes toward becoming “intelligent”. This transformation will lead to campuses becoming more effective teaching and learning environments, integrating with advanced technological infrastructures [14, 15, 16, 17, 18]. However, other scholars have suggested a new concept of a SC, defining it as an educational institution that prioritizes convenience, safety, effective leisure, and sustainable learning conditions. This is achieved through diverse and advanced amenities and technologies [19, 20].
Although there is no comprehensive view of a SC beyond its heavy interaction with leading technology and other shareholders' aspects, three popular definitions conceptualize a SC based on a (1) technology-focused approach, (2) smart city-focused approach, and (3) organizational process-focused approach [21, 22, 23].
Particularly, a smart tertiary institution uses advanced technologies to enhance teaching and learning [6, 14, 24]. It can also be seen as a miniature smart city, with humans at the center, supported by a developed economy and other smart circumstances [26, 27, 28, 39]. The third suggestion focuses on replacing traditional services with digital ones to optimize processes sustainably through information-sharing mechanisms [19, 27, 28, 29].
Recently, several universities in the US, Hong Kong, and Singapore have chosen to evolve into smart and sustainable institutions [19, 20, 31]. In response to the needs of students and other stake-holders, they have pursued this transformation by leveraging technology as a foundation and selecting relevant development indicators that are adaptable and suitable for specific circumstances to reach smart and sustainable development.
Vinh University (VU) is a prominent multidisciplinary institution in the north-central region of Vietnam. Its vision and mission have been focusing on becoming a smart and sustainable university, aiming to be ranked among the top 500 universities in Asia by 2030 and the top 1000 universities globally by 2045 (VU's annual reports, 2017–2023). Therefore, this study aims to initially analyze theoretical backgrounds, VU's background, and related circumstances to identify a suitable smart model. Then it is necessary to determine essential priorities for VU's leaders to plan and implement effective strategies successfully.
To create an innovative model for smart initiatives at VU, we envision a SC as a dynamic hub that fosters diverse and effective conditions for higher education. This encompasses governance-based regimes, social impact, safety measures, integrative learning models, and sustainable development driven by cutting-edge technologies to cater to stakeholders' evolving needs. Our proposed framework for a “smart and sustainable” campus includes 6 pivotal dimensions and 35 indicators based on three approaches and comprehensive studies of SCs worldwide mentioned above [19, 20, 26, 27, 30, 31, 32], the specific contexts at VU, and local conditions. These dimensions are SC (encompassing environment, transportation, and security), smart people (SP), smart governance (SG) (administration), SE, smart technology (research), and smart services (SS) (economic)—all interconnected in a circular diagram (Figure 1).
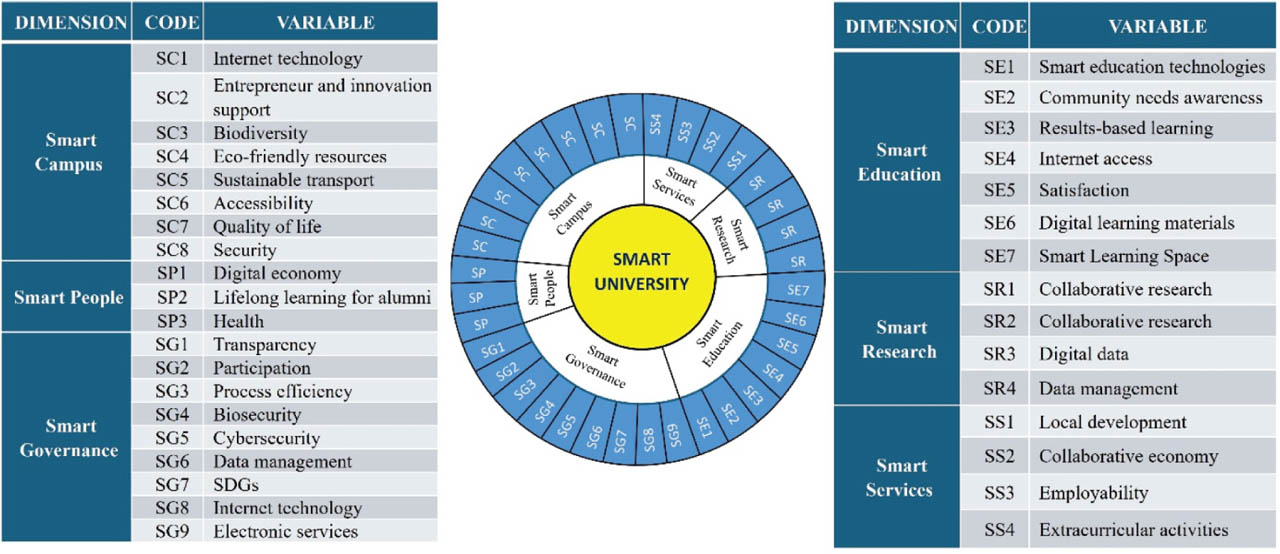
Figure 1:
A proposed framework for a smart sustainable campus. This was constructed based on current conditions at VU and adapted from [31, 32]. SC, smart campus; SE, smart education; SG, smart governance; SP, smart people; SR, smart research; SS, smart services; VU, Vinh University.
Besides those approaches to a smart university, there are some criteria used for university selection in Vietnam.
(i) The university must possess all the typical attributes of Vietnamese universities, including being a public establishment offering a wide range of programs and courses.
(ii) The institution must organize or carry out a SC program.
(iii) The institution must achieve some national recognition.
VU located in the north-central region of Vietnam, possesses the aforementioned standards and is therefore a suitable choice for us. The university has undergone over 60 years of construction and development, evolving from a pedagogical college to a multi-disciplinary university. Currently, it offers more than 57 undergraduate courses, 38 master's programs, and 17 doctoral programs, catering to over 20,000 full-time students. The number of staff is 1,010, including 322 with doctoral degrees, 50 associate professors and professors (VU's annual report, 2023).
VU operates across five campuses and has established a strategic vision to become a smart university that will be expected to be recognized and accredited globally. To achieve this goal, the university has implemented the Conceive–Design–Implement–Operate (CDIO) program for all undergraduate and graduate programs since 2017. This approach concerns entrepreneurship and innovation. It has also focused on innovating teaching methods, utilizing information technology, developing e-learning systems, and offering online teaching programs to continuously enhance the quality of education and other related services (VU's annual reports, 2017–2023).
In addition, VU was featured in the national media for its top ranking in the national ranking list. It has achieved a 4-star accreditation, meeting the quality standards compared to the top 100 universities in Asia. The university is also among the top 5 HEIs with the highest criteria ratio in infrastructure (VU's annual reports, 2021–2023). In 2021, out of 22 universities in Vietnam ranked by SCImago (SCImago Institutions Rankings), VU was placed 16th on the list.
Therefore, we utilized a framework previously validated by international experts in the context of VU to propose a model with 6 dimensions and 35 indicators (see Figure 1 and Table 1).
Table 1:
The smart-university dimensions, indicators, and variables for VU
| Dimensions | Indicators | Variables |
|---|---|---|
| SC | Our campuses use Internet technologies, such as the IoT. | Internet technology |
| Our campuses support business ideas through entrepreneurship centers, innovation centers, entrepreneur incubators, specialized centers, etc. | Entrepreneur and innovation support | |
| On our campuses, a protection program is available to manage biodiversity. | Biodiversity | |
| Our campus uses bioenergy and smart technologies to manage energy and resources, such as automatic lighting. | Eco-friendly resources | |
| VU encourages the use of low-carbon transport modes such as bicycles and electronic bikes. | Sustainable transport | |
| VU's main campus has wheelchair ramps for people with disabilities. | Accessibility | |
| VU has enough entertainment space and services to improve the users’ quality of life. | Quality of life | |
| VU has several security systems to ensure safety within the campuses (smart cameras, warning sensors, first aid, exit systems, and so on). | Security | |
| SP | All curriculums integrate modules to support learners in adapting to the challenges of the digital economy. | Digital economy |
| VU has lifelong learning support programs for alumni (including training, retraining, etc.). | Lifelong learning for alumni | |
| VU has healthcare programs for staff and learners. | Health | |
| SG | VU publishes an accountability program annually. | Transparency |
| VU implements strategic plans with the participation of stakeholders. | Participation | |
| VU has an online management platform. | Process efficiency | |
| Our campuses have biosafety protocols such as laboratory fume hoods, laboratory waste treatment systems, and systems/equipment/means to prevent the spread of diseases. | Biosecurity | |
| VU has a virtualized security system to prevent cyber-attacks. | Cybersecurity | |
| VU has a data management system with connectivity and sharing capabilities. | Data management | |
| VU develops actions toward the SDGs. | SDGs | |
| VU has systems such as webpages to offer and manage services to its stakeholders. | Internet technology | |
| Electronic transactions, such as paying university fees or making payments in stores, are available on campuses. | Electronic services | |
| SE | VU uses smart technologies for teaching, such as cloud computing, IoT, IA, and big data. | SE technologies |
| VU consults the community about its educational needs (e.g., course availability). | Community needs awareness | |
| VU utilizes results-based learning as the primary teaching methodology. | Results-based learning | |
| VU has an open and available internet bandwidth for all. | Internet access | |
| VU carries varying surveys frequently to identify the satisfaction level of students and staff. | Satisfaction | |
| VU has a system of digital learning resources to support learning needs. | Digital learning materials | |
| Smart learning space, such as an area for group activities (there are small rooms for 4–6 people and large rooms (15–20 people), self-study areas (where they ensure quiet surroundings, and have water purifiers to provide good drinking water to the students), and fast-food preparation areas, equipped with microwaves, washing areas, and so on. | Smart learning space | |
| SR | VU has cooperative connections with national scientists. | Collaborative research |
| VU has cooperative connections with international scientists for academic exchanges and sharing academic work. | Collaborative research | |
| VU has a digital data system to meet scientific research demands. | Digital data | |
| VU has a data management system to meet scientific research demands. | Data management | |
| SS | VU supports local economic development with community-oriented projects and actions. | Local development |
| VU has collaborative economy networks for sharing economic activities. | Collaborative economy | |
| VU has an employment support center. | Employability | |
| VU has extracurricular activities for the community. | Extracurricular activities |
III. Data and Methodology
a. Methodology
To achieve the main objectives of this study, three major steps have been taken:
1) By analyzing previous “smart campus” initiatives in sustainable development, assessing the current conditions, and consulting with experts at VU who possess diverse expertise in fields, such as IT, technology, sciences, economy, education, environment, and life sciences, we propose a hypothesized model for a smart and sustainable campus. This model encompasses 6 dimensions and 35 indicators, as detailed in the introduction (see Figure 1 and Table 1).
2) Conducting surveys among stakeholders to gather their perspectives on the current status at VU, as well as their needs, expectations, and satisfaction levels, can help prioritize issues and suggest appropriate solutions for decision-makers aimed at further development. This process contributes to informed decision making regarding resource management and enhances existing services and products to better meet the needs of campus residents. Experts have discussed, analyzed, and agreed that these 6 dimensions and 35 indicators will cover the essential elements that make up a smart university. toward sustainable development at VU.
3) A quantitative descriptive–exploratory approach has attempted an importance-performance analysis (IPA) technique[34, 35, 36, 37]. This tool has been chosen as it is widely utilized in identifying customer/learner satisfaction and management strategies. This technique can help stakeholders diagnose underlying deficiencies and set priorities in educational development.
The surveyed data analysis was conducted using the IBM SPSS 20 through the IPA matrix, which is divided into four quadrants (Figure 2). The first quadrant contains the most important variables with low satisfaction, indicating that resources should be allocated to improve these items first. The second quadrant includes facilities that perform well and are important, suggesting that their quality should be maintained. The third quadrant comprises underperforming and insignificant items, which are of low priority. The fourth quadrant is made up of items with high performance but low importance, indicating a potential misallocation of resources [34]. In Figure 2, In Quadrant 1, the heading should be “Focus here” instead of “Forcus here”. In Quadrant 2, instead of “highly”, it should be “paramount”.
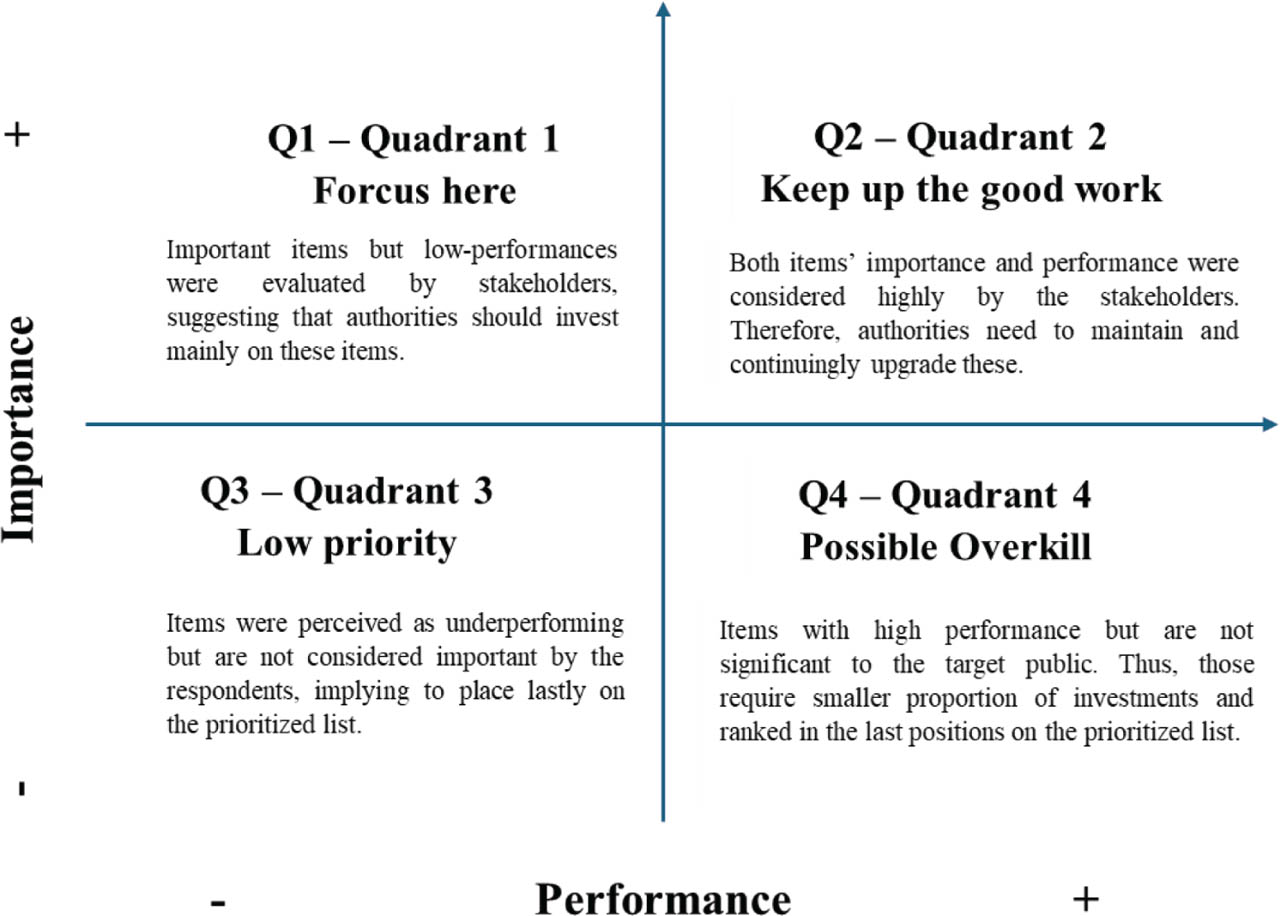
Figure 2:
IPA matrix. Contents of this figure were adapted from [32]. IPA, importance-performance analysis.
One of the key aspects of the IPA method is selecting the best cut-off point [35]. The data-centered method is also used to distinguish the IPA thresholds, as it is the most practical method and has substantial discriminatory power [36].
b. Data
A set of questionnaires was created based on the dimensions, indicators, and variables in Table 1 to evaluate the performance and importance of each indicator at VU in achieving a smart and sustainable model. The questionnaires use a 5-level Likert scale ranging from 1 to 5 (1- very poor, 2- poor, 3- normal, 4- good, 5- very good) to assess both the current situation and the importance of each indicator.
The survey was conducted in November 2023 using an online platform with Microsoft Forms. It was sent to various groups associated with VU, such as students, lecturers, administrative officers, alumni, and employers.
The questionnaire survey aimed to determine the stakeholders' perceptions of implementing SC applications at VU. The questionnaire was composed of 6 sections and 36 questions that aimed to determine the demographics of participants, their background of a SC, and their evaluation of the current performance and expectations for VU to become a smart and sustainable campus. The regulatory impact assessment (RIA) is based on stakeholders' perceptions. Thirty-five of these total questions pertain to the 35 indicators, categorized into 2 groups, namely, current performance and importance (expectations). Additionally, there is one open-ended question for respondents to share their opinions or requests.
Out of 500 questionnaires sent, 453 responses were received. After data cleaning, 381 valid responses were obtained. In 2023, the university had over 20,000 full-time students (as per VU's annual report, 2023). Therefore, considering a random sample with a 95% confidence level and 5% margin of error, the sample size is deemed appropriate.
To achieve accurate survey results, Rajgor et al. [38] suggested that the minimum number of respondents is 100, thus the sample size as described in this study is likely appropriate to fulfill its purpose.
IV. Research Results
We received 453 responses, in which only 381 were valid, while the remaining 72 respondents had missing data. The main sample characteristics were as follows: 52% were female, aged 18 to over 60 years old, 68% were current learners (undergraduates and postgraduates), and 32% were from various professions, such as administrators, lecturers, administrative officers, specialists, technicians, alumni, and employers, as shown in Table 2.
Table 2:
Demographic profile of respondents
| Characteristic | Number of respondents | Percentage (%) |
|---|---|---|
| Sex | ||
| Female | 199 | 52 |
| Male | 182 | 48 |
| Age | ||
| Between 18 and 30 years old | 270 | 70.9 |
| Between 31 and 40 years old | 51 | 13.4 |
| Between 41 and 50 years old | 54 | 14 |
| Between 51 and 60 years old | 5 | 1.3 |
| More than 60 years old | 1 | 0.4 |
| Stakeholders | ||
| Administrators | 17 | 4.5 |
| Lecturers | 57 | 15 |
| Administrative officers, specialists, technicians | 17 | 4.5 |
| Learners | 259 | 68 |
| Alumni | 15 | 3.9 |
| Employers | 16 | 4.2 |
a. Descriptive analysis
Descriptive statistics quickly describe the data characteristics through a simplified set of values [39]. It mainly uses the data median and quartiles that compose the 5-number summary: minimum and maximum range values, marking the interval length by putting whiskers as the lines.
b. IPA analysis
The Cronbach's alpha coefficient was extracted for importance and performance samples before conducting the IPA to ensure data reliability. All dimensions scored higher than 0.8 of Alpha, which is considered reliable and indicates adequate internal consistency of the dataset [35, 36]. Table 3 presents the scale indices and the general score by dimension.
Table 3:
Dimensions statistics
| Ranking | Importance | Performance | Gap | |||||||
|---|---|---|---|---|---|---|---|---|---|---|
| Dimension | Mean | SD | Alpha | Dimension | Mean | SD | Alpha | Dimension | I-P | |
| 1 | SG | 3.31 | 1.17 | 0.97 | SS_P | 2.99 | 1.09 | 0.94 | SE | 0.29 |
| 2 | SS | 3.28 | 1.20 | 0.95 | SE_P | 2.98 | 1.03 | 0.95 | SS | 0.29 |
| 3 | SE | 3.27 | 1.20 | 0.97 | SG_P | 2.97 | 1.01 | 0.96 | SG | 0.34 |
| 4 | SR | 3.27 | 1.23 | 0.95 | SR_P | 2.92 | 1.08 | 0.93 | SR | 0.35 |
| 5 | SP | 3.21 | 1.19 | 0.92 | SP_P | 2.84 | 1.06 | 0.87 | SP | 0.37 |
| 6 | SC | 3.20 | 1.16 | 0.96 | SC_P | 2.75 | 0.88 | 0.89 | SC | 0.45 |
| - | Total | 3.26 | 1.19 | 0.95 | Total | 2.91 | 1.03 | 0.92 | Total | 0.35 |
The dimension rated most important by students and other stakeholders at VU was SG, with a mean score of 3.31 and a standard deviation (SD) of 1.17 (Table 3). This indicates that the effective governing system at VU was highly valued, with aspects, such as transparency, participation, process efficiency, biosecurity, cybersecurity, data management, SDGs, internet technology, and electronic services being particularly appreciated. VU has made significant efforts to enhance its administrative system through the application of technology, regularly consulting and reporting annual outcomes to stakeholders, and updating reports on the website. On the other hand, the dimension rated as less important by stakeholders was SCs, with a mean score of 3.20 and a SD of 1.16.
In terms of performance, the standout aspects at VU are SS and SE, with mean scores of 2.99 and 2.98, respectively (Table 3). However, the scores are not very high, but rather at a moderate level. The SS dimension includes local development, collaborative economy, employability, and extracurricular activities, while the SE dimension comprises SE technologies, community-based awareness, results-based learning, internet access, satisfaction, digital learning materials, and smart learning space. The lowest performance was recorded with a mean of 2.75 and a SD of 0.88. Stakeholders believe that VU performed poorly in internet technology, entrepreneurship and innovation support, biodiversity, eco-friendly resources, sustainable transport, and other related aspects within this dimension.
In addition, there were insignificant gaps between the expectation of a smart university and the reality at VU in all dimensions, ranging from 0.29 to 0.45 on a scale of 1–5 points (Table 3).
Table 4 provides information on the average scores of all indicators, including their means and SDs, as well as the ranking for higher values regarding importance and performance. The gaps also indicate the areas that need improvement to transform a university into a smart one, offering guidance for administrators on how to lead their campuses through the process of digital transformation. According to the respondents, the gap ranking is crucial for evaluating the quality of attributes, as a smaller gap indicates higher quality for that attribute.
Table 4:
IPA results
| Variables | Importance | Performance | Gap | ||||||
|---|---|---|---|---|---|---|---|---|---|
| Code | Mean | SD | Rank | Mean | SD | Rank | I-P | Rank | |
| Internet technology | SC1 | 3.12 | 1.36 | 32 | 2.64 | 1.22 | 33 | 0.48 | 33 |
| Entrepreneur and innovation support | SC2 | 3.14 | 1.28 | 30 | 2.8 | 1.08 | 30 | 0.34 | 17 |
| Biodiversity | SC3 | 3.23 | 1.25 | 27 | 2.81 | 1.15 | 29 | 0.42 | 31 |
| Eco-friendly resources | SC4 | 3.08 | 1.31 | 34 | 2.46 | 1.13 | 34 | 0.62 | 34 |
| Sustainable transport | SC5 | 3.12 | 1.32 | 33 | 2.43 | 1.17 | 35 | 0.69 | 35 |
| Accessibility | SC6 | 3.24 | 1.33 | 23 | 2.87 | 1.14 | 27 | 0.37 | 23 |
| Quality of life | SC7 | 3.29 | 1.33 | 15 | 2.92 | 1.19 | 21 | 0.37 | 23 |
| Security | SC8 | 3.34 | 1.32 | 4 | 3.05 | 1.21 | 6 | 0.29 | 9 |
| SE technologies | SE1 | 3.03 | 1.38 | 35 | 2.71 | 1.22 | 32 | 0.32 | 15 |
| Community–based awareness | SE2 | 3.23 | 1.25 | 24 | 2.99 | 1.13 | 12 | 0.24 | 2 |
| Results-based learning | SE3 | 3.33 | 1.31 | 8 | 3.07 | 1.19 | 3 | 0.26 | 5 |
| Internet access | SE4 | 3.34 | 1.26 | 5 | 3.05 | 1.14 | 7 | 0.29 | 9 |
| Satisfaction | SE5 | 3.28 | 1.37 | 19 | 3.00 | 1.20 | 11 | 0.28 | 8 |
| Digital learning materials | SE6 | 3.31 | 1.31 | 10 | 3.06 | 1.19 | 5 | 0.25 | 3 |
| Smart learning space | SE7 | 3.39 | 1.34 | 2 | 3.02 | 1.24 | 9 | 0.37 | 23 |
| Transparency | SG1 | 3.21 | 1.35 | 29 | 2.84 | 1.23 | 28 | 0.37 | 23 |
| Participation | SG2 | 3.29 | 1.24 | 14 | 2.98 | 1.12 | 13 | 0.31 | 14 |
| Process efficiency | SG3 | 3.36 | 1.26 | 3 | 3.01 | 1.18 | 10 | 0.35 | 18 |
| Biosecurity | SG4 | 3.29 | 1.26 | 13 | 2.87 | 1.14 | 25 | 0.42 | 31 |
| Cybersecurity | SG5 | 3.31 | 1.29 | 12 | 2.92 | 1.17 | 22 | 0.39 | 27 |
| Data management | SG6 | 3.33 | 1.29 | 9 | 3.06 | 1.19 | 4 | 0.27 | 6 |
| SDGs | SG7 | 3.29 | 1.29 | 16 | 2.94 | 1.17 | 17 | 0.35 | 18 |
| Internet technology | SG8 | 3.29 | 1.29 | 17 | 2.94 | 1.13 | 15 | 0.35 | 18 |
| Electronic services | SG9 | 3.42 | 1.36 | 1 | 3.17 | 1.27 | 1 | 0.25 | 3 |
| Digital economy | SP1 | 3.13 | 1.31 | 31 | 2.72 | 1.18 | 31 | 0.41 | 29 |
| Lifelong learning for alumni | SP2 | 3.23 | 1.24 | 25 | 2.88 | 1.18 | 24 | 0.35 | 18 |
| Health | SP3 | 3.27 | 1.30 | 20 | 2.93 | 1.20 | 18 | 0.34 | 16 |
| Collaborative research | SR1 | 3.23 | 1.38 | 26 | 2.93 | 1.24 | 20 | 0.30 | 11 |
| Collaborative research | SR2 | 3.25 | 1.30 | 21 | 2.95 | 1.16 | 14 | 0.30 | 11 |
| Digital data | SR3 | 3.28 | 1.27 | 18 | 2.88 | 1.15 | 23 | 0.40 | 28 |
| Data management | SR4 | 3.34 | 1.28 | 6 | 2.93 | 1.21 | 19 | 0.41 | 29 |
| Local development | SS1 | 3.22 | 1.33 | 28 | 2.87 | 1.20 | 26 | 0.35 | 18 |
| Collaborative economy | SS2 | 3.24 | 1.20 | 22 | 2.94 | 1.12 | 16 | 0.30 | 13 |
| Employability | SS3 | 3.31 | 1.32 | 11 | 3.04 | 1.22 | 8 | 0.27 | 6 |
| Extracurricular activities | SS4 | 3.33 | 1.32 | 7 | 3.1 | 1.21 | 2 | 0.23 | 1 |
| AVERAGE | - | 3.26 | 1.30 | - | 2.91 | 1.18 | - | 0.35 | - |
The results from the IPA show that electronic services (3.17), extracurricular activities (3.10), results-based learning (3.07), data management (3.06), internet access (3.05), security (3.05), employability (3.04), smart learning space (3.02), and process efficiency (3.01) are the most prominent items. However, all the performing factors had lower than average performance, scoring under 3, with a mean of 2.91 and a SD of 1.18 (Table 4).
To improve its electronic services, VU has primarily shifted traditional administrative activities to electronic platforms. These include providing various online amenities and platforms for enrollment, tuition fee payment, electronic announcements, and other forms of assistance. The university also emphasizes extracurricular activities that meet appropriate standards, such as offering training programs for local officials and lecturers and constantly imparting up-to-date techniques to local farmers and communities in the central region of Vietnam. Moreover, there have been significant positive changes in educational programs, including a dramatic shift toward a learner-centered approach, focusing on developing learners' capacities and teaching based on output standards rather than traditional knowledge transmission. These positive changes have been well received by all involved parties.
In contrast, the worst-performing variables are sustainable transport (2.43), eco-friendly resources (2.46), and internet technology (2.64). Regarding sustainable transportation, all campuses at VU are of medium size, making it easy and convenient to move around either within each campus or between two campuses using wheelchairs or other modes of transport. Currently, even though there is no bus service between campuses, which is a limitation, the university's leaders are planning to invest in or collaborate with local transport companies on this initiative.
The highest levels of satisfaction among related parties are related to extracurricular activities (0.23), community–based awareness (0.24), and electronic services (0.25), as indicated by the smallest gap between importance and performance. On the other hand, the lowest levels of satisfaction are associated with sustainable transport (0.69), eco-friendly resources (0.62), and internet technology (0.48).
The university is proud to embrace a modern approach to creating SCs that promote sustainable development. This approach focuses not only on cutting-edge technology selected from various universities worldwide [19, 20] but also serves as the basis for developing new educational models that take into account a wide range of aspects to meet the satisfaction of stakeholders [19, 26, 40, 41].
Figure 3 illustrates the IPA matrix of 4 quadrants representing indicators that are expected to guide VU'ss authorities in prioritizing the smartization process. The first quadrant comprises 11.4% of the attributes, indicating high importance but low performance. Quadrant 1 includes variables from three different dimensions: cybersecurity (SG5), quality of life (SC7), and biosecurity (SG4). Among these, cybersecurity is the most important dimension, ranked 12th in the general ranking, but its performance is ranked 22nd, and satisfaction is ranked 27th. Decision-makers should pay more attention to these items to improve their performance.
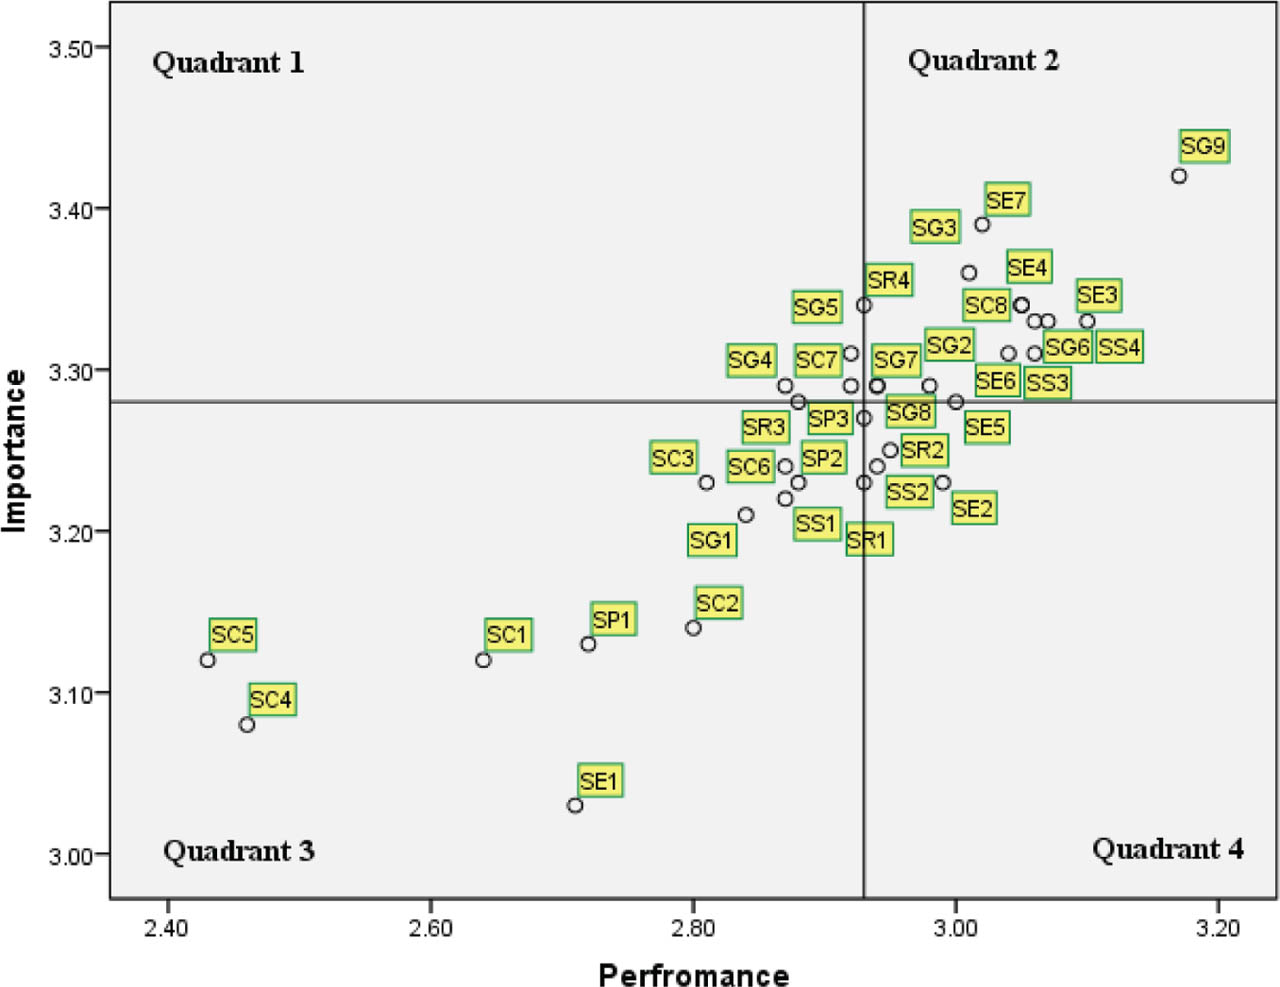
Figure 3:
IPA matrix results. IPA, importance-performance analysis.
Quadrant 2 encompasses the most attributes (13), accounting for 37.1% of variables. This section guides decision-makers in maintaining these high-quality services. The variables in this quadrant are of high importance and perform well at VU, according to stakeholders' perspectives. The most outstanding item is electronic services, which ranks first in both importance and performance and third in satisfaction. This quadrant comprises numerous indicators across six dimensions, including data management (SR4), employability (SS3), extracurricular activities (SS4), results-based learning (SE3), internet access (SE4), participation (SG2), process efficiency (SG3), data management (SG6), SDGs (SG7), internet technology (SG8), electronic services (SG9), digital learning materials (SE6), smart learning space (SE7).
In Quadrant 3, 14 attributes were collected, representing 40% of the variables, indicating significant low-scoring components for importance and performance. The authorities should give the least consideration to these attributes. A total of 14 indicators in this section across five dimensions include internet technology (SC1), entrepreneur and innovation support (SC2), biodiversity (SC3), eco-friendly resources (SC4), sustainable transport (SC5), accessibility (SC6); digital economy (SP1), lifelong learning for alumni (SP2), health (SP3); collaborative research (SR1), digital data (SR3); smart education (SE1), smart governance (SG1), and smart service (SS1), digital economy (SP1), lifelong learning for alumni (SP2), health (SP3), collaborative research (SR1), digital data (SR3), transparency (SG1), and local development (SS1). Despite the significance of this quadrant, sustainable transport (SC5) is ranked 33 in the general ranking, and even lower in both performance and satisfaction (35).
In Quadrant 4, 11.4% of variables (4) showed high performance but were considered insignificant for students and other stakeholders, possibly indicating the allocation of excessive resources. The most emphasized attribute in this quadrant is community awareness (SE2), ranked 24th overall with a performance score of 12 and a satisfaction level of 2. The variables in this quadrant belong to three dimensions: SE in community needs awareness (SE2), satisfaction (SE5), SR in collaborative research (SR2), and SS in collaborative economy (SS2), and SG in internet technology (SG8).
V. Discussion
The primary objective of this research is to identify valuable elements within the dimensions and variables from the perspectives of VU citizens. The findings are crucial for providing university administrators with the most important considerations for developing smart and sustainable campuses.
Initially, this experiment was developed based on a previous comprehensive framework for selecting essential components of a SC. Despite the various applications of advanced technology in the digitalization of campuses, recent theoretical considerations have pointed toward the need for leaders to establish a comprehensive and sustainable living environment within their campuses [26, 33]. As a result, our research has determined and assessed six potential dimensions: SC (encompassing environment, transportation, and security), SP, SG (administration), SE, smart technology (SR), and SS (economic) (Figure 1). Defining the number of dimensions and indicators of a smart university varies by country and institutional context. However, all parts of the university need to strive for comprehensive and sustainable development [23,40]. This study adapts a set of 35 relevant indicators for each dimension into an IPA matrix, offering practical guidance for authorities to manage their campuses effectively and sustainably. Previous research at the Federal University of Campina Grande (FUCG, Brazil) developed a smart and sustainable model with 8 dimensions and 38 indicators [33], whereas American University of Sharjah (AUS) established a smart model composed of 8 main components and 25 indicators in favor of IoT and cloud computing platforms [19].
Additionally, scientists in Singapore have proposed a conceptual human-based framework for understanding smart universities, which includes four primary components, such as technology, human investment, environmental sustainability initiatives, and institutional collaboration [20].
The IPA method was chosen for this research as it is utilized for measuring user/learner satisfaction and expectation, enabling easy and practical identification of a service's strengths and areas needing improvement and prioritization [33].
The performance assessment reveals an average value of 2.9 across various dimensions, with the SC receiving the lowest score at 2.75, while SS reached the highest at 2.99. In contrast, a previous study at Federal University of Campina Grande (UFCG) reported a slightly lower average performance value of 2.56, with smart security (SE) ranking the lowest and smart management (MA) the highest. Furthermore, the average importance value at VU stands at 3.26, which is significantly lower compared to UFCG's value of 4.65 [32]. This leads to another striking point where the average I-P gap of the 6 dimensions is relatively low at 0.35. This value is much smaller than the previous study (2.08) [32]. The gap in knowledge among stakeholders regarding the lack of familiarity with the concept of a SC and its attributes may lead to low expectations regarding VU's current capabilities and future potential to become a smart university. These factors present challenges for VU in achieving its objectives. At VU, the performing indicators exhibited slight fluctuations, with scores ranging from 2.43 for sustainable transport to 3.17 for electronic services. In contrast, UFCG demonstrated more significant variation, with scores spanning from 1.68 for sustainable transport to 3.72 for process efficiency. This suggests that, while no specific indicator particularly excels, the leadership at VU is committed to equitable development across all areas. Notably, both VU and UFCG recorded the lowest performance and importance ratings for sustainable transport. This trend may be attributed to the fact that both universities are situated in developing countries, where investment in this area is not a primary focus. However, to ensure future sustainability, this aspect requires increased investment attention.
The key components identified by stakeholders at VU for building a SC in Q1 are cybersecurity (SG5), quality of life (SC7), and biosecurity (SG4). The push for a SC, in light of increasing IoT usage and informatization, emphasizes the importance of robust cybersecurity measures due to potential vulnerabilities, which is a pressing scientific concern [20, 23]. Notably, almost 70% of interviewees are students who express a strong interest in enhancing campus life through improved facilities, such as sports services, entertainment options, study areas, and playgrounds for children. While these amenities exist at VU, they require significant upgrades.
The top-performing variables identified in Q2 (refer to Figure 3) encompass electronic services (SG9), smart learning space (SE7), extracurricular activities (SS4), process efficiency (SG3), internet access (SE4), and results-based learning (SE3). These variables align with the literature on SCs, which focuses on not only technology but also sustainability and social actions aimed at enhancing residents' service, education, and quality of life [12, 23, 42].
The indicators for Q3 and Q4, which constitute 51.4% of the evaluation, include initiatives with strong performance that are expected to be sustained or prioritized in the university's strategy to evolve into a smart and sustainable institution. For example, activities, such as sustainable transport (SC5), satisfaction (SE5), and SS in the collaborative economy (SS2) have been successfully implemented and should continue, while entrepreneur and innovation support (ranked 30 with a score of 2.80) and SE technology (ranked 32 with a score of 2.71) are currently being rolled out to enhance project-based teaching in line with the CDIO framework. However, these initiatives have not yet received significant appreciation due to the university's current limited investment capacity. Consequently, while VU is pursuing a path of smart development with an emphasis on sustainability, it faces challenges similar to those reported by numerous universities worldwide, where specific conditions, performance metrics, and stakeholder expectations can vary significantly. These contextual factors are vital for university leaders to set appropriate priorities to achieve their objectives.
a. Implications
The findings of this research contribute significantly to the existing literature on SC studies in several key ways. The study begins by investigating the current models, implementations, and applications of SC initiatives in educational institutions. It appears that educational organizations have only begun to tap into a small fraction of the potential offered by these findings. Due to the absence of a comprehensive framework that addresses the essential components of a SC along with practical guidance, the authors propose an optimized framework based on criteria derived from the existing literature and specific conditions. This framework is designed to provide scholars, relevant stakeholders, and institutional leaders with a structured approach to developing a SC in a specific context—an area that remains underexplored in the current literature.
Another significant contribution of this study is its exploration of the perceived performance and importance of SC indicators from the perspectives of various stakeholders, including students, authorities, staff, alumni, and employers. Initially, the researchers anticipated that students would prioritize SC facilities such as internet technology and SE technology, which are closely linked to advanced technologies and automated processes that enable efficient data management, online connectivity, and numerous smart functions to enhance teaching and learning activities. However, the findings revealed that stake-holders primarily prioritize security and living conditions on campus, including cybersecurity, biosecurity, and quality of life. This research lays the groundwork for future studies aimed at developing decisions and strategies that will assist decision-makers and investors in making informed choices regarding the value and costs associated with SC facilities and applications.
b. Limitations and strengths
There are several challenges that VU faces in its efforts to transform a traditional campus into a SC:
- Interviewees expressed similar concerns, identifying the average performance of all key components in the SC implementation, in which science and technology-related facilities, while remaining at low average levels, pose the most significant hurdle.
- The high costs associated with upgrading technologies and modern facilities within the SC pose a considerable challenge.
- There is a lack of leading examples and suitable guidance to effectively implement smart facilities.
- The knowledge gap regarding SC initiatives among stakeholders at VU could impact the efficiency of adopting cutting-edge technologies.
- Low expectations of stakeholders about VU's capacities and possibilities in the transition from a traditional education model to a smart model are also a big challenge and require the leaders to increase their determination and efforts to achieve their goals.
Although there are traditionally conservative views among some individuals, coupled with apprehensions about the risks associated with modern models, VU has several advantages that can help it overcome these challenges and drive smartization:
- The university is guided by a clear vision and mission to evolve into a smart university.
- Its facilities have received commendations from Vietnamese higher education accreditation experts, ranking in the top 5 out of nearly 200 universities in Vietnam.
- VU is positioned favorably within a national context, as the Vietnamese government is actively promoting digital transformation and advancing the development of science and technology. With internet access extending from urban to rural areas, nearly all students at VU possess smart-phones that facilitate learning and enable them to stay updated with the latest information and technologies.
VI. Conclusion, Recommendations, and Future Direction
a. Conclusion
This research is novel as it focuses on developing a smart university model for VU by suggesting possible applications of modern technology aligned with sustainable development in particular conditions. This model is the first of its kind in Vietnam, particularly in the north-central region, where technological development is still emerging.
The research findings indicate that VU has achieved moderate performance levels, ranging from 2.75 to 2.99, in its progress toward becoming a SC. The indicators that are rated as having the highest level of performance are: electronic services (SG9, 3.17), extracurricular activities (SS4, 3.10), and results-based learning (SE3, 3.0), while figures for the lowest are internet technologies (SC1, 2.64), sustainable transport (SC5, 2.43) and eco-friendly resources (SC4, 2.46). Regarding indicator importance, the highest values belong to electronic services (SG9, 3.42), smart learning space (SE7, 3.39), and process efficiency (SG3, 3.36). In contrast, the lowest expectation values related to SE technologies (SE1, 3.03), eco-friendly resources (SC4, 3.08), and sustainable transport (SC5, 3.12). Interestingly, the average was a minimal fluctuation among the performance indicators, suggesting that VU has been actively advancing smart management by promoting an effective, integrated, transparent, and comprehensive system with the active contribution of stakeholders. This action needs to be further enhanced to achieve all goals.
VU is expected to mainly invest in Q1, including cybersecurity (SG5), quality of life (SC7), and biosecurity (SG4), and upgrade the quality of indicators in Q2, continuing to focus on electronic services (SG9), smart learning space (SE7), and internet access (SE4). However, other facilities related to leading-edge technologies are lacking, or the quality is just average. This is essential for proposing future steps and solutions for the leaders to plan and achieve their goals.
b. Recommendations
This research offers statistical insights to inform the future development and planning of SCs of VU and aims to enhance understanding of the current SC landscape in Vietnam. Following administrative-driven design principles, the recommendations for SC development will be categorized into four key areas: promotion, plan, funding and infrastructure, collaboration and sustainability.
b.i. Promotion
The survey indicates that respondents with a higher level of technological knowledge are more open to adopting new learning methods, such as e-learning and project-based learning. It also highlights that a limited understanding of the smart university concept among interviewees contributes to a smaller gap between importance and performance. Therefore, enhancing stakeholders' knowledge about SCs by training can help accelerate their popularity and foster stakeholder engagement in future SC development and raising the awareness of SC capabilities and the latest technologies. This can be achieved by increasing the promotion of SCs and providing more opportunities for the public to experience them firsthand. Promotion efforts should target not only students, teachers, and university administrative staff but also alumni and employers. Effective measures, such as training courses, media announcements, and social work, are necessary to motivate stake-holders to learn more about SCs and their features.
b.ii. Strategies (plan, funding, and infrastructure)
Respondents agreed that with a clear vision of smart transformation, the efforts and determination of VU's leaders in achieving the goal could solve the difficulties in implementing this transformation.
The data suggest that VU's leaders should have proper planning and an increase in funding for smart facility reinforcement, particularly by investing in key areas in Q1 and Q2, as previously discussed, as the university transitions toward a SC. In addition to prioritizing indicators that stakeholders are interested in, VU should also increase investment in indicators related to science and technology to enhance academic prestige and cutting-edge technological facilities, such as internet technology, SE technology, blockchain, and AI as these digital infrastructures are essential for promoting the smartization of educational institutions, but are still lacking or only implemented at an average level.
b.iii. Collaboration
An increase in the budget for infrastructure and various sectors, including project-based learning led by the CDIO, collaborative research, internet technology, SE technology, and entrepreneur innovation support for all training programs, necessitates the university to pursue comprehensive collaboration with enterprises, other educational institutions, and financial organizations. This collaboration is essential to secure the resources needed to promote innovative studies and distinguished research.
b.iv. Sustainability
Interestingly, the priority expectations of numerous stakeholders, as highlighted in Q1 and Q2, underscore a strong commitment to sustainable development, particularly regarding SG5, SG4, SE7, and SS4, indicating a collective focus on these critical aspects.
Furthermore, the survey reveals that VU has weaker eco-friendly resources and sustainable transport, as these factors were rated the lowest by stake-holders. To enhance the sustainable development of the SC, it is suggested that the relevant departments should integrate sustainable energy solutions and raise environmental awareness among citizens by implementing appealing energy policies and products. Offering incentives for sustainable transportation could also include discounted or free parking within campuses for those using electric vehicles and bicycles.
In summary, the perceptions of campus stake-holders are critical for leaders to prioritize their investments into appropriate sectors promoting smart processes, as they are the primary users who will engage directly with these facilities and changes in educational institutions. However, further in-depth research is necessary to clearly understand the crucial indicators recommended by this study, and to clarify the essential resources and specific circumstances for specific funding allocation.